Market Basket Analysis in Data Mining
Market basket analysis is a data mining technique used by retailers to increase sales by better understanding customer purchasing patterns. It involves analyzing large data sets, such as purchase history, to reveal product groupings and products that are likely to be purchased together.
The adoption of market basket analysis was aided by the advent of electronic point-of-sale (POS) systems. Compared to handwritten records kept by store owners, the digital records generated by POS systems made it easier for applications to process and analyze large volumes of purchase data.
Implementation of market basket analysis requires a background in statistics and data science and some algorithmic computer programming skills. For those without the needed technical skills, commercial, off-the-shelf tools exist.
One example is the Shopping Basket Analysis tool in Microsoft Excel, which analyzes transaction data contained in a spreadsheet and performs market basket analysis. A transaction ID must relate to the items to be analyzed. The Shopping Basket Analysis tool then creates two worksheets:
- The Shopping Basket Item Groups worksheet, which lists items that are frequently purchased together,
- And the Shopping Basket Rules worksheet shows how items are related (For example, purchasers of Product A are likely to buy Product B).
How does Market Basket Analysis Work?
Market Basket Analysis is modelled on Association rule mining, i.e., the IF {}, THEN {} construct. For example, IF a customer buys bread, THEN he is likely to buy butter as well.
Association rules are usually represented as: {Bread} -> {Butter}
Some terminologies to familiarize yourself with Market Basket Analysis are:
- Antecedent:Items or 'itemsets' found within the data are antecedents. In simpler words, it's the IF component, written on the left-hand side. In the above example, bread is the antecedent.
- Consequent:A consequent is an item or set of items found in combination with the antecedent. It's the THEN component, written on the right-hand side. In the above example, butter is the consequent.
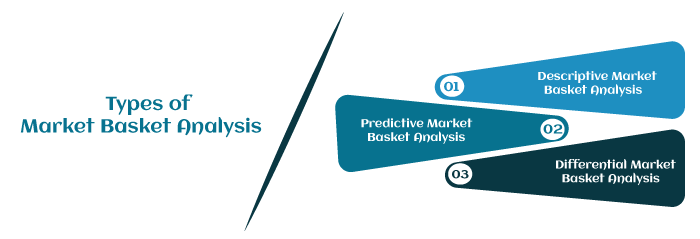
Types of Market Basket Analysis
Market Basket Analysis techniques can be categorized based on how the available data is utilized. Here are the following types of market basket analysis in data mining, such as:

- Descriptive market basket analysis: This type only derives insights from past data and is the most frequently used approach. The analysis here does not make any predictions but rates the association between products using statistical techniques. For those familiar with the basics of Data Analysis, this type of modelling is known as unsupervised learning.
- Predictive market basket analysis: This type uses supervised learning models like classification and regression. It essentially aims to mimic the market to analyze what causes what to happen. Essentially, it considers items purchased in a sequence to determine cross-selling. For example, buying an extended warranty is more likely to follow the purchase of an iPhone. While it isn't as widely used as a descriptive MBA, it is still a very valuable tool for marketers.
- Differential market basket analysis: This type of analysis is beneficial for competitor analysis. It compares purchase history between stores, between seasons, between two time periods, between different days of the week, etc., to find interesting patterns in consumer behaviour. For example, it can help determine why some users prefer to purchase the same product at the same price on Amazon vs Flipkart. The answer can be that the Amazon reseller has more warehouses and can deliver faster, or maybe something more profound like user experience.
Algorithms associated with Market Basket Analysis
In market basket analysis, association rules are used to predict the likelihood of products being purchased together. Association rules count the frequency of items that occur together, seeking to find associations that occur far more often than expected.
Algorithms that use association rules include AIS, SETM and Apriori. The Apriori algorithm is commonly cited by data scientists in research articles about market basket analysis. It identifies frequent items in the database and then evaluates their frequency as the datasets are expanded to larger sizes.
R's rules package is an open-source toolkit for association mining using the R programming language. This package supports the Apriori algorithm and other mining algorithms, including arulesNBMiner, opusminer, RKEEL and RSarules.
With the help of the Apriori Algorithm, we can further classify and simplify the item sets that the consumer frequently buys. There are three components in APRIORI ALGORITHM:
For example, suppose 5000 transactions have been made through a popular e-Commerce website. Now they want to calculate the support, confidence, and lift for the two products. For example, let's say pen and notebook, out of 5000 transactions, 500 transactions for pen, 700 transactions for notebook, and 1000 transactions for both.
SUPPORT
It has been calculated with the number of transactions divided by the total number of transactions made,
support(pen) = transactions related to pen/total transactions
i.e support -> 500/5000=10 percent
CONFIDENCE
Whether the product sales are popular on individual sales or through combined sales has been calculated. That is calculated with combined transactions/individual transactions.
Confidence = combine transactions/individual transactions
i.e confidence-> 1000/500=20 percent
LIFT
Lift is calculated for knowing the ratio for the sales.
Lift-> 20/10=2
When the Lift value is below 1, the combination is not so frequently bought by consumers. But in this case, it shows that the probability of buying both the things together is high when compared to the transaction for the individual items sold.
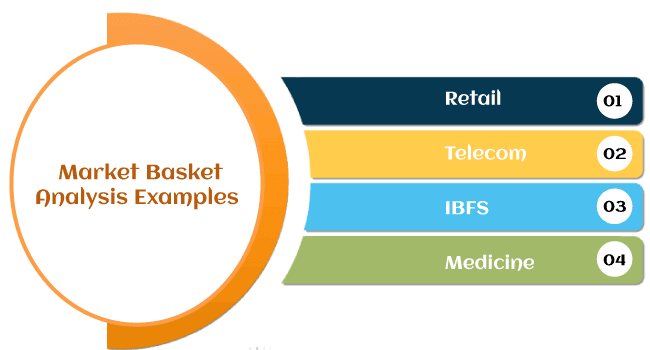
Examples of Market Basket Analysis
Here are the following examples that explore Market Basket Analysis by market segment, such as:

- Retail: The most well-known MBA case study is Amazon.com. Whenever you view a product on Amazon, the product page automatically recommends, "Items bought together frequently." It is perhaps the simplest and most clean example of an MBA's cross-selling techniques.
Apart from e-commerce formats, BA is also widely applicable to the in-store retail segment. Grocery stores pay meticulous attention to product placement based and shelving optimization. For example, you are almost always likely to find shampoo and conditioner placed very close to each other at the grocery store. Walmart's infamous beer and diapers association anecdote is also an example of Market Basket Analysis.
- Telecom: With the ever-increasing competition in the telecom sector, companies are paying close attention to customers' services. For example, Telecom has now started to bundle TV and Internet packages apart from other discounted online services to reduce churn.
- IBFS: Tracing credit card history is a hugely advantageous MBA opportunity for IBFS organizations. For example, Citibank frequently employs sales personnel at large malls to lure potential customers with attractive discounts on the go. They also associate with apps like Swiggy and Zomato to show customers many offers they can avail of via purchasing through credit cards. IBFS organizations also use basket analysis to determine fraudulent claims.
- Medicine: Basket analysis is used to determine comorbid conditions and symptom analysis in the medical field. It can also help identify which genes or traits are hereditary and which are associated with local environmental effects.
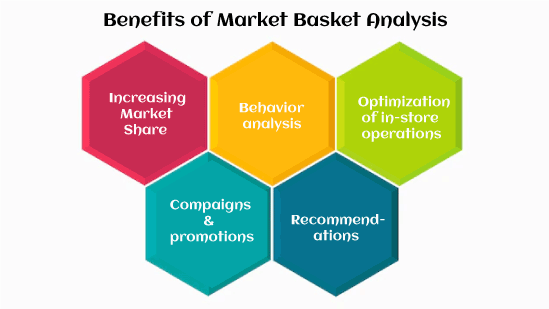
Benefits of Market Basket Analysis
The market basket analysis data mining technique has the following benefits, such as:

- Increasing market share: Once a company hits peak growth, it becomes challenging to determine new ways of increasing market share. Market Basket Analysis can be used to put together demographic and gentrification data to determine the location of new stores or geo-targeted ads.
- Behaviour analysis: Understanding customer behaviour patterns is a primal stone in the foundations of marketing. MBA can be used anywhere from a simple catalogue design to UI/UX.
- Optimization of in-store operations: MBA is not only helpful in determining what goes on the shelves but also behind the store. Geographical patterns play a key role in determining the popularity or strength of certain products, and therefore, MBA has been increasingly used to optimize inventory for each store or warehouse.
- Campaigns and promotions: Not only is MBA used to determine which products go together but also about which products form keystones in their product line.
- Recommendations: OTT platforms like Netflix and Amazon Prime benefit from MBA by understanding what kind of movies people tend to watch frequently.
|


 For Videos Join Our Youtube Channel: Join Now


