| |

Visual and Audio Data MiningData mining is a process that interacts with a massive set of data. In this perspective, it unravels interesting patterns from unknown data structured. The same may apply to audio and video data mining as well. Today, users can access a large volume of multimedia data generated from information technology and the easy availability of multimedia systems. Hence, the amount of audio and video data available today grows exponentially. Video falls under the multimedia category that contains various data comprising text, image, visual, audio, and meta-data. Audio-video mining holds a major place in different applications across security and surveillance, medicine discovery, education, entertainment, and sports. The key objective of video data mining is to extract data from video sources and discover and define patterns and dynamics. What is Visual Data Mining?Visual data mining uses data and knowledge visualization methods to find implicit and beneficial knowledge from huge data sets. The eyes and brain manage the human visual system, the latter of which can be thought of as a dynamic, largely parallel processing and reasoning engine, including a huge knowledge base. Visual data mining essentially combines the power of these components, making it a highly attractive and effective tool for the comprehension of data distributions, patterns, clusters, and outliers in data. Visual data mining can be considered as an association of two disciplines such as data visualization and data mining. It can also associate with computer graphics, multimedia systems, human-computer interaction, pattern identification, and high-performance computing. In general, data visualization and data mining can be integrated into the following ways: 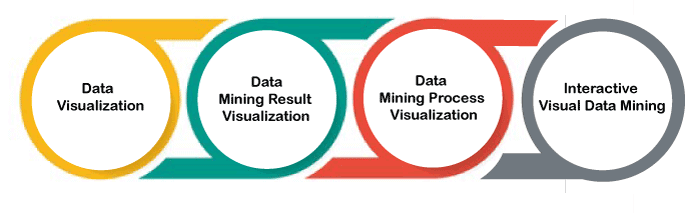
Visual Data Mining TechniquesFor data mining to be effective, it is important to include humans in the data exploration process and combine the flexibility, creativity, and general knowledge of the human with the enormous storage capacity and the computational power of today's computers. First, the data analyst typically specifies some parameters to restrict the search space; an algorithm performs data mining automatically. Finally, the patterns found by the automatic data-mining algorithm are presented to the data analyst on the screen. Since an automatic data-mining algorithm generates many patterns in textual form, it is almost impossible for humans to interpret and evaluate the pattern in detail and extract interesting knowledge and general characteristics. Visual data mining aims to integrate humans in the data-mining process and apply human perceptual abilities to analyze large datasets available in today's computer systems. Presenting data in an interactive, graphical form often fosters new insights, encouraging the formation and validation of new hypotheses to the end of better problem-solving and gaining deeper domain knowledge. Visual data exploration usually follows a three-step process: Overview, zoom and filter, and then details-on-demand. First, the data analyst needs to get an overview of the data. In the overview, the data analyst identifies interesting patterns or groups in the data and focuses on one or more of them. For analyzing the patterns, the data analyst needs to drill down and access the details of the data. Visualization technology may be used for all three steps of the data exploration process. 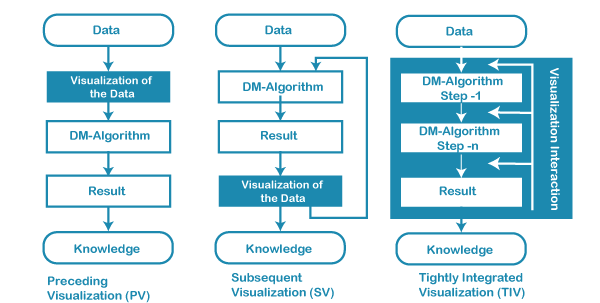
Visualization techniques are useful for showing an overview of the data, allowing the data analyst to identify interesting subsets. This step is important to keep the overview visualization while focusing on the subset using another visualization technique. This can be done by dedicating a larger display percentage to the interesting subsets while decreasing screen utilization for uninteresting data. To further explore the interesting subsets, the data analyst needs a drill-down capability to observe the details about the data. Note that visualization technology provides the base visualization techniques for all three steps and bridges the gaps between the steps. Visual data mining can be seen as a hypothesis-generation process; the visualizations of the data allow the data analyst to gain insight into the data and come up with new hypotheses. Verifying the hypotheses can also be done via data visualization, but it may also be accomplished by automatic techniques from statistics, pattern recognition, or machine learning. As a result, visual data mining usually allows faster data exploration and often provides better results, especially in cases where automatic data-mining algorithms fail. In addition, visual data exploration techniques provide a much higher degree of user satisfaction and confidence in the exploration findings. This fact leads to high demand for visual exploration techniques and makes them indispensable with automatic exploration techniques. Visual Data Mining ApproachesVisual data mining is based on an automatic part, the data-mining algorithm, and an interactive part, the visualization technique. There are three common approaches to integrating humans in the data exploration process to realize different approaches to visual data mining. 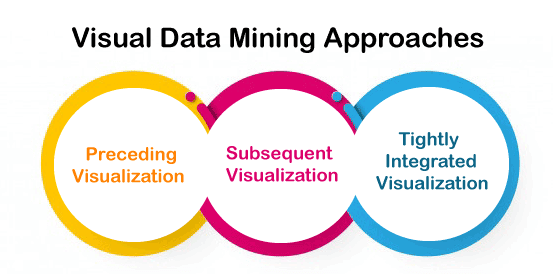
AdvantagesIn addition to the direct involvement of the human, here are the following main advantages of visual data exploration over automatic data-mining techniques, such as:
What is Audio Data Mining?Audio data mining uses audio signals to indicate data patterns or the features of data mining results. Although visual data mining may disclose interesting patterns using graphical displays, it requires users to concentrate on watching patterns and identifying interesting or novel features within them. This can sometimes be quite tiresome. If patterns can be transformed into sound and music, we can listen to pitches, rhythm, tune, and melody instead of watching pictures to identify anything interesting or unusual. This may relieve some of the burdens of visual concentration and be more relaxing than visual mining. Therefore, audio data mining is an interesting complement to visual mining. Applications of Audio and Visual MiningHere, we will discuss different use cases of audio and video data mining in businesses, such as: 1. Traffic control management Whether traffic control or traffic violation monitoring, video data mining or analytics can be used to reach better decision making regarding traffic management, the live feed is extracted from the cameras installed upon the traffic posts. This live input is added to the database system to process it. As per the available data extracted from the video, the traffic control system will control the devices attached to the systems. If it detects anything suspicious on the road, such as the speeding driver or miscreant activity, the system alerts the system administrator via the analytics dashboard. Other progress reports on the road are also monitored and dispatched via a separate database. 2. Vehicles monitoring procedures The video processing via video data mining can be leveraged to control various public vehicles or transport at different busy locales. AI-based video processing is one of the useful tools to monitor vehicles. The vehicle traffic department can use a video-based vehicle monitoring system. This is used to monitor the traffic flow on highways to determine the exact speed and travel time of transports and accurate toll values. The CCTV cameras provide images of the moving transports, which are analyzed with a video image processor. The vehicles detected by the image sequencing tool are external communication output. 3. Enhanced Security with Live Video Streaming Enhancing the security and safety of people is a primary objective of surveillance. The main objective is to track behavior, activities, and other data to ensure safety. A video processing system embedded with surveillance is important for monitoring and security. Provided an access control, it works in line with video processing surveillance and provides useful information about a person entering the premises through a live video stream feed. Using AI-based facial recognition technology, it assigns unique identifiers to persons to enable them to enter any areas of the premises with an authorization level access. 4. Health Status Monitoring Surveillances embedded with CCTV video streams can help detect the health status of patients in hospitals as well. A camera that captures video streams of an infant is ideal for detecting the infant's respiratory troubles using an Eulerian video magnification and optical flow algorithms. The extracted information from the camera can be used later to offer better treatment options for the ailments. 5. Customer Demographic Data on Hand Speech recognition technology is widely used to extract data for discovering customer demographic information. The technology leverages an extensive data-mining process on your audio/video resources and identifies a different range of information about a customer. It involves gender, age, emotion and sentiment, language, and many more. 6. Automated Transcription of Audio/Video Data Small businesses can benefit from audio/video data mining that helps transcribe different unstructured data extracted from video and audio. This converts accurate texts from audio/video sources, enabling businesses to find relevant information to increase productivity and efficiency. At the same time, the whole process helps you automate many activities such as complaint analysis, demographic analysis, legal compliance, and more. 7. Understanding Customer opinions accurately. Your customer opinion matters most as they determine success or failure for your business. Using an AI-based data mining process involving speech recognition can help you interpret your customers' exact and accurate meaning about your product and service. In most cases, it performs extensive data mining on the recorded calls. This gives you more scopes to establish a better strategy for customer support and a unique customer experience.
Next TopicClass Comparison Methods in Data Mining
|
 For Videos Join Our Youtube Channel: Join Now
Feedback
- Send your Feedback to [email protected]
Help Others, Please Share


