Advantages of Tableau

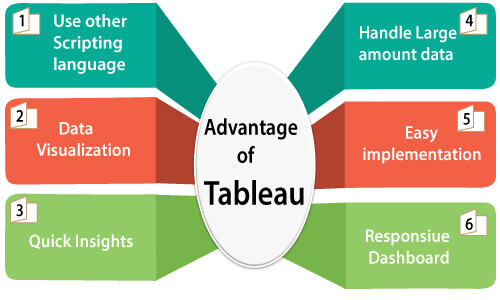
- Data Visualization:- Tableau is a data visualization tool, and provides complex computation, data blending, and dashboarding for creating beautiful data visualizations.
- Quickly Create Interactive Visualization:- Users can create a very interactive visual by using drag n drop functionalities of Tableau.
- Comfortable in Implementation:- Many types of visualization options are available in Tableau, which enhances the user experience. Tableau is very easy to learn in comparison to Python. Who don't have any idea about coding, they also can quickly learn Tableau.
- Tableau can Handle Large Amounts of Data:- Tableau can easily handle millions of rows of data. A large amount of data can create different types of visualization without disturbing the performance of the dashboards. As well as, there is an option in Tableau where the user can make 'live' to connect different data sources like SQL, etc.
- Use of other Scripting Language in Tableau:- To avoid the performance issues and to do complex table calculations in Tableau, users can include Python or R. Using Python Script, user can remove the load of the software by performing data cleansing tasks with packages. However, Python is not a native scripting language accepted by Tableau. So you can import some of the packages or visuals.
- Mobile Support and Responsive Dashboard:- Tableau Dashboard has an excellent reporting feature that allows you to customize dashboard specifically for devices like a mobile or laptops. Tableau automatically understands which device is viewing the report by the user and make adjustments to ensure that accurate report is delivered to the right device.
Disadvantages of Tableau

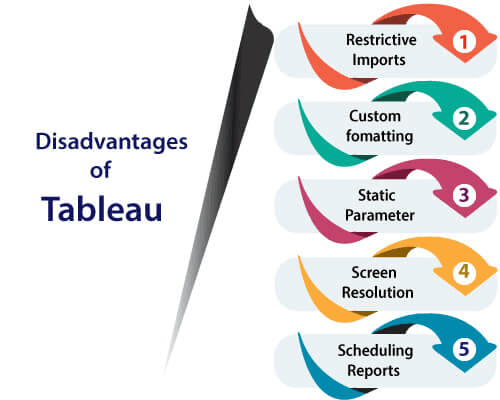
- Scheduling of Reports:- Tableau does not provide the automatic schedule of reports. That's why there is always some manual effort required when the user needs to update the data in the back end.
- No Custom Visual Imports:- Other tools like Power BI, a developer can create custom visual that can be easily imported in Tableau, so any new visuals can recreate before imported, but Tableau is not a complete open tool.
- Custom Formatting in Tableau:- Tableau's conditional formatting, and limited 16 column table that is very inconvenient for users. Also, to implement the same format in multiple fields, there is no way for the user that they can do it for all fields directly. Users have to do that manually for each, so it is a very time-consuming.
- Static and Single Value Parameter:- Tableau parameters are static, and it always select a single value as a parameter. Whenever the data gets changed, these parameters also have to be updated manually every time. There is no other option for users that can automate the updating of parameters.
- Screen Resolution on Tableau Dashboards:- The layout of the dashboards is distributed if the Tableau developer screen resolution is different from users screen resolution.
Example:- If the dashboard is created on the screen resolution of 1920 X 1080 and it viewed on 2560 X 1440, then the layout of the dashboard will be destroyed a little bit, their dashboard is not responsive. So, you will need to create a dashboard for desktop and mobile differently.
|


 For Videos Join Our Youtube Channel: Join Now


