| |

History of TableauUntil the early 21st century, the Database were used to produce numbers and data. It's the job of IT professionals to analyze the data and create reports. Tableau was founded by Pat Hanrahan, Christian Chabot, and Chris Stolte from Stanford University in 2003. The main idea behind its creation is to make the database industry interactive and comprehensive. Tableau appears in the era when there were already established companies like Cognos, Microsoft Excel, Business Objects, etc. It managed to climb the success chart with $3.8 billion of current market value. Since then, the company is growing day by day. In August 2016, Tableau announced and appointed Adam Selipsky as president and CEO of the company. What made Tableau Popular?The main logic behind creating this tool was developing a simple and user-friendly tool that can help you in creating graphs, charts, maps, reports as well as assist you in the next-gen concepts like the predictive and prescriptive analysis. 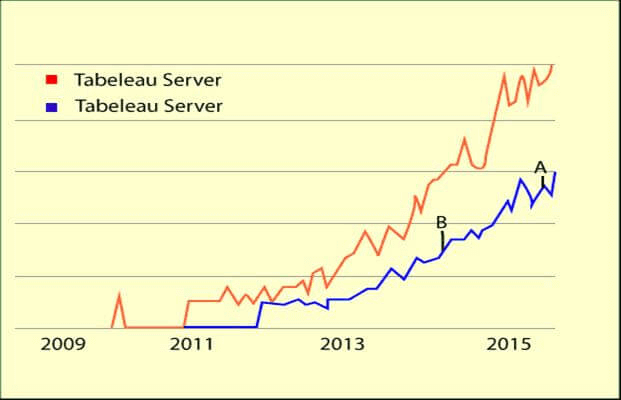
The worldwide business analytics market grew from $37.7 billion in 2013 to $59.2 billion in 2018, which translates to 9.4% compounded annual growth rate for the forecast period. The main features that led Tableau Software to achieve success are-
Some recently introduced versions of Tableau have the following features: Tableau 9.0
Tableau 10.0
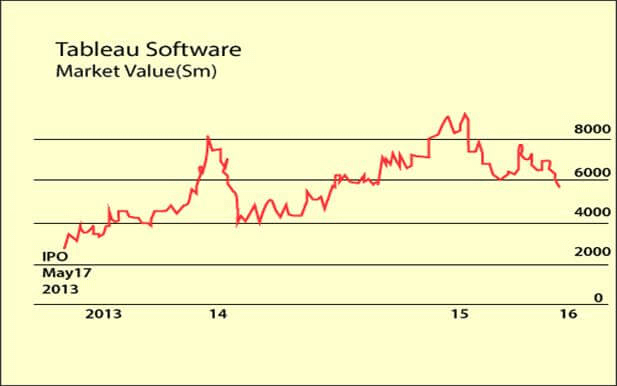
Tableau has seen a considerable growth of 82% in its annual sales over the past seven years from $18 million in 2009 to $654 million in 2015, making it to obtain the highest position in the ranking chart. This company now ranks under top 10 BI tools giving competition to other old tools like IBM, Microsoft, Qlik, Oracle, etc. A report by Forbes in 2016 shows that the total income of Tableau grew 32% in the first quarter to $172 million, with foreign income up to 52%. The company closed 268 transactions greater than $100,000, up to 8% per year. If Tableau continues to perform with the same speed, its net worth will be in the $3 billion counted as one of the top three BI companies in the world.
Next TopicAdvantages & Disadvantages
|
 For Videos Join Our Youtube Channel: Join Now
Feedback
- Send your Feedback to [email protected]
Help Others, Please Share


