What is Data Visualization?Data visualization is a graphical representation of quantitative information and data by using visual elements like graphs, charts, and maps. Data visualization convert large and small data sets into visuals, which is easy to understand and process for humans. Data visualization tools provide accessible ways to understand outliers, patterns, and trends in the data. In the world of Big Data, the data visualization tools and technologies are required to analyze vast amounts of information. Data visualizations are common in your everyday life, but they always appear in the form of graphs and charts. The combination of multiple visualizations and bits of information are still referred to as Infographics. Data visualizations are used to discover unknown facts and trends. You can see visualizations in the form of line charts to display change over time. Bar and column charts are useful for observing relationships and making comparisons. A pie chart is a great way to show parts-of-a-whole. And maps are the best way to share geographical data visually. Today's data visualization tools go beyond the charts and graphs used in the Microsoft Excel spreadsheet, which displays the data in more sophisticated ways such as dials and gauges, geographic maps, heat maps, pie chart, and fever chart. What makes Data Visualization Effective?Effective data visualization are created by communication, data science, and design collide. Data visualizations did right key insights into complicated data sets into meaningful and natural. American statistician and Yale professor Edward Tufte believe useful data visualizations consist of ?complex ideas communicated with clarity, precision, and efficiency. 
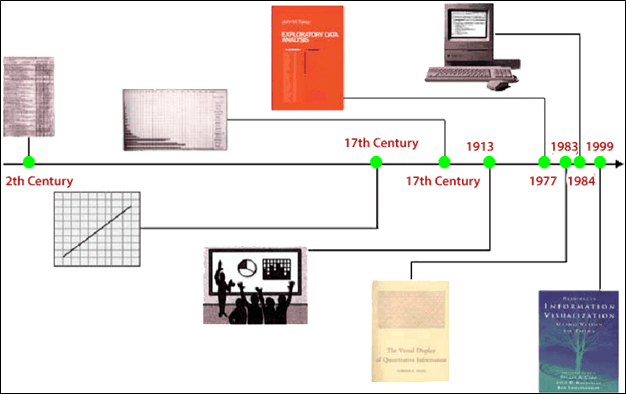
To craft an effective data visualization, you need to start with clean data that is well-sourced and complete. After the data is ready to visualize, you need to pick the right chart. After you have decided the chart type, you need to design and customize your visualization to your liking. Simplicity is essential - you don't want to add any elements that distract from the data. History of Data VisualizationThe concept of using picture was launched in the 17th century to understand the data from the maps and graphs, and then in the early 1800s, it was reinvented to the pie chart. Several decades later, one of the most advanced examples of statistical graphics occurred when Charles Minard mapped Napoleon's invasion of Russia. The map represents the size of the army and the path of Napoleon's retreat from Moscow - and that information tied to temperature and time scales for a more in-depth understanding of the event. Computers made it possible to process a large amount of data at lightning-fast speeds. Nowadays, data visualization becomes a fast-evolving blend of art and science that certain to change the corporate landscape over the next few years. 
Importance of Data VisualizationData visualization is important because of the processing of information in human brains. Using graphs and charts to visualize a large amount of the complex data sets is more comfortable in comparison to studying the spreadsheet and reports. Data visualization is an easy and quick way to convey concepts universally. You can experiment with a different outline by making a slight adjustment. Data visualization have some more specialties such as:
Data visualization tools have been necessary for democratizing data, analytics, and making data-driven perception available to workers throughout an organization. They are easy to operate in comparison to earlier versions of BI software or traditional statistical analysis software. This guide to a rise in lines of business implementing data visualization tools on their own, without support from IT. Why Use Data Visualization?
Next TopicTop 10 Data Visualization Tools
|
 For Videos Join Our Youtube Channel: Join Now
Feedback
- Send your Feedback to [email protected]
Help Others, Please Share


