Tableau Data Terminology
Tableau is a powerful data visualization tool; that's why Tableau has many unique terminologies and definitions. You should know their meaning before you start using these features in Tableau.
The most commonly used Tableau terminologies are listed below:
- Alias: Alias is an alternative that you can assign to a dimension member, to a measurement part or a field.
- Bin: Bin is a user-defined group of measures in the data source.
- Bookmark: A .tbm document in the bookmarks folder in the Tableau repository that contains a single worksheet. It helps in improving data analysis. Unlike, web browser bookmarks, .tbm files are a compatible way to display various studies quickly.
- Calculated field: Calculated field is a new field that the user creates derived files by using a formula to modify the existing fields in your data source. It is used to make your work simple and easy.
- Crosstab: Crosstab is used for a text table view. It uses various text tables to display the numbers associated with dimension members.
- Dashboard: The dashboard is a combination of several views that are arranged on a single page. In Tableau, dashboards are used to observe and compare a variety of data together, and also it allows interacting with other worksheets.
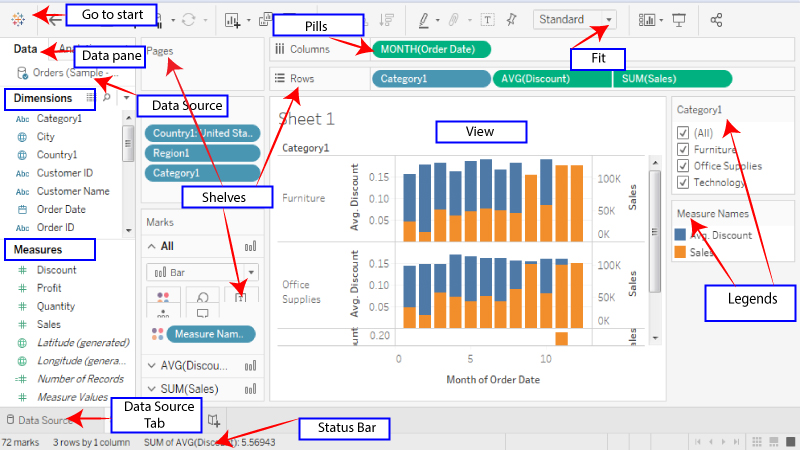
- Data Pane: The data pane is on the left side of the workbook displays the fields of the data sources to which Tableau is connected. The fields are further divided into measures and dimensions. The data pane also reflects custom fields such as groups, binned fields, calculations, and many more. You can build views of your data by dragging fields from the data pane onto the various shelves, which is a part of every worksheet.
- Data Source Page: Data Source is a page where you can set up your data source. This data source page generally consists of four main areas ? join area, left pane, a preview area, and metadata area.
- Dimension: Dimension is commonly known as a field of categorical data. Dimensions hold discrete data such as members and hierarchies that cannot be aggregated. It also contains characteristic values such as dates, names, and geographical data. The dimensions used to reveal details of your information.
- Extract: An extract is a saved subset of a data source which is used to improve performance and study offline. The users can create an extract by defining limits and filters that contain the data which you want in the extract.
- Filters Shelf: Filter shelf is located on the left side of the workbook. Filters shelf is used to exclude the data from a view by filtering it using both dimensions and measures.
- Format Pane: The Format pane is on the left side of the workbook, and it contains various formatting settings. It controls the entire view of the worksheet, as well as the individual fields in the view.
- Level of Detail expression (LOD): The level of detail Expression is a syntax that supports the combination of various dimensions other than the view level. With the help of detail expressions, one can attach multiple dimensions with an aggregate expression.
- Marks: Marks is a part of the view that visually represents one or more rows in a data source. It can be a line, square, or bar. You can control and alter the size, type, and color of marks.
- Marks Card: Marks card is on the left side of the worksheet. The user can drag fields to the control mark properties such as color, type, shape, size, label, detail, and tooltip.
- Pages Shelf: Page shelf is on the left side of the view. With the help of the page shelf, you can split a view into a sequence of pages based on the values and members in a continuous or discrete field. Adding a field with the pages shelf is similar to adding a field in rows shelf. For each new row, a new page is created.
- Rows shelf: Row shelf is on the top of the workbook. It is used to create the rows of a data table. The Row shelf provides any numbers of measures and dimensions. When you placed a dimension on the Rows shelf, then Tableau creates headers for the members of that dimension. And when you place a measure on the Rows shelf, Tableau creates quantitative axes for that particular measure.
- Shelves: The shelves are named areas that are located on the top and left of the view. You can build views by placing fields onto the shelves. Some shelves are only available when you select a particular mark type. For example, The Shape shelf is only open when you choose the specific Shape mark type.
- Workbook: A workbook is a file with .twb extension that holds one or more worksheets as well as dashboards and stories.
- Worksheet: The worksheet is a collection of sheets. It's a place where you build views of your data by dragging various fields onto the shelves.
|

 For Videos Join Our Youtube Channel: Join Now


