| |

Tableau Desktop WorkspaceClick on the Tableau icon displayed in the left-hand side of the Tableau worksheet page and expose the contents of the worksheet tab selected at the bottom of the screen. When you connect with a new data source, this is the default workspace view. 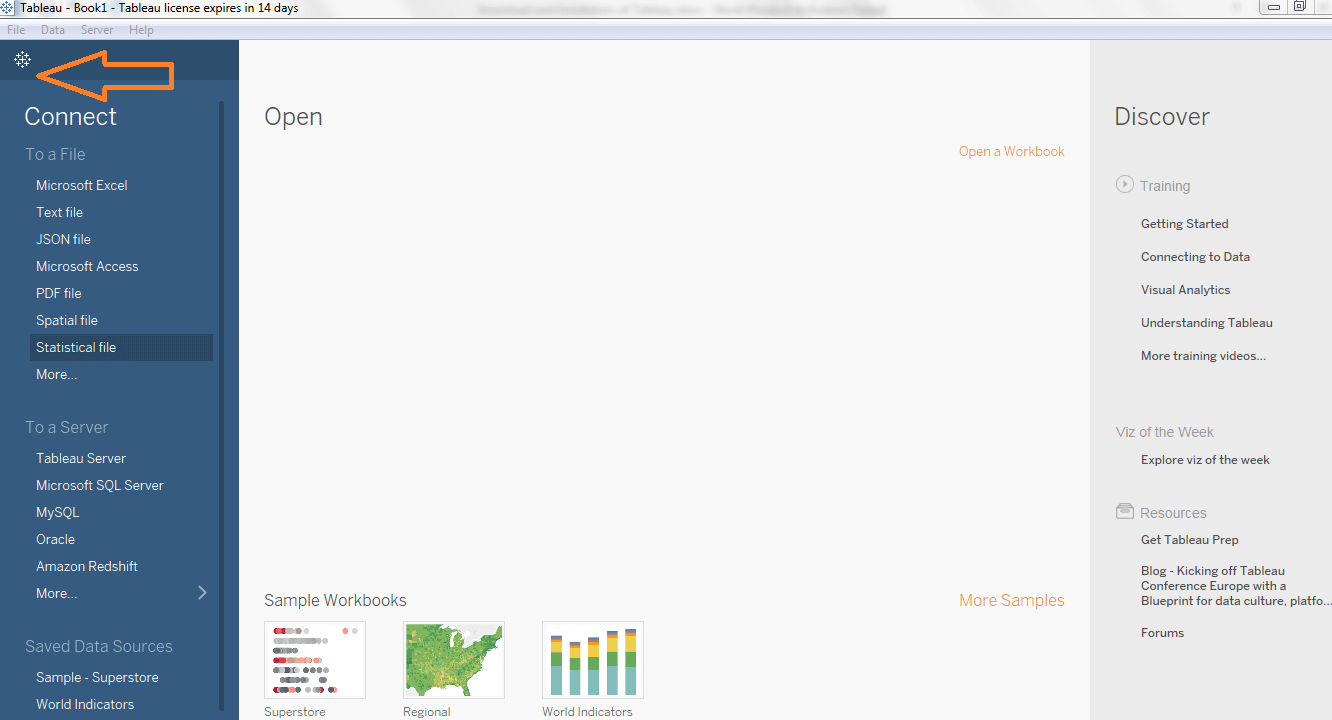
Go to the home page and select the global superstore sales-Excel sheet. 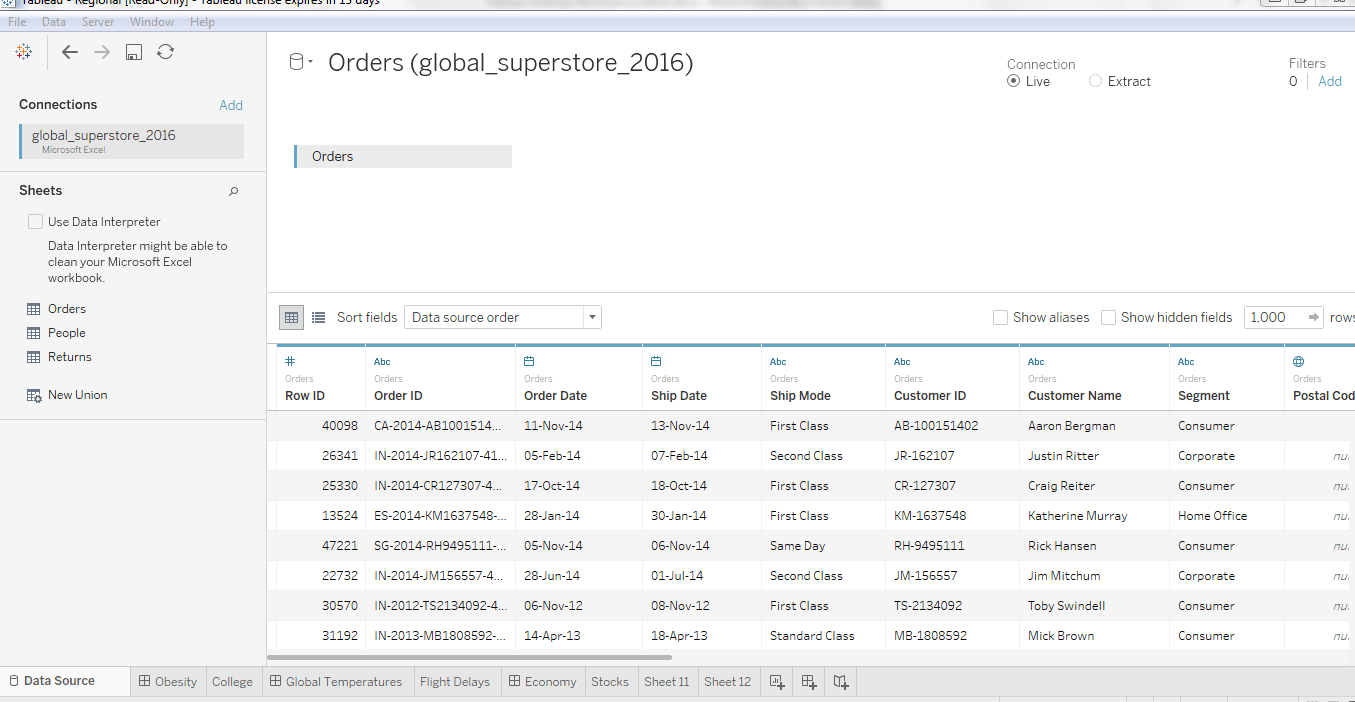
Open a connection to a saved data source, you also should have an open blank worksheet. 
In many ways, you can open a workspace page; for example, go to the display Tableau's icon on your desktop and you have a data source shown on your desktop. Dragging any data source icon and dropping it on the Tableau icon opens Tableau's worksheet page for the selected data source. Also, you can open as many connections as you need in Tableau by going to the data connection page or start page and select a new connection. Now, the worksheet is connected to the global Superstore Sales-Excel dataset. Tableau Desktop Workspace MenuThe Tableau desktop workspace consists of various elements as given below: 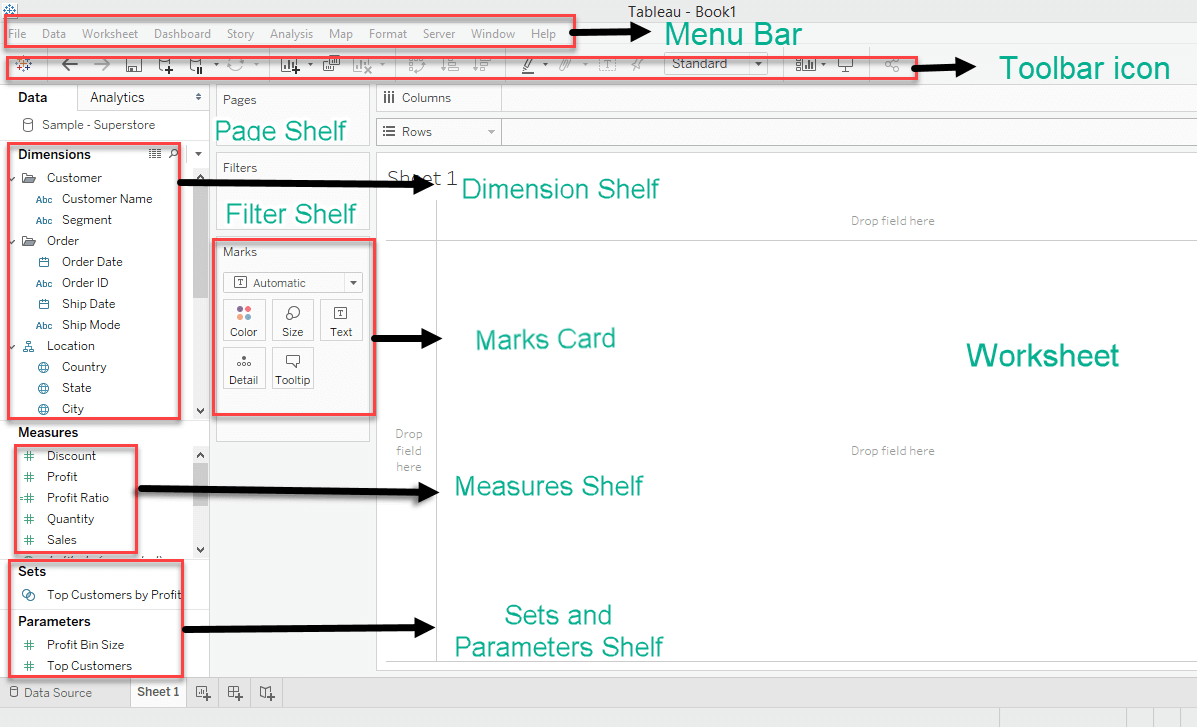
Menu Bar: It consists of menu options like File, Data, Worksheet, Dashboard, Story, Analysis, Map, Format, Server, Window, and Help. The options in the menu bar, including features like data source connection, file saving, design, table calculation options, and file export features for creating a dashboard, worksheet, and storyboard.
Toolbar Icon: Toolbar icon below the menu bar can be used to edit the workbook using different features like redo, undo, new data source, save, slideshow, and so on. Dimension Shelf: The dimension presents in the data source for example- customer (customer name, segment), order (order date, order id, ship date, and ship mode), and location (country, state, and city) these all type of data source can be viewed in the dimension shelf. Measure Shelf: The measures present in the data source, for example- Discount, Profit, Profit ratio, Quantity, and Sales- These all types of data source can be viewed in the measure shelf. Sets and Parameters Shelf: The user-defined sets and parameters can view in the sets and parameters. It is also used to edit the existing sets and parameters. Page Shelf: Page shelf is used to view the visualization in video format by keeping the related filter on the page shelf. Filter Shelf: Filter Shelf is used to filter the graphical view by the help of the measures and dimensions. Masks Cards: Marks card is used to design the visualization. The data components of the visualization like size, color, path, shape, label, and tooltip are used in the visualizations. It can be modified in the marks card. Worksheet: The worksheet is the space where the actual visualization, design, and functionalities are viewed in the workbook. Tableau Repository: Tableau repository is used to store all the files related to the Tableau desktop. It includes various folders like Connectors, Bookmarks, Data sources, Logs, Extensions, Map sources, Shapes, Services, Tab Online Sync Client, and Workbooks. My Tableau repository is located in the file path C:\Users\User\Documents\My Tableau Repository.
Next TopicTableau Navigation
|
 For Videos Join Our Youtube Channel: Join Now
Feedback
- Send your Feedback to [email protected]
Help Others, Please Share


