| |

How to calculate Variance in ExcelWhat is called Variance?Variance is a statistical measurement used to describe the spread or dispersion of a set of data. It measures the average amount by which each data point in the set deviates from the mean (average) of the set. Variance is calculated as the sum of the squad differences between each data point and the mean divided by the number of data points. A larger variance value indicates a greater data spread, while a smaller variance indicates a more compact or tightly clustered data set. Variance is often used in various fields, such as finance, economics, and engineering, among others, to describe and analyze the variability in the data set. Variance in ExcelIn Microsoft Excel, Variance is a statistical measurement that calculates the average amount by which individual numbers in a data set deviate from the mean (average) of the set. It is expressed as a single number and is used to measure the dispersion or spread of the data. Variance can be calculated in Excel using the VAR.S or VAR.P functions. Why calculate Variance in Excel?The benefits of calculating Variance in Excel are listed as follows, Improved Data Analysis- Variance helps understand the dispersion of data, which is important for data analysis. Better decision-making- Variance helps identify outliers and determine if data points differ significantly from the mean, which can inform better decision-making. Ease of Use- Excel provides built-in functions, such as VAR and STDEV that make it easy to calculate Variance for large datasets. Improved Accuracy-Automating the calculation of Variance in Excel reduces the risk of manual calculation errors, leading to improved accuracy. Time-Saving- Calculating Variance in Excel saves time and effort compared to manual calculations, especially for large datasets. Conditions for Variance functionFor the variance function in Excel, the following condition is followed. Data Set: The function requires a set of numeric data, either as a range of cells or as an array. Data Count: The data set must contain at least two values, as the Variance of a single value is undefined. Data Type: The values in the data set must be numeric. Non-numeric values, such as text or blank cells, will result in an error. Calculation Method: There are two methods for calculating Variance in Excel, VAR.S and VAR.P, VAR.S calculates sample variance, and VAR.P calculates population variance. Example of VarianceA simple example of Variance is described as follows, Find the Variance for the given data set 5, 6, 7,8,10. Step 1: The mean value should be calculated to calculate the Variance. Hence, 5+5+7+8+10/5=7. The mean value is 7. Step 2: The difference between each value and mean is calculated, and the square of the difference should be founded. (5-7)^ 2=4 (5-7)^ 2=4 (7-7)^ 2=0 (8-7)^ 2=1 (10-7)^ 2=9 Step 3: The average is calculated for the square value as follows, 4+4+0+1+9/5= 3.6 So the Variance of the set of numbers is 3.6, indicating that the individual numbers deviate an average of 3.6 units from the mean. Zero value indicates no variability. The variance value gives the general idea of the dispersion of the data. How to calculate Variance in Excel?To calculate Variance in Excel, it provides six default functions. The default functions are listed as follows,
Users can choose the desired formula based on several factors, such as,
Excel Variance functionsThe Excel Variance functions are differentiated below, and it is easy to choose the formula based on the requirement.
The VARA and VARPA differ from other variance functions in handling the logical and text values in references. Here is a tabulation regarding the text representation of numbers and logical values.
What is called Sample Variance?The sample variance in Excel is calculated using the formula =VAR.S (range of values). The "VAR.S" function calculates the sample variance of a set of values, which is an estimate of the variability of a population based on a sample. The sample variance is calculated by summing the squared differences between each value in the sample and the mean of the sample, dividing by (n-1), and then taking the square root. How to calculate sample Variance in Excel?As previously mentioned, the variance functions are categorized into the following types, VAR, VAR.S, or VARA for sample variance and VARP, VAR.P or VARPA for population variance Among these functions, VAR and VARP functions are replaced with VAR.S and VAR.P. The VAR, VARP, VAR.S, and VAR.P are used for calculating numerical data. Example 1: Calculate the sample variance for the given data Here the marks of various students are given. The marks combine numbers, text, and logical values such as TRUE, FALSE, 0, and 1. To calculate the Variance for the combination of data, the VARA and VARPA functions are used. The steps to be followed to calculate sample variance are as follows, Step 1: Enter the data in the worksheet, namely A1:C12 Step 2: To calculate the Variance for the data present in the cell range from C1:C15, select a new cell where the user wants to display the result. Step 3: Here cell D1 is selected and enter the formula as =VAR.S (C2:C9) 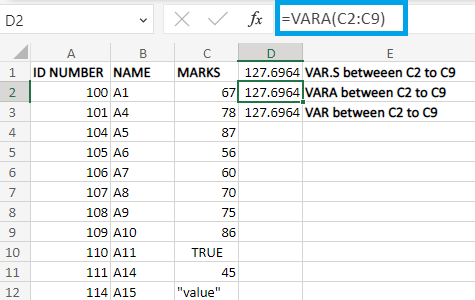
The VAR.S, VARA, and VAR function displays the value in cell D1, D2, and D3. What is called Population Variance?Population variance in Excel refers to a statistical measurement of data spread within a population. It is calculated by taking the average squared difference between each data point and the population's mean. In Excel, the formula to calculate population variance is "VAR.P (array)," where "array" refers to the range of data. How to calculate population Variance in Excel?To calculate population variance, the steps to be followed are, Step 1: Enter the data in the worksheet, namely A1:C12 Step 2: Select a new cell, D3, where the user wants to display the result. Step 3: To calculate population variance, the functions used are VARP, VAR.P, and VARPA. 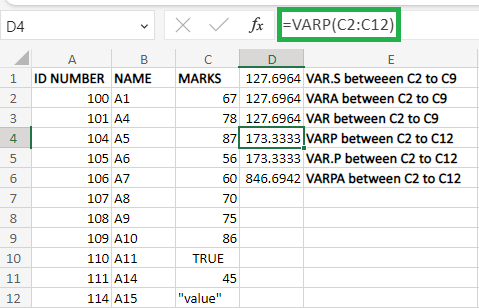
The function called VARP, VAR.P, and VARPA is used to calculate population variance. From the worksheet, the text and logical strings are converted into equivalent numerical values. The text string is converted into 0 or FALSE, and the logical values are converted to numerical equivalent where 0 is FALSE, and one is TRUE. SummaryIn conclusion, Variance is a statistical measure representing the data dispersion from its mean. In Microsoft Excel, you can easily calculate Variance using built-in-functions such as VAR or VAR.S. The VAR.S function calculates the sample variance, while the VAR function calculates the population variance. Both functions take a range of data as input and return the Variance as a result. Understanding and using the Variance can help you make informed decisions based on your data, and Excel makes it easy to calculate. |
 For Videos Join Our Youtube Channel: Join Now
Feedback
- Send your Feedback to [email protected]
Help Others, Please Share


