| |

Brain MappingThe "brain mapping" school of neuroscience is focused on the spatial mapping of biological variables or features onto models of the (human or non-human) brain, resulting in maps. Brain mapping is specifically defined as the study of the anatomy and function of the brain and spinal cord using imaging, immunohistochemistry, molecular & optogenetics, stem cell and cellular biology, engineering, neurophysiology, and nanotechnology, according to the definition provided in 2013 by the Society for Brain Mapping and Therapeutics (SBMT). 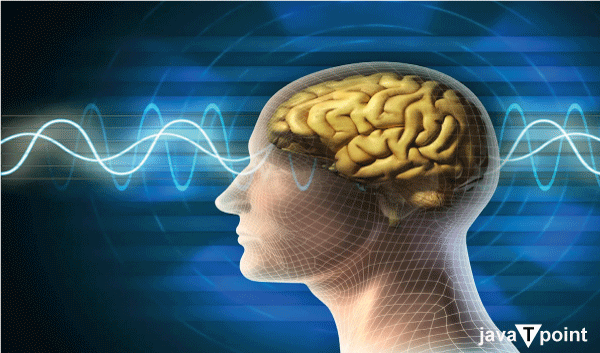
OverviewAll neuroimaging is thought to include brain mapping. Brain mapping is a more sophisticated form of neuroimaging that produces brain images that are enhanced by the outcomes of additional data processing or analysis (related to imaging or unrelated to imaging), such as projections of behaviour onto various brain regions. One sort of such map is a connectogram, which displays cortical regions grouped in a circle according to their lobes. Numerous basic neurological parameters, such as cortical thickness or curvature, are represented by concentric circles inside the ring. The connections between cortical regions are represented by the white matter fibres in the centre of the circles, weighted by fractional anisotropy and degree of linkage. Connectomes are higher-resolution representations of the brain. These maps, which are typically shown as wire diagrams, show particular connections between neurons in the brain. The continual development of brain mapping techniques depends on the design and advancement of image acquisition, representation, processing, visualisation, and interpretation techniques. Functional and structural neuroimaging forms the foundation of the brain mapping component. The identification of "the part of the brain responsible" for emotions like love, musical ability, or a specific memory are only a few of the claims made using brain scans in academic publications and the media that have drawn criticism from certain scientists. Hundreds of thousands of neurons can be found in a single voxel, however the resolution of many mapping methodologies is often constrained. Because many functions also include several brain areas, this type of argument is likely both untestable with the instruments available and frequently based on an incorrect assumption about how brain activities are divided. It's feasible that most brain functions won't be fully understood until they have been measured at a much finer scale that concentrates on numerous tiny individual brain circuits rather than on large regions. Technical problems, such as small sample sizes or incorrect equipment calibration, prohibit many of these research from being repeated. Occasionally, these difficulties are overlooked in lieu of creating exciting journal articles or press headlines. It is not unusual to employ brain mapping methods for commercial benefit, fraud detection, or medical diagnosis when they have not been fully validated. HistoryThe Institute of Medicine of the National Academy of Science in the United States organised a panel in the late 1980s to assess the benefits of combining data from several neuroscientific areas. Using non-invasive scanning techniques like Diffusion Magnetic Resonance Imaging (DMRI), Structural and Functional Magnetic Resonance Imaging (SFMRI), Magnetoencephalography (MEG), Electroencephalography (EEG), Positron Emission Tomography (PET), Near-Infrared Spectroscopy (NIRS), and others, it is particularly interesting to map the anatomy, physiology, perfusion, function, and phenotypes of the human brain. It is possible to map both healthy and ill brains in order to study memory, learning, ageing, and pharmaceutical effects in various groups, such as individuals with schizophrenia, autism, and severe depression. The Human Brain Project was launched as a result. Additionally, it might be crucial for bettering brain injury treatment and understanding severe brain injuries (like Phineas Gage's). The International Consortium for Brain Mapping (ICBM) was established as a consequence of numerous meetings. The long-term objective is to create adaptable computational brain atlases. AchievementsThe interactive digital collection known as The Eyewire Museum visualises data from mouse retinal cells. The interactive citizen science website Eyewire was established in 2012 and maps mouse retinal cells. In 2021, the most comprehensive 3D map of the human brain was published by a U.S. IT corporation. It shows a millionth of a brain's neurons, connections between them, blood vessels, and other structures. By slicing the 1 mm� component into bits that were about 5,000 nanometers thick and scanning them with an electron microscope, the map was produced. The interactive map needs 1.4 petabytes of storage. The first thorough neuron-level-resolution 3D map of the monkey's brain was created about 100 hours after researchers scanned it using a unique scanning method. Even after compression, the entire 3D map still takes up more than 1 petabyte of storage space, so they only made a small section of it available to the general public. The Brain Initiative Cell Census Network (BICCN) concluded the first phase of a long-term project to produce an atlas of the entire mouse (mammalian) brain in October 2021 with 17 investigations, including an atlas and census of cell types in the primary motor cortex. Strengthening the BrainIn 2021, the first connectome that showed how an animal's brain evolved throughout a lifetime was released. The whole brains of eight isogenic C. elegans worms, each at a different stage of development, were mapped by researchers and compared. Later that year, scientists employed electron microscopy and brainbow imaging to show for the first time how a human neural network grows. They provided thorough wiring diagrams for the CNS and muscles of every one of the ten different mice. VisionA functional connectomics dataset that "contains calcium imaging of an estimated 75,000 neurons from primary visual cortex (VISp) and three higher visual areas (VISrl, VISal, and VISlm), that were recorded while a mouse viewed natural movies and parametric stimuli" was released in August 2021 by researchers from the MICrONS programme, which was launched in 2016. They created the MICrONS Explorer with the use of this information, which offers "interactive visualisations of anatomical and functional data that span all 6 layers of mouse primary visual cortex and 3 higher visual areas (LM, AL, RL) within a cubic millimetre volume." The first spatiotemporal cellular atlas of the axolotl brain growth and regeneration, the interactive Axolotl Regenerative Telencephalon Interpretation through Spatiotemporal Transcriptomic Atlas, published significant findings about axolotl brain regeneration in 2022.
Next TopicBrain Neuron
|
 For Videos Join Our Youtube Channel: Join Now
Feedback
- Send your Feedback to [email protected]
Help Others, Please Share


