Difference Between Algorithms and Flowcharts
Introduction:
In the world of computer science and programming, problem-solving lies at the core of every challenge. Whether it's writing a simple program or developing complex software, having a systematic approach is very important. This is where algorithms and flowcharts come into play. Algorithms provide step-by-step instructions, while flowcharts visually represent the logical flow of those instructions. In this article, we will explore the significance of algorithms and flowcharts in problem-solving and discuss how they work together to create an effective solution.
Algorithms are used to describe the logic of a program. They can be written in natural language, pseudocode, or a programming language.
Flowcharts are used to visualize the flow of data through a program. They can be helpful for understanding complex algorithms and for debugging programs.
What is an Algorithm?
An algorithm can be defined as a set of well-defined instructions or rules designed to solve a specific problem. Algorithms can be used to solve a wide variety of problems, including mathematical problems, logical problems, and computational problems.
Algorithms are often written in natural language, but they can also be written in pseudocode or a programming language, providing a precise and logical sequence of operations. Pseudocode is a non-executable language that uses natural language mixed with programming constructs. It is a useful way to write algorithms that can be easily translated into a programming language.
Benefits of Algorithms:
- Structure and Organization: Algorithms bring structure and organization to problem-solving. By breaking down a complex problem into smaller steps, algorithms provide a clear roadmap for finding a solution.
- Reusability: Well-designed algorithms can be reused across multiple projects or scenarios. Once an algorithm is created for a particular problem, it can be applied to similar problems in the future, saving time and effort.
- Efficiency: Algorithms help optimize the problem-solving process. By identifying the most efficient steps and avoiding unnecessary operations, algorithms can greatly improve the performance of a solution.
- Reproducibility: Algorithms ensure reproducibility by providing a standardized set of instructions to solve a problem. Once an algorithm is defined, it can be implemented repeatedly, ensuring consistent and predictable results each time.
- Scalability: Algorithms allow for scalability by accommodating different input sizes and variations. They can handle larger datasets or more complex problems by utilizing efficient algorithms specifically designed for scalability, ensuring that the solution remains effective regardless of the input size.
- Abstraction: Algorithms promote abstraction by separating the problem-solving logic from the implementation details. They focus on the high-level steps and concepts, enabling programmers to develop reusable and modular code that can be applied to different scenarios.
Algorithms:
Sorting algorithms are used to arrange data in a specific order. Some common sorting algorithms include bubble sort, selection sort, and merge sort.
Searching algorithms are used to find a specific value or record in a data set. Some common searching algorithms include linear search, binary search, and hash table search.
Graph algorithms are used to solve problems involving graphs, which are mathematical structures that represent relationships between objects. Some common graph algorithms include Dijkstra's algorithm, Prim's algorithm, and Kruskal's algorithm.
Machine learning algorithms are used to learn from data and make predictions. Some common machine learning algorithms include linear regression, logistic regression, and decision trees.
Natural language processing algorithms are used to process and understand human language. Some common natural language processing algorithms include sentiment analysis, topic modeling, and machine translation.
Examples:
Example 1 - Standard Addition Algorithm
- Line up the numbers vertically along matching place values.
- Add numbers along the shared place value columns.
- Write the sum of each place value below each place value column.
- If the place value column sums over nine, carry the tens digit over to the next column to the left.
- Once all place value columns have been added, the addition is complete and the algorithm terminates.
Here is an example showing this algorithm:
Notice that the numbers are aligned vertically along place values. Then, each place value column is added, and the result is written below the horizontal line.
Example 2 - Standard Subtraction Algorithm
- Line up the numbers vertically along matching place values.
- Subtract the numbers along the shared place value columns.
- Write the difference of each place value below each place value column.
- If the number at the top of a column is smaller than the number below it, regroup before subtracting.
- Once all place value columns have been subtracted, the subtraction is complete and the algorithm terminates.
Here is an example showing this algorithm:
Example 3: Find Roots of a Quadratic Equation ax2 + bx + c = 0
- Start
- Declare variables a, b, c, D, x1, x2, rp and ip;
- Calculate discriminant
- D ← b2-4ac
- If D ≥ 0
- r1 ← (-b+√D)/2a
- r2 ← (-b-√D)/2a
- Display r1 and r2 as roots.
- Else
- Calculate real part and imaginary part
- rp ← -b/2a
- ip ← √(-D)/2a
- Display rp+j(ip) and rp-j(ip) as roots
- Stop
What is a Flowchart?
A flowchart is a graphical representation of an algorithm. It uses different shapes to represent the different steps in the algorithm. The shapes are connected by arrows to show the flow of data through the algorithm.
Flowcharts are a helpful way to visualize the flow of data through a program. They can be used to understand complex algorithms and for debugging programs. It allows programmers and non-programmers alike to understand the solution's structure and logic briefly.
Benefits of Flowcharts:
- Visual Representation: Flowcharts provide a visual representation of the problem-solving process. This visual aid simplifies complex algorithms, making them easier to understand and follow.
- Communication and Collaboration: Flowcharts serve as a communication tool between team members. They enable programmers, designers, and stakeholders to discuss and refine the solution, ensuring everyone is on the same page.
- Error Detection: Flowcharts can help identify errors or bottlenecks in an algorithm. By visually tracing the flow of control and data, potential issues can be spotted and rectified before implementation.
- Decision Making: Flowcharts incorporate decision points and conditional statements, making it easier to understand the logic behind different decision-making paths. They visually represent the possible outcomes and help in evaluating the consequences of different choices, aiding in effective decision-making.
- Error Detection: Flowcharts help identify errors or potential issues in the problem-solving process. By providing a visual representation of the steps and decision points, programmers can visually trace the flow and identify areas where errors may occur, making it easier to debug and correct the code.
- Documentation: Flowcharts serve as a documentation tool, providing a visual record of the problem-solving process. They capture the steps, conditions, and decisions made during the development process, making it easier to understand and maintain the codebase in the future.
- Analysis and Optimization: Flowcharts facilitate the analysis and optimization of the solution. They allow programmers to evaluate the flow and logic of the process, identifying bottlenecks, redundancies, or inefficiencies. This enables them to optimize the solution by making informed decisions and improving overall performance.
- Learning Aid: Flowcharts are effective educational tools, especially for beginners learning programming concepts. They provide a visual and step-by-step representation of the problem-solving process, aiding in understanding the logic and improving comprehension of programming constructs.
The Synergy of Algorithms and Flowcharts:
Algorithms and flowcharts are not mutually exclusive; rather, they complement each other in the problem-solving process. Together, they offer a powerful duo for efficient and effective solutions.
- Design Phase: Algorithms are initially designed as a series of logical steps. However, translating these steps into a visual representation through flowcharts helps in refining the algorithm's structure and identifying potential improvements.
- Documentation and Communication: Flowcharts serve as excellent documentation for algorithms. They provide a high-level overview of the problem-solving process, making it easier for others to understand and collaborate on the solution.
- Implementation and Debugging: When it comes to implementing an algorithm in a programming language, flowcharts act as a guide. They help programmers visualize the code structure and control flow, making it easier to write, debug, and optimize the program.
Differences Between Algorithms and Flowcharts
There are a few key differences between algorithms and flowcharts:
- Algorithms are written in text, while flowcharts are graphical. This makes algorithms easier to read and understand for humans, but flowcharts are easier to understand for computers.
- Algorithms are more detailed than flowcharts. Algorithms specify the exact steps that need to be taken, while flowcharts only show the general flow of the program.
- Algorithms are more abstract than flowcharts. Algorithms do not specify the specific programming language that should be used, while flowcharts are tied to a particular programming language.
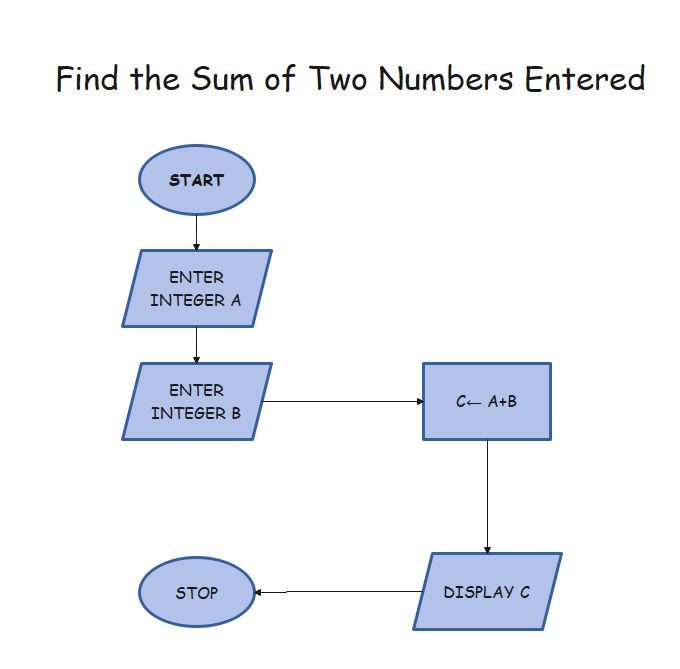
Example 1: Find the Sum of Two Numbers Entered
Algorithm:
Step 1: Read the Integer A.
Step 2: Read Integer B.
Step 3: Perform the addition by using the formula: C= A + B.
Step 4: Print the Integer C.
Flowchart:
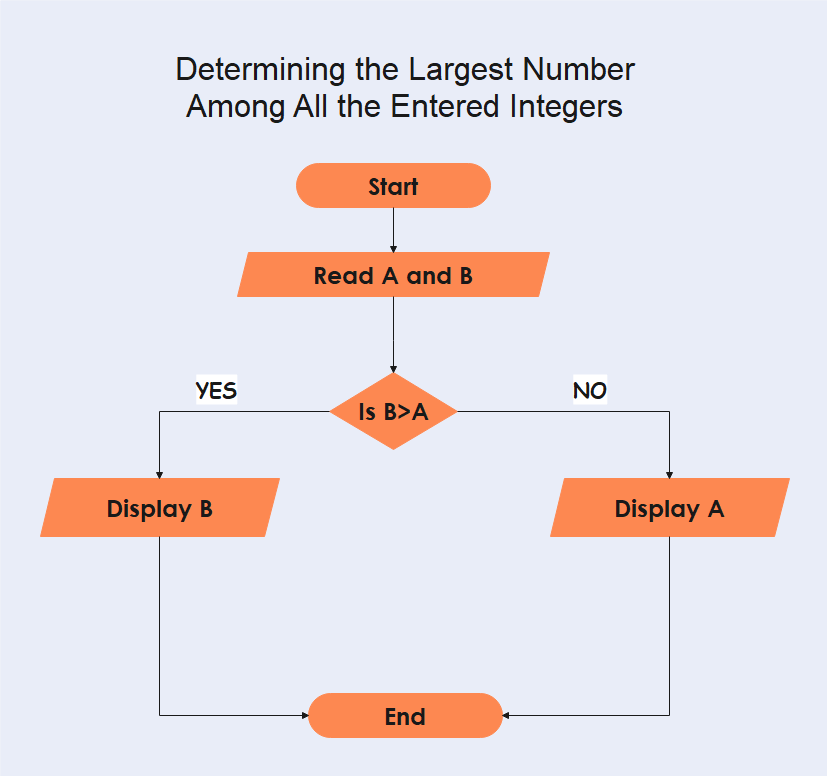
Example 2: Determining the Largest Number Among All the Entered Integers
Algorithm:
Step 1: Read the Integer A.
Step 2: Read Integer B.
Step 3: If B is greater than A, then print B, else A.
Flowchart:
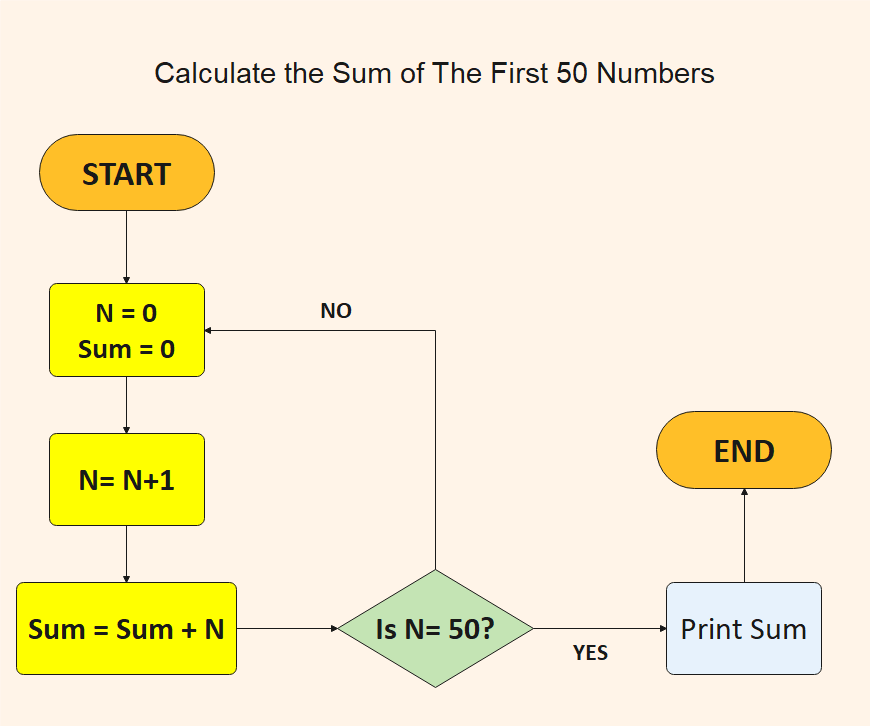
Example 3: Calculate the Sum of The First 50 Numbers
Algorithm:
Step 1: Declare number N= 0 and sum= 0
Step 2: Determine N by N= N+1
Step 3: Calculate the sum by the formula: Sum= N + Sum.
Step 4: Add a loop between steps 2 and 3 until N= 50.
Step 5: Print Sum.
Flowchart:
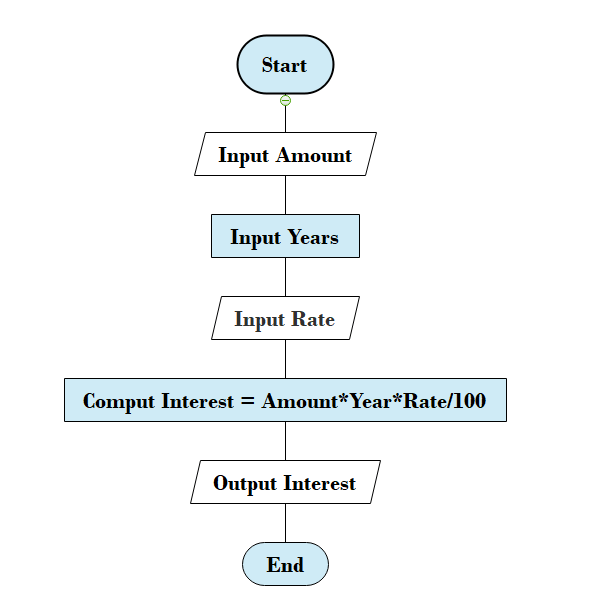
Example 4: Calculate the Interest of a Bank Deposit
Algorithm:
Step 1: Read amount.
Step 2: Read years.
Step 3: Read rate.
Step 4: Calculate the interest with the formula "Interest=Amount*Years*Rate/100.
Step 5: Print interest.
Flowchart:
Conclusion:
Algorithms and flowcharts are complementary tools. Algorithms are often used to create flowcharts, and flowcharts can be used to document algorithms. Both tools are important for the development of complex computer programs.
- They can help to solve complex problems by breaking them down into smaller, more manageable steps.
- They can help to improve the readability and understandability of computer programs.
- They can help to improve the debugging process by making it easier to identify and fix errors in programs.
- They can be used to communicate the design of a program to other programmers.
|

 For Videos Join Our Youtube Channel: Join Now


