| |

52-Week High/Low: Definition, Role in Trading, and ExampleAn important feature of the financial markets is the 52-week high/low concept, which offers insightful information on stock price changes and investor mood. It speaks of the highest and lowest prices a stock has ever traded at over 52 weeks, usually calculated from the most recent date. For traders, investors, and technical analysts, this indicator is especially crucial because it provides a snapshot of a stock's performance and aids in the detection of prospective trends. The stock price, as perceived by the market as a whole, is often averaged by the 52-week high/low. Reaching a company's 52-week high signifies a bullish market and shows that the stock has been performing well lately. Reaching the 52-week low, on the other hand, denotes unfavourable sentiment, with the stock trading at its lowest level in the previous year. The definition and calculation of the 52-week high/low, its use in trading methods, an example to demonstrate its use, and its limitations and considerations are all covered in more detail in the article below. Understanding the 52-Week High/LowAs already stated, the 52-week high/low refers to the highest and lowest prices at which a stock has traded for 52 weeks. It provides a reference point for assessing a stock's recent performance and volatility. The high represents the peak price the stock has reached during the past year, while the low represents the lowest price it has touched over the same period. Some traders and investors employ a 52-week high/low technical indicator because they believe that these numbers play a significant role in determining a stock's current worth and future price movement. As a stock's price approaches the mid of the high or low end of its 52-week price range (the range between the 52-week low and the 52-week high), an investor can become more interested in it. Based on the security's daily closing price, the 52-week high and low are calculated. A stock may break a 52-week high during the trading day, but it won't be noticed if it closes below the prior 52-week high. The same rules apply when a stock establishes a new 52-week low during a trading session but doesn't close at a new 52-week low. Simply put, what matters in consideration are the closing prices. The 52-week high/low ratio can be used, among other things, to help investors plan when to buy or sell a stock of a particular company. For instance, stock traders might purchase a stock if its price is higher than its 52-week high or sell it if it is lower than its 52-week low. This method is justified by the idea that if a price moves above or below its 52-week range, some underlying cause must give rise to sufficient momentum for the price movement to continue in that direction. When employing this method, a trader may use stop-orders to open new positions or increase the size of current ones. A specific stock's trading volume frequently increases once it surpasses a 52-week threshold. Studies have shown this. In a study conducted by researchers from Pennsylvania State University, the University of North Carolina, and the University of California, it was found that small stocks crossing their 52-week highs resulted in excess gains of around 0.6275% the following week. The study was named "Volume and Price Patterns Around a Stock's 52-Week Highs and Lows: Theory and Evidence" and was conducted in 2008. Likewise, the following week saw gains of around 0.1795% in major stocks. However, the impact of 52-week highs (and lows) was greater on small stocks than on high/major stocks. Calculation of 52-Week High/LowThe highest and lowest prices at which a stock has traded in the past 52 weeks are used to calculate the 52-week high/low. An explanation of how to determine the 52-week high and low is provided below:
The 52-week high/low is a dynamic indicator that must be updated frequently as new price information becomes available; it is crucial. To stay informed about a stock's most recent price moves and gauge its relative strength or weakness compared to earlier levels, traders and investors frequently analyze the 52-week high/low based on the most recent data. Significance of 52-Week High/LowThe significance of the 52-week high/low is found in its capacity to offer insightful information about the performance of the stock recently, impacting the investors' decision. It is a benchmark for evaluating a stock's strength, volatility, and potential support and resistance levels. The 52-week high shows recent strength and positive market sentiment, whereas the 52-week low denotes difficulties or unfavourable sentiment. Traders and investors use these levels to spot breakout and breakdown possibilities, choose entry and exit positions, and assess the general trend of a stock. The 52-week high/low is a crucial instrument in technical analysis and aids traders in making well-informed choices. 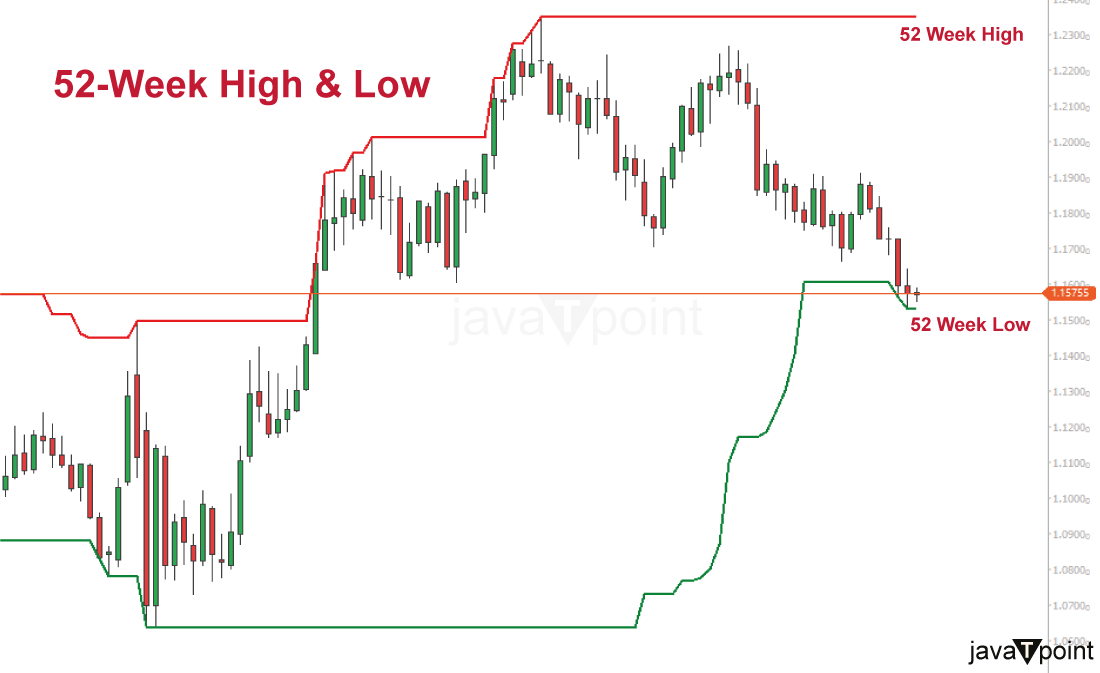
Factors that can Influence a Stock's 52-Week High/LowA stock's 52-week high and low stats are affected by a number of variables or elements, depending on the price movement and investor sentiment. Understanding these elements might help investors better understand why a stock might experience new highs or lows. The following significant variables can affect a stock's 52-week high or low:
Reversals of 52-Week High/LowA stock may have peaked if it makes a 52-week high intraday but closes down the same day. This implies that its price might not increase significantly in the foreseeable future. A daily shooting star, which happens when an asset trades much higher than its opening and then descends later in the same day to close either below or close to its opening price, can be used to determine this. Professionals and institutions frequently use 52-week highs to create take-profit orders to lock in gains. To reduce their losses, they may also use 52-week lows to establish stop-loss levels. A 52-week high denotes market bullishness because stock markets have a natural upward tilt. Typically, many investors are willing to forgo additional price growth to lock in part of, if not all, of their gains. Stocks setting new 52-week highs are frequently most vulnerable to profit-taking, which can cause pullbacks and trend reversals anytime. Similarly, a stock may be nearing a bottom if it reaches a new 52-week low throughout the day but fails to do so at the close. A daily hammer candlestick, which appears when a security trades slightly below its starting price and then rallies later in the day to close either above or close to its opening price, can be used to determine this. This may inspire bargain hunters and short-sellers to begin buying to cover their positions. Stocks that have the most potential for a significant bounce during the daily hammer form include those that have typically hit five consecutive 52-week lows. Example of 52-Week High/LowLet's consider an example to understand the concept of a 52-week high/low. Suppose Company XYZ's stock is currently trading at $50 per share. During the past year, the stock has closed at a high of $60 and a low of $40 on any given day. In this case, $60 would be the stock's 52-week high, indicating that the share price reached $60 at some point in the previous year. On the other side, $40 would be the 52-week low, meaning that the stock's lowest point was attained at that price within that same time period. Notably, $60 is considered a resistance level, while $40 is considered a support level. Investors and traders keep a close eye on these levels. Indicating potential resistance, the stock price approaching its 52-week high may prompt some investors to sell their holdings. On the other hand, a stock may draw investors seeking a potential price increase when it is getting close to its 52-week low. In such a case, traders are most likely to place purchase orders. The example shows how the 52-week high/low serves as a point of comparison for comprehending a stock's recent price range and can be a helpful signal for trading and investment decision-making. The Bottom LineIn trading and investing, the 52-week high/low is a useful indicator that offers perceptions of a stock's recent performance and investor sentiment. It acts as a benchmark for evaluating a stock's strength, pinpointing possible regions of support and resistance, and seizing breakout and breakdown possibilities. It's crucial to understand the drawbacks of depending entirely on the 52-week high/low, though. This is because none of such indicators are based on proven mechanisms or calculated data. It is important to take into account other factors like historical context, the short-term nature, market fluctuations, and the necessity for extra investigation. The 52-week high/low, coupled with other indicators and fundamental research, can help traders and investors make better decisions and better understand how a stock's price will move in the future. |
 For Videos Join Our Youtube Channel: Join Now
Feedback
- Send your Feedback to [email protected]
Help Others, Please Share


