| |

Three Black Crows Definition and How to Use the PatternA bearish candlestick pattern known as "three black crows" may signify the end of an upsurge. Candlestick graphs show the opening, high, low, and closing prices for security during the day. Candlesticks are usually white or green for rising stocks, and they are either black or crimson when they are descending. 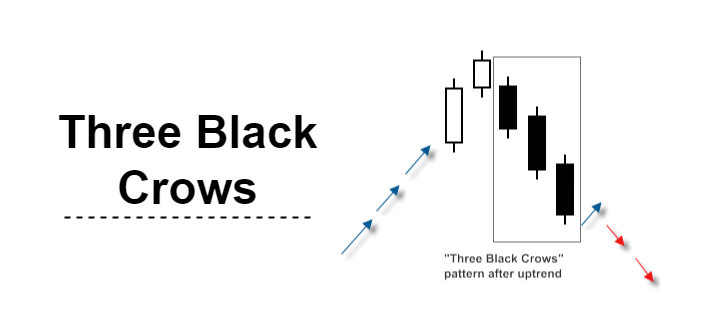
The black crow pattern is typically made up of three consecutive long-bodied candlesticks that are opened within the body of the preceding candle and closed lower than the previous candle. This signal is frequently combined with other technical tools or chart patterns by traders to confirm reversals. There is no specific mathematics or approaches to worry about when spotting three black crows because they form a visual pattern for certain data sets automatically. The three black crows pattern is formed when bears surpass bulls throughout three successive trading sessions. On the price charts, the pattern shows three bearish long-bodied candlesticks with either short or no wicks or shadows. In a classic appearance of three black crows, the bulls will start the session with the price opening somewhat higher than the previous close. However, the price is pushed lower throughout the next sessions. Finally, the price will ultimately close at the session low due to bearish pressure. This trading activity will have very little to no impact on the market. The beginning of a negative decline is often considered to understand how traders perceive this downward pressure that has been building up for three sessions. An Example: How to use Three Black Crows?The best method to use the visual pattern of three black crows is as a prompt to seek confirmation from additional technical signs. How well-formed the three black crows pattern appears has a significant impact on how much confidence a trader may have in it. Idealized bearish candlesticks with reasonably long bodies that close at or close to the low price for the period should form the three black crows. In other words, the candlesticks should have long, natural bodies and little to no shadows. If the clouds are lengthening, it can be a short shift in bullish and bearish momentum before the uptrend resumes. Volume can also enhance the design of the three black crows. The three-day black crow pattern usually has a very high volume during the sessions compared to the uptrend that precedes it, which has a comparatively low volume. In this case, it means that a smaller number of bulls started an uptrend, later broken up by a higher number of bears. 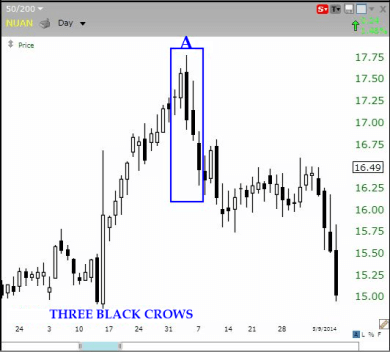
Naturally, given how markets operate, this might also result in many small bullish traders colliding with a smaller number of high-volume negative trades. The amount each market participant brings to the table is more important than the actual number of players. Three White Soldiers vs Three Black CrowsThe three white soldiers' pattern is the opposite of the three black crows pattern. It appears toward the end of a bearish slide and predicts a likely turnaround higher. This design resembles three white candlesticks with long bodies with minimal or no shadows. The previous candlestick's natural body is where the open occurs, and its close is where the open occurred earlier. Three black crows represent the reversal of an uptrend, while three white soldiers represent the reverse of a downtrend. Both patterns' volume and confirmation from other indicators are subject to the same cautions. Utilizing Three Black Crows: It has certain limitationsIf the three black crows' pattern includes less significant activity, traders should be wary of oversold conditions that could lead to consolidation before a downward slide. Technical indicators, such as the relative strength index (RSI), which indicates oversold circumstances when it reads below 30.0, or the stochastic oscillator indicator, which displays movement momentum, is the best approach to determine whether a stock or other asset is oversold. Nowadays, many traders look at other chart patterns or technical indicators in addition to the three black crows' patterns to identify a breakdown. Depending on variables like how fleeting a shadow should be, it might be read as a visual pattern in a variety of ways. Additional indications will also mirror an actual three-black crow pattern. A breakdown from critical support levels, like in the case of a three-black crows' pattern, may independently signal the start of an intermediate-term decline. The likelihood of a profitable trade or exit plan increases with the use of different patterns and specific indicators. Example of Three Black Crows in the Real WorldIn the third week of May 2018, a three-black crows pattern appeared on the GBP/USD weekly price chart, which was unfavourable for the currency pair. Analysts hypothesized that the three black crows' pattern meant the pairing would keep trending downward. The three black crows' pattern was shown to indicate a continued slump based on an analysis of three factors, such as:
Trading Methods for Three Black CrowsWe wanted to demonstrate how you can start creating your own trading strategies. Now, we hope that you are familiar with some practical techniques for working with the Three Black Crows. Let us discuss trading methods for the Three Black Crows. Remember that the following strategies are illustrated as samples and should not be used for real-time trading without considering other factors. However, if we were requested to develop a business plan with three black crows, we would undoubtedly consider or even try one of the methods listed below: Trading Strategy 1: Three Black Crows with Range ConditionsOne of the common trading strategies of three black crows is employing range conditions to enhance the three black crow patterns. With this approach, we only need to look at a few pretty broad instances, so we may modify the requirements to fit the pattern's anatomy. In this strategy example, we'll try to achieve just that. More specifically, each of the three subsequent candles must have a wider range than the candle before it. This guarantees that the market moves more quickly in its just-discovered direction, perhaps as more people begin to understand that they should sell their positions. The guidelines for going short therefore become: We have a pattern of three black crows. Each candle in the pattern forms a wider range than the one before it. Then, after five bars, we leave. Trading Strategy 2: Overbought Filter and Three Black CrowsThe mean-reverting characteristics of equities, such as stocks, are seen in the second strategy example. To put it simply, mean reversion is the tendency of a market to move back once it has moved too far in one direction. Now, suppose we want to make sure that the market has risen significantly to the upside before we enter a transaction when trading the three black crows. In such a case, the RSI (Relative Strength Index) could be used to define this. One of our favourite indicators is the RSI, which indicates overbought conditions when it rises above 70. So, in our trading strategy, we may use that condition as an additional factor. We can cut it short if:
Next TopicTwo-Sided Market Defined
|
 For Videos Join Our Youtube Channel: Join Now
Feedback
- Send your Feedback to [email protected]
Help Others, Please Share


