| |

Empirical Rule: Definition, Formula, Example, How It's UsedThe empirical rule is also known as the normal three-sigma or 68-95-99.7 rule. This rule is usually applied on a bell-shaped curve or bell-shaped distribution that helps statisticians determine the outcomes even though not all the data is available. To understand the application of this rule, we must first understand the bell-shaped curve. In the bell-shaped curve, the mean of the data comes in the centre of the curve, and on both sides of the curve, the data are equally distributed. 
Understanding Empirical RuleAccording to this rule, 68% of the observed data falls within the first standard deviation (both left side and right side) of the mean, 95% of the observed data falls within the two standards (both right side and left side) deviation of the mean, and 99.7% of the observed data falls within the three standards (both right side and left side) deviation of the mean. This is why the empirical rule is also known as the 68-95-99.7 rule. 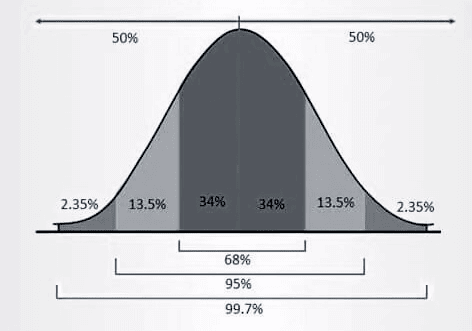
The use of the empirical formula is to forecast final outcomes in statistics. The term "empirical" itself states that "based on observation or experience rather than theory". Using the empirical rule, the outcome of the data about to be collected is roughly estimated, and analysis of the data is done but only after the standard deviation is calculated and before the collection of exact data. The normality of the distribution can also be tested by using the empirical rule. As the empirical rule requires that all data be only within three deviations, not outside; therefore, if a large number of data falls outside the limits of three deviations, it is said that the data is not normally distributed. In such a case, it is termed skewed and usually follows some other type of distribution. The reason behind calling the empirical rule a "three sigma rule" is that the data is distributed statistically within the three standard deviations of the mean on a bell-shaped curve. The Formula of Empirical RuleThe formula of the empirical rule is used to calculate the data ranges associated with the empirical rule percentages of 68%, 95%, and 99.7%. Therefore, we must first calculate the sample mean (µ) and standard deviation (σ) and then put the respective values in the empirical rule formula below: = µ ± mσ We use the formula for all three standard deviations, i.e., the first standard deviation, the second standard deviation and the third standard deviation. So, we change the value of the multiplier (m) accordingly. The formula for different specified data ranges can be defined as below: = µ + σ to µ - σ (when the percentage of data in the range = 68%) = µ - 2σ to µ + 2σ (when percentage of data in the range = 95%) = µ - 3σ to µ + 3σ (when percentage of data in the range = 99.7%) Example of the Empirical RuleLet us assume that you have been asked to normally distribute the population of the animals of a particular Jungle. It is given that the average (mean) lifespan of each animal is 13.1 years and 1.5 years is the standard deviation of the lifespan of the Jungle animals. The empirical rule can be used to find out if any animal will live longer than 14.6 years or not. It is given that 13.1 years is the mean of the age of the animals which means that µ = 13.1 and the standard deviation, i.e. σ is 1.5. These values can be put up in the formula to calculate the age range for each standard deviation. The range for the first standard deviation: 11.6 to 14.6 µ - σ = 13.1-1.5 = 11.6 µ + σ = 13.1 + 1.5 = 14.6 The range for the second standard deviation: 10.1 to 16.1 µ - 2σ = 13.1- 2 x 1.5 = 10.1 µ + 2σ = 13.1 + 2 x 1.5 = 16.1 The range for the third standard deviation: 8.6 to 17.6 µ - 3σ = 13.1- 3 x 1.5 = 8.6 µ + 3σ = 13.1 + 3 x 1.5 = 17.6 In this case, to make the final calculation, you need to analyze the probability of the animals that may live 14.6 years or more. As to the empirical rule, 68% of the observed data falls within the first standard deviation, which in this case is 11.6 to 14.6. Therefore, the remaining 32% of the data falls outside the first deviation. It means that one-half lies above 14.6 and the other half below 11.6. Thus, 16% (calculated as 32% divided by two) is the probability that animals in the forest live 14.6 years or more. Calculation of the Standard DeviationTo forecast the outcomes of a data set, it is important to calculate the standard deviation first. The formula for the calculation of standard deviation is given below. 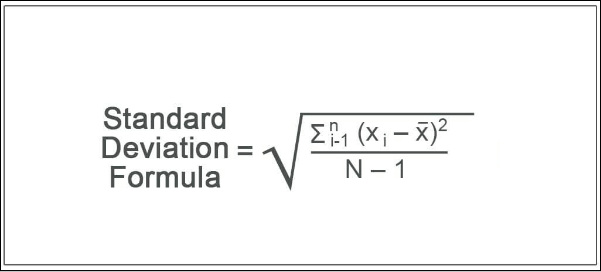
Where xi represents the value of each data point, x? represents the mean, and N represents the number of data points. We can easily break down the above formula to solve and calculate the standard deviation. Following are the steps to calculate and break down the formula.
Use of Empirical RuleThe statistician uses the empirical rule to forecast the data, especially when the data set is vast, and the variables of the data are unknown. It is used in the finance sector, especially in stock prices, to log the value of forex rates and price indices. The data represented through a graph typically makes a bell-shaped curve, and the data are distributed normally. Limitations of the Empirical Rule
Next TopicThree White Soldiers Definition
|
 For Videos Join Our Youtube Channel: Join Now
Feedback
- Send your Feedback to [email protected]
Help Others, Please Share


