| |

Accumulation/Distribution Indicator (A/D): Overview & What It Tells YouThe Accumulation/Distribution Indicator (A/D) is a popular technical analysis tool that traders and investors use to determine a security's buying and selling pressure. The A/D indicator is a volume-based indicator that measures the flow of money into or out of a stock over a period of time. It is based on the principle that if a security is being accumulated, its price will increase, and if it is being distributed, its price will decrease. 
The A/D indicator takes into account both the volume and price data of a security to determine whether it is being accumulated or distributed. It is calculated by adding the daily volume multiplied by the security's close location value (CLV), which is then accumulated or distributed over time to generate a cumulative A/D line. The A/D line can be used to identify potential trend reversals, confirm price movements, and determine the strength of buying and selling pressure in a particular security. The Formula for Accumulation/Distribution IndicatorMarc Chaikin developed the A/D indicator in the 1980s. The indicator is based on the theory that a security's volume provides insights into that security's buying and selling pressure. The A/D indicator uses the volume and price of a security to determine the net flow of money in and out of the security. The following formula is used for the A/D indicator: A/D = Previous A/D + Current Period MFV (Money Flow Volume) MFV = Money Flow Multiplier (MFM) x Volume for the Period MFM = [(Close - Low) - (High - Close)] / (High - Low) Where:
The A/D indicator is plotted on a chart as a line. When the line rises, it indicates that there is more buying pressure than selling pressure in the respective security. When the line falls, it indicates more selling pressure than buying pressure in the corresponding security. On charts with any time range, from intraday to weekly, the A/D indicator can be applied. 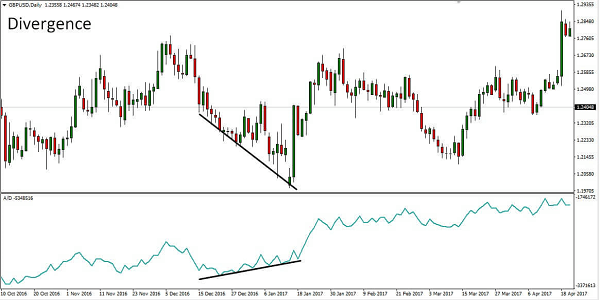
What are the crucial insights provided by the accumulation/distribution indicator?The A/D indicator provides insights into a security's buying and selling pressure. Traders and investors can determine the degree of strength or weakness of a security's trend by examining the A/D indicator. Here are some of the key insights that can be gained from the A/D indicator:
One of the main uses of the A/D indicator is to confirm the direction of a security's trend. When the A/D line is rising, it confirms an uptrend; when the A/D line is falling, it confirms a downtrend. If the A/D line is moving in the opposite direction of the price of the security, it could indicate a potential reversal in the trend.
When the A/D line and the security's price are going in opposing directions, it indicates a divergence. For instance, if a security's price is rising but the A/D line is declining, this may be a sign that buying pressure is waning and the market may be about to change. On the other hand, if the price of a security is falling, but the A/D line is rising, it could indicate that the selling pressure is weakening, and a reversal in the trend may occur.
The strength of the price movement of an asset can also be confirmed by the A/D indicator. If the A/D line is rising along with the price of the security, it confirms that the price movement is supported by increasing buying pressure. Conversely, if the A/D line is falling along with the price of the security, it confirms that the price movement is supported by increasing selling pressure.
You can utilize the A/D indicator to locate probable levels of support and resistance. When the A/D line approaches a previous high or low, it could indicate that the security is reaching a potential resistance or support level. If the A/D line breaks through these levels, it could indicate a continuation of the trend.
The A/D indicator can also be used to identify periods of distribution and accumulation in security. Distribution happens when a security is under greater selling pressure than buying pressure, and accumulation happens when there is more presence of buying pressure than selling pressure. By analyzing the A/D line, traders and investors can identify periods of distribution and accumulation and use this information to make trading decisions. Limitations of the Accumulation/Distribution IndicatorWhile the A/D indicator can provide valuable insights into a security's buying and selling pressure, it is not without limitations. Here are some of the limitations of the A/D indicator:
The A/D indicator relies on volume data to determine the flow of money in and out of a security. However, volume data can be inconsistent, particularly in thinly traded securities. Inconsistencies in volume data can lead to inaccurate readings of the A/D indicator.
As a lagging indicator, the A/D indicator is purely dependent on historical price and statistics. As a result, it may not provide timely signals for traders and investors.
The A/D indicator is based on the assumption that the volume of security provides insights into the buying and selling pressure of that security. However, market manipulation can skew volume data, leading to inaccurate readings of the A/D indicator. Assume, for instance, that a sizable institutional investor purchases a sizeable portion of the shares of a certain security. In that case, it may cause the A/D indicator to suggest that there is a significant increase in buying pressure. However, this may not reflect the market's overall sentiment, and the price may not move accordingly.
The A/D indicator is primarily used for short-term trading and may not be suitable for long-term investment decisions. However, it might not work well under some market circumstances, such as times of low returns or significant uncertainty.
The A/D indicator relies heavily on volume data, which can sometimes be unreliable. For example, a sudden spike in volume due to a news event may skew the A/D indicator and provide false signals. Additionally, volume data may be inaccurate or incomplete, which can lead to erroneous conclusions.
The A/D indicator is a short-term technical analysis tool that may not provide accurate signals over a more extended period. The A/D indicator should be used in addition to different technical analysis tools by traders and investors to obtain a more complete understanding of the market.
The A/D indicator is just one tool in a trader or investor's toolbox. An over-dependence on technical analysis might result in bad trading decisions and inaccurate conclusions. It is crucial to take fundamental analysis, market mood, and other aspects like market sentiments into account while making trading decisions. 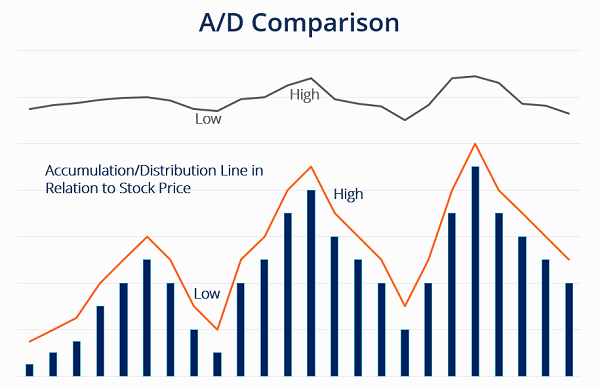
What does the A/D indicator tell us?
A/D indicator helps traders to identify the buying and selling pressure in the market. If the A/D line is trending upward, it indicates more buying pressure than selling pressure; if it is trending downward, it indicates more selling pressure than buying pressure.
A/D indicator can help traders confirm the trend of a security. If the A/D line is trending upward along with the price, it indicates that the trend is bullish; if it is trending downward along with the price, it indicates that the trend is bearish.
Traders can use the A/D indicator to spot probable overbought and oversold positions of a particular share. If the A/D line is trending upward, but the security is overbought, it indicates that the security may be due for a correction, and if the A/D line is trending downward, but the security is oversold, it indicates that the security may be due for a rally. The Bottom LineThe Accumulation/Distribution Indicator is a popular technical analysis tool traders and investors use to determine the buying and selling pressure in security. The A/D indicator is based on the theory that the volume of security provides insights into the buying and selling pressure of that particular security. The A/D indicator provides valuable insights into the strength or weakness of a security's trend, confirmation of trends, divergences, volume confirmation, support and resistance, and distributions and accumulations. However, the A/D indicator has limitations, including volume inconsistencies, lagging indicators, market manipulation, and limited application. |
 For Videos Join Our Youtube Channel: Join Now
Feedback
- Send your Feedback to [email protected]
Help Others, Please Share


