| |

Indifference Curves in Economics: What Do They Explain?What exactly is an Indifference Curve?An indifference curve is a graph that shows the possible pairing or relation of two goods or commodities that leave the consumer equally well off or satisfied-hence indifferent-whenever any pairing of the two things is represented along the curve. 
Let's say, for instance, that someone loves both samosas and jalebis. Then, it may be indifferent if one bought 20 samosas and no jalebis, 45 jalebis and no samosas, or some combination of the two, like 14 samosas and 20 jalebis. Each combination has value in its own right. In-depth understanding of Indifference CurvesFormal indifference curve analysis utilizes a simple two-dimensional graphic. Alternative types of economic goods are represented on each axis. The customer is indifferent between any of the product combinations represented by the points on an indifference curve because any combination of commodities on the curve offers the same level of value to the customer. A young child, for instance, might not care if he or she had four toy trucks and one comic book or two comic books and one toy truck. As a result, both of these pairings would represent points on the young child's indifference curve. Indifference curves are heuristic tools used in contemporary microeconomics to emphasize consumer choices and financial limitations. The concepts of indifference curves have been embraced by economists studying welfare economics. Analysis of the Indifference CurveIndifference curves are predicated on a number of presumptions. There is never any overlap between any two indifference curves, which are all typically convex to the origin. On indifference curves further from the origin, bundles of goods are always seen or recognized as making consumers happy. 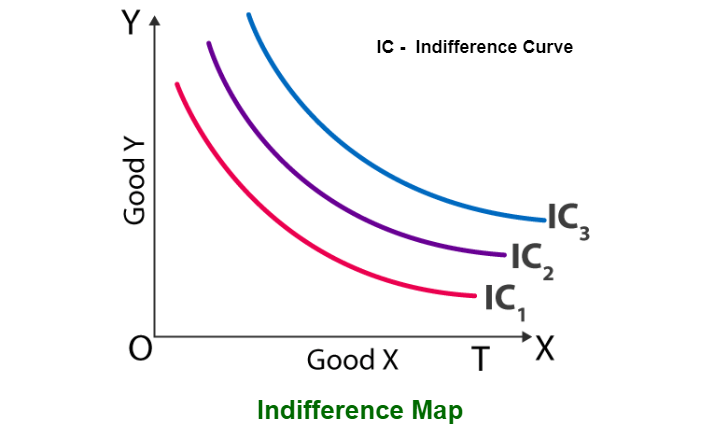
Since consumers may buy more things when their income increases, people's consumption levels frequently change accordingly. To summarize a result, consumptions are usually represented on an indifference curve that is farther from the origin and so better off. Critical microeconomic concepts that emerge from indifference curve analysis include individual choice, marginal utility theory, income, substitution effects, and the subjective theory of value. The indifference curve analysis emphasizes the marginal rates of substitution (MRS) and opportunity costs. The majority of the time, indifference curve analysis assumes that all other variables are fixed or stable. The majority of economic textbooks employ indifference curves to show the optimal selection of goods for each consumer, depending on income. The traditional analysis states that the optimal consumption bundle is typically seen at the point where a consumer's indifference curve is tangent to their budget constraint. The Indifference Curve's Critics and ComplicationsIndifference curves have been criticized for being overly simplistic or for making unrealistic assumptions about human behaviour. It shows that the indifference curve generally reacts in the same way as many other areas of contemporary economics. Customers' preferences, for instance, may change between two points in time, making accurate indifference curves pointless. Other critics point out that technically speaking, concave indifference or even circular curves that are convex or concave to the origin at particular spots in respect to origin are possible. What is the purpose of an indifference curve?The concessions people make when presented with two things they desire to acquire are described by economists using an indifference curve. Because they have a limited budget, people can only afford to buy a certain number of products. In such a case, an examination of costs and benefits is needed. Indifference curves depict this trade-off by producing a relational graph, showing which quantities of the goods considered provide the same amount of value to the consumer (i.e., where they remain indifferent). What properties do indifference curves have?The premise underlying indifference curves is that people have stable, ordered preferences and want to maximize utility over time. Thus, indifference curves will exhibit the following four properties:
Essential ApplicationsAccording to consumer theory, indifference curves and financial constraints produce consumer demand curves. For a single consumer, this is an operation that is rather simple. The first step is to think of one thing, like carrots, as an example for the market, and the second as a composite of all other goods. Budget restrictions may lead to a straight line on the indifference map that depicts all possible distributions of the two objects; the point of greatest utility is, therefore, the point at which an indifference curve is parallel to the budget line. It goes with a saying that a household will sell an item if the market values it higher; if the market values a good lower, the household will buy it. After that, the process is repeated until both the market and the household's marginal rates of substitution are equal. Let's say all other products have constant prices, but carrots' price rises. The budget line's gradient then shifts, creating a new point of tangency and a different amount asked. It is possible to calculate the entire demand curve using these price/quantity combinations. A line connecting each point of tangency between the budget limitation and the indifference curve is known as the expansion path. ExamplesJack owns one unit of clothing and eight units of books. He chooses to trade in four book units for a further item of clothing. The following scenarios are possible: One unit of clothing and eight units of books are good enough for Jack. Furthermore, he is content with 2 units of cloth and 4 units of books. In conclusion, Jack, as a consumer, is equally satisfied and useful in both circumstances. Depending on his preference, he can use any of the following combinations:
If a graphical representation of this study is drawn on an indifference curve, the X-axis will represent one good (Cloth), and the Y-axis will represent another good (Book). However, Jack will experience the same level of satisfaction from combinations of any two commodities on the curve. Substitutes and ComplementsTo track the state of the economy, economists use a variety of indicators of goods and services. One of the main ways economists gauge economic output is by keeping tabs on the trade of commodities and services. The categorization of different good kinds in microeconomics enables economists and businesses to observe developments on a smaller scale. The change in customer demand for comparable items is tracked using substitute and complement goods. In economics, substitute and complementary goods are by-products that are connected to primary commodities on a secondary level. While substitute commodities serve the same purpose as other goods, they are frequently preferred for a variety of reasons. The cross-price elasticity of demand for substitute items remains positive. A good example of a substitute is when people start buying chicken instead of beef when prices rise. Also, if the product they desired wasn't available under the brand they preferred, they might merely purchase the same thing from a local brand. In economics, complementary goods are things that are related to one another and can be employed in tandem. The cross-price elasticity of demand for complementary items is negative. Any group of things that go well together can be considered complementary. An excellent complementing example is ketchup and hotdogs. Ketchup's demand may alter if there is a change in the demand for hotdogs. The cross-price elasticity of demand, which measures how sensitive a product's demand change sensitivity is to price changes of other products, is a method for determining substitutes and complements. Indifference Curves and Budget LineAn upward slope of the indifference curve indicates greater satisfaction. To obtain a greater utility level, a consumer, therefore, desires to cross the highest line. The consumer's modest salary, however, means that there are some financial limitations. On a graph, a budget line can be used to show the consumer's spending cap if they buy two items. The options for two different product pairings that a consumer with a limited budget can make are all shown on a budget line. It enables the user to purchase within a predetermined budget or within their present income. The budget line's slope depicts how two goods are priced in relation to one another. Additionally, the opportunity costs are defined by the disparity in prices. The budget line widens out further the lower the cost of the commodity. The marginal rate of substitution between two items is, alternatively, indicated by the slope of the curve. An ideal consumption bundle is produced when a curve crosses the consumer's own budgetary threshold. The Bottom LineAn indifference curve demonstrates the fundamental truth that, even while the utility of one thing rises while the utility of the other one declines, the combined utility of the two goods remains constant across all combinations.
Next TopicMonopolist
|
 For Videos Join Our Youtube Channel: Join Now
Feedback
- Send your Feedback to [email protected]
Help Others, Please Share


