| |

Accumulative Swing Index (ASI): Meaning and CalculationsThe Accumulative Swing Index (ASI) is a technical indicator that traders use to analyze market trends and potential reversals. It combines price data and cumulative calculations to determine the momentum and direction of the market. By incorporating the previous ASI value, the ASI indicator provides a cumulative representation of market momentum. The ASI is a valuable tool in technical analysis for making informed trading decisions. 
Advantages of Accumulative Swing IndexTrend IdentificationOne of the key advantages of ASI is its ability to identify and confirm trends in the market. By analyzing the ASI values, traders can determine whether the prevailing trend is bullish or bearish in nature. Positive ASI values indicate an uptrend, suggesting buying pressure, while negative values indicate a downtrend, suggesting selling pressure. This helps traders align their positions with the overall market direction, increasing the probability of successful trades and positive returns on investments. Let's say a trader is analyzing the ASI values of a stock and observes that the ASI consistently stays positive over a period of time. This indicates a clear uptrend in the stock, suggesting a higher probability of successful trades by taking long positions or holding existing positions. Simple Calculation MethodASI is calculated using a straightforward mathematical formula that incorporates price changes and the trading range. Traders do not need to perform complex calculations or rely on advanced mathematical models to obtain ASI values. The standard formula takes into account the opening, closing, high, and low prices, as well as the previous day's ASI value, making it relatively easy to compute and interpret. A trader calculates the ASI for a stock using the formula based on the daily price data. By plugging in the necessary values (opening, closing, high and low prices, and the previous day's ASI value), the trader obtains the current ASI value without the need for complex calculations or advanced mathematical models. Clear InterpretationASI provides clear and intuitive signals that are easy to interpret and analyze. Positive ASI values indicate an uptrend, suggesting buying pressure, while negative values indicate a downtrend, suggesting selling pressure. This straightforward interpretation allows traders to assess the prevailing market sentiment quickly and align their positions accordingly. Upon analyzing the ASI chart, a trader observes that the ASI values consistently remain positive for a particular currency pair. This clear interpretation indicates a strong uptrend, allowing the trader to make informed decisions based on the bullish market sentiment. Visual RepresentationASI can be displayed as a line chart or an oscillator, making it visually accessible to traders. Line charts show the direction and magnitude of ASI values, allowing traders to observe the overall trend, market fluctuations, and potential reversals. Oscillators plot ASI values around a centerline, facilitating the identification of overbought and oversold conditions. The visual representation enhances the clarity of the signals, aiding traders in their analysis and decision-making processes. A trader plots the ASI values as an oscillator below the price chart for a stock. The oscillator clearly shows the movements of the ASI above and below the centerline. The trader can identify overbought and oversold conditions by visually analyzing the oscillations, aiding in timely decision-making. User-Friendly Tools and PlatformsASI is supported by numerous technical analysis tools and trading platforms, making it easily accessible to traders for further analysis. These tools often provide built-in ASI indicators, allowing traders to quickly apply ASI to their charts and perform analysis without manual calculations, which increases the decision-making process considerably. The availability of user-friendly tools and platforms streamlines the process of utilizing ASI, reducing the learning curve for traders and making stock trading a more enjoyable experience. A trader uses a popular technical analysis software that provides a built-in ASI indicator. The trader can easily apply the ASI indicator to their charts with just a few clicks, saving time and effort in manual calculations. The intuitive interface and user-friendly tools streamline the process of utilizing ASI for analysis and trading. Suitable for Traders of All LevelsDue to its simplicity, ASI is suitable for traders of all levels, including beginners. Novice traders can quickly grasp the concept and apply ASI to their analysis, enabling them to make more informed trading decisions. Even experienced traders appreciate the simplicity of ASI as it allows them to incorporate it into their existing strategies or combine it with other technical indicators without significant complications. A novice trader learns about ASI and applies it to analyze the stock market. By observing the ASI values and their trends, the beginner gains insights into the market's overall direction and can make trading decisions based on the simplicity and clarity of ASI's interpretation. Time EfficiencyASI's simplicity contributes highly to time efficiency while trading. Traders can quickly calculate and analyze ASI values, enabling them to scan multiple assets or timeframes in very less time compared to manual sorting and searching. The ability to obtain insights promptly saves time and allows traders to focus on other aspects of their trading strategies, such as risk management and trade execution. A professional trader scans multiple assets using ASI to identify potential trading opportunities. By quickly calculating and analyzing ASI values for different stocks or currency pairs, the trader efficiently evaluates market trends and identifies potential setups, optimizing their time and productivity. Versatility and IntegrationASI is versatile and can be easily integrated with other technical indicators or trading systems. Traders can combine ASI with moving averages, trend lines, or other oscillators to enhance their analysis and generate more robust trading signals. Its compatibility with other tools and indicators adds to its overall usability and effectiveness. An experienced trader combines ASI with other technical indicators, such as moving averages and trend lines. By integrating ASI with these tools, the trader obtains a more comprehensive analysis of the market, validating signals and enhancing the accuracy of their trading decisions. Early Reversal SignalsASI is effective in providing early signals of potential trend reversals. When the ASI value crosses above or below a certain threshold, it indicates a possible change in market sentiment, giving the traders a heads-up to possibly make a big move. This also helps traders identify reversal points in advance and adjust their positions accordingly. Early detection of reversals can result in better entry or exit points, improving the overall profitability of trading strategies. Suppose the ASI value of a currency pair crosses below a certain threshold after a prolonged uptrend. This crossing indicates a potential reversal in the trend, allowing traders to anticipate the trend change in advance and adjust their positions accordingly, avoiding potential losses. Divergence DetectionASI is particularly useful in detecting divergences between the price action and the ASI value. Divergence occurs when the price of an asset is moving in one direction while the ASI is moving in the opposite direction. This indicates a potential weakening of the current trend. Traders can utilize this information to anticipate trend reversals or corrections, providing profit or risk management opportunities. Suppose a trader notices that a stock's price continues to make higher highs, but the ASI values are consistently declining. In that case, the divergence between the price and the ASI suggests a potential weakening of the current uptrend, signalling an opportunity for traders to consider reducing their exposure or preparing for a possible trend reversal. 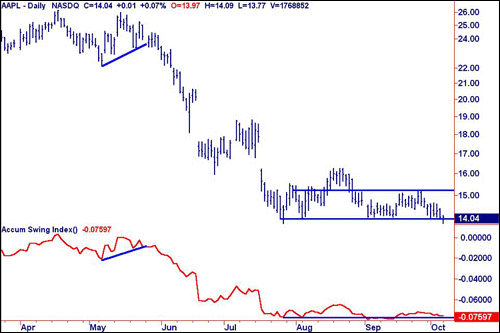
How is ASI Calculated?The Accumulative Swing Index (ASI) is a technical indicator that helps traders identify trends, potential reversals, and the strength of price movements in financial markets. Developed by J. Welles Wilder Jr., ASI combines price data and the previous ASI value to generate a cumulative index that represents the market's momentum and direction. The ASI Calculation Involves Several Components and Steps: Calculation of the Swing Index (SI):The Swing Index is the core component of ASI. It measures the price's relationship with the previous day's price and the current day's price range. The Swing Index is calculated using the following formula: SI = 50 × (C - Cy + 0.5 * (C - O) + 0.25 × (Cy - Oy)) / R Where: C represents the current close price. Cy represents the previous close price. O represents the current open price. Oy represents the previous open price. R represents the highest range value, which is selected from the following:
The Swing Index calculates the true price range of the current period, considering gaps, and assigns a value based on the close price's relationship with the previous period. Calculation of the Accumulative Swing Index (ASI):Once the Swing Index (SI) is calculated, the Accumulative Swing Index (ASI) is derived by adding the Swing Index value to the previous period's ASI. The initial ASI value is set as zero, and subsequent values are calculated using the following formula: ASI = ASI (previous period) + SI (current) This cumulative calculation allows ASI to accumulate values over time, representing the ongoing momentum and trend direction. Thus, the ASI calculation process can be summarized as follows:
Traders can track the evolving market momentum and direction by continuously updating the ASI with each new period. 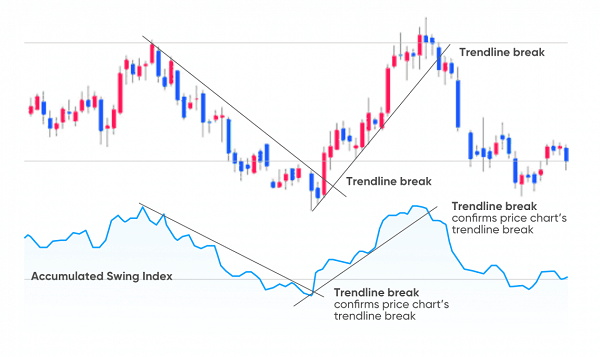
ASI ComponentsThe components of ASI are as follows:
Indicators of Accumulative Swing IndexTraders can utilize different ranges of the Accumulative Swing Index (ASI) to determine trading signals and make informed decisions. The specific range thresholds used may vary depending on individual preferences, market conditions, and the asset being traded. Here are the common ranges that traders often consider: Positive and Negative CrossoversTraders may focus on the positive and negative crossovers of the ASI line to identify potential trading opportunities. A positive crossover occurs when the ASI line crosses above zero, indicating a shift from negative to positive values. This crossover suggests a potential bullish trend. Conversely, a negative crossover happens when the ASI line crosses below zero, indicating a shift from positive to negative values. This crossover signals a potential bearish trend. Zero LineTraders pay attention to the ASI line's position relative to the zero line as an indication of market sentiment. When the ASI line remains at zero, it shows signs of a slow and average market; in such cases, people tend to wait for more market fluctuations, during which they can figure out a plan to make short selling and profit. Overbought and Oversold LevelsTraders often establish overbought and oversold levels on the ASI chart to identify potential reversals or trend exhaustion. These levels are typically set as thresholds above and below which the ASI is considered to be at extreme levels. When the ASI exceeds the overbought level, it indicates that the market may be overextended on the upside, and a price correction or reversal could occur. Conversely, when the ASI drops below the oversold level, it suggests that the market may be oversold and due for a bounce or a reversal to the upside. Support and Resistance LevelsTraders also use support and resistance levels on the ASI chart to identify key areas where the ASI may encounter obstacles or reversals. These levels can be identified based on historical price patterns, chart formations, or previous ASI turning points. When the ASI approaches a resistance level, traders may consider taking profits, tightening stop-loss orders, or looking for potential short trades, which ultimately brings the share price down. On the other hand, when the ASI approaches a support level, traders may watch for potential buying opportunities or long trades, which ultimately increases the stock price. ConclusionIn conclusion, the Accumulative Swing Index (ASI) is calculated by deriving the Swing Index (SI) from price data and adding it to the previous period's ASI value. The ASI accumulates these values over time, reflecting the market's momentum and direction. By understanding how ASI is calculated and its components, traders can effectively utilize this technical indicator to analyze trends, identify potential reversals, and gauge the strength of price movements in financial markets. Ultimately, traders should combine the use of ASI ranges with other technical indicators, risk management techniques, and overall trading strategies to increase the probability of successful trades. |
 For Videos Join Our Youtube Channel: Join Now
Feedback
- Send your Feedback to [email protected]
Help Others, Please Share


