| |

Three-Sigma LimitsWhat is meant by Three Sigma Limits?A statistical computation known as "three-sigma limits" is performed when the values are lying within three of the mean, i.e., standard deviation. Three-sigma refers to procedures that run smoothly and create products of the highest quality in commercial applications. 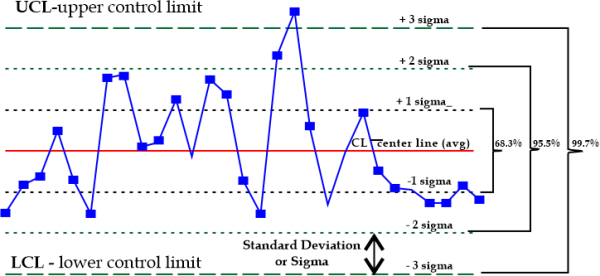
The upper and lower control ranges in statistical quality control graphs are defined using three-sigma limits. Flowcharts set boundaries for a commercial or industrial process under statistical control. Key Takeaways
Understanding Three Sigma LimitsShewhart charts are another name for control charts; they are named after American statistician, engineer, and physicist Walter A. Shewhart (1891-1967). Control charts are founded on the idea that some inherent variability in output measures occurs even in properly designed systems. 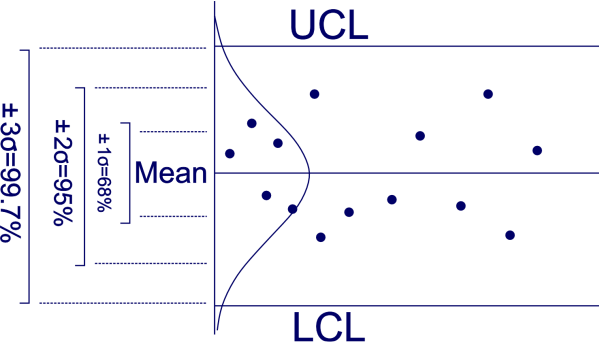
Control charts identify if a process has controlled or uncontrolled variance. Process quality variations resulting from accidental causes are considered under control; runaway methods encompass both arbitrary and unique variation causes. Control charts are used to identify whether special reasons are present. The standard deviation, often known as sigma, is a metric that statisticians and researchers use to assess deviation value shift. Sigma is a quantitative tool for determining how much variance there is from an average statistical value. Note: Investors utilise standard deviation to determine predicted volatility, also known as historical volatility; sigma indicates how much of observed volatility is away from the mean or average.Consider the standard bell curve, which assumes normality, to comprehend this measurement. A data point's deviation from the mean increases or decreases depending on how far to the right or left it is shown on the bell curve. From a different angle, low values show that the data points are relatively close to the mean, while high values indicate that the data is dispersed and not in the vicinity of the average. 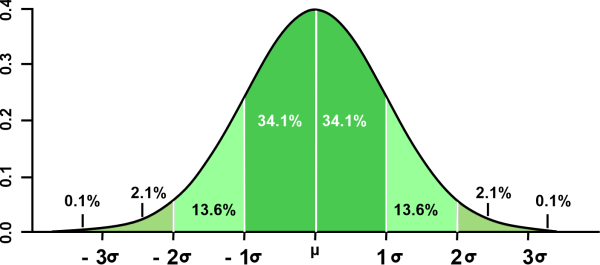
An Example of Calculating Three Sigma LimitConsider a manufacturing company that performs ten tests to check for variations in the quality of its output. The data points are 8.4, 8.5, 9.1, 9.3, 9.4, 9.5, 9.7, 9.7, 9.9, and 9.9. There are ten tests.
Special ConsiderationsThree standard deviations are indicated by the word "three-sigma". Shewhart established three-sigma limitations as a valuable and practical guide to minimising economic loss. With 0.27% control limits, three-sigma constraints define a range for the process parameter. Three-sigma control parameters are utilised to determine if a process's statistics are under statistical control. This is accomplished by selecting if data points are three standard deviations or less from the mean. Both the upper control limit (UCL) and the lower control limit (LCL) are set three sigma levels above and below the standard, respectively. 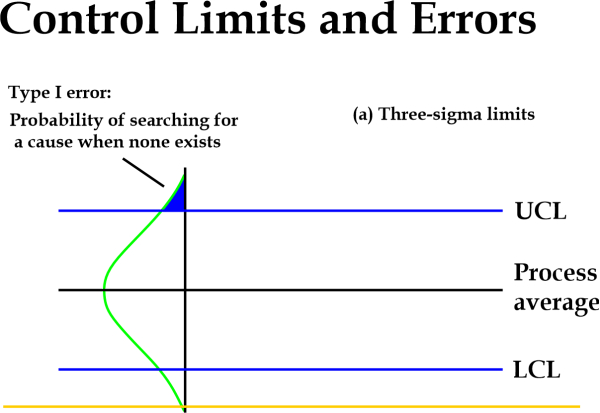
The data from a process should resemble a standard distribution curve around the average and within the pre-defined boundaries since about 99.73% of a controlled system will occur between positive or negative three sigmas. Less than 1% of all sample points on a bell curve are above the median and over the three-sigma line. |
 For Videos Join Our Youtube Channel: Join Now
Feedback
- Send your Feedback to [email protected]
Help Others, Please Share


