| |

Strategies Applications Behind The 50-Day EMA (INTC, AAPL)A popular technical indicator that offers valuable insights into a stock's price movements is the 50-day Exponential Moving Average (EMA). For two well-known technology stocks, Intel Corporation (INTC) and Apple Inc. (AAPL), we will examine the concepts and uses of the 50-day EMA in this article. Investors can trade in stocks with greater confidence if they thoroughly understand this indicator's operation and practical applications. Definition of 50-Day EMAAs a technical indicator, the 50-day Exponential Moving Average (EMA) is used to examine patterns in stock price over a given time frame. The EMA is more responsive to recent price movements than the Simple Moving Average (SMA) because it gives greater weight to recent data points. The closing prices of a stock over the previous 50 trading days are considered to determine the 50-day EMA. The EMA smooths out price swings to show the underlying trend. It is generated using a multiplier determined from the chosen period. To determine whether a stock's price is continuously above or below the 50-day EMA, which denotes bullish or bearish trends, respectively, traders frequently interpret this value. CalculationThe following procedures are necessary to calculate the 50-day EMA:
EMA = (Closing Price - Prior EMA) x Multiplier + Previous EMA Interpretation of EMA TrendsThe 50-day EMA might offer insightful information about the company's price trend. A bullish trend, or rising stock price, is suggested when the stock price is constantly above the 50-day EMA. On the other hand, a bearish trend, or a decline in the company's price, is indicated when the stock price repeatedly drops below the 50-day EMA. When deciding whether to purchase or sell stocks, traders, and investors frequently combine these trends with additional indicators and analytical tools. The Critical Difference from Simple Moving Average (SMA)The calculating process and weighting of data points for the 50-day Exponential Moving Average (EMA) differ from those for the Simple Moving Average (SMA). While both indicators can spot patterns and smooth out price volatility, the EMA gives more weight to recent data. The weighting given to each data point is what makes a difference. All data points for the chosen time period are given equal weight in the SMA. For instance, each of the 50 closing prices in a 50-day SMA has equal weight. On the other hand, the EMA gives recent prices greater weight, making it more sensitive to shifts in the stock's price trend. A multiplier based on the chosen time period determines the weighting. In contrast to earlier data points, the more recent data points significantly influence the EMA computation. As a result, the EMA responds to price fluctuations and new market information more swiftly. It is especially beneficial for short-term trading techniques where investors want to profit from recent price changes. Conversely, the SMA offers a smoother and more consistent picture of the overall price trend, making it frequently selected for longer-term trend research. Pullbacks<Pullbacks are temporary reversals in the price trend of a financial asset, such as a stock, currency, or commodity. They are sometimes referred to as retracements or corrections. They happen when an asset's price moves against the prevailing trend, causing a brief dip or pause before the general trend resumes. Pullbacks are common in market fluctuations and can present traders and investors with lucrative chances. A pullback is a brief fall in price that occurs before an uptrend restart. In a downtrend, a pullback is a temporary price increase before the continuation of the trend. 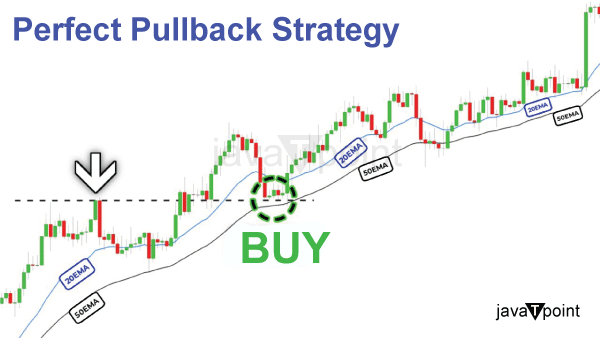
Pullbacks happen when a stock's price or another financial instrument's price briefly falls below the 50-day EMA before resuming an upward trend when the price is regularly above the EMA during an uptrend. With the idea that the upswing will continue, these pullbacks allow traders to enter positions at potentially lower prices. In contrast, pullbacks happen in a downtrend when the price briefly surpasses the 50-day EMA before continuing to fall. During these pullbacks, traders may have the chance to open new short bets or close down current long holdings. To determine the trend's strength, traders frequently observe how the price behaves with the 50-day EMA during pullbacks. If the price respects the 50-day EMA by hitting resistance during a downtrend or finding support during an upswing, the trend is still strong and likely to last. Various technical analysis tools, including trendlines, support, resistance levels, or other indicators, can be used to evaluate pullbacks to pinpoint probable entry or exit positions. To improve the likelihood of profitable trades and efficiently manage risk, combining the study of pullbacks with other technical and fundamental aspects is crucial. Advantages and Disadvantages of 50 EMA StrategyAdvantages
DisadvantagesLike all moving averages, the EMA is a lagging indicator because it depends on historical price information. It might not give accurate signals in time for quick price movements or abrupt market reversals as expected.
Tips for Implementing the 50 EMA StrategyHere are some tips for implementing the 50 EMA strategy:
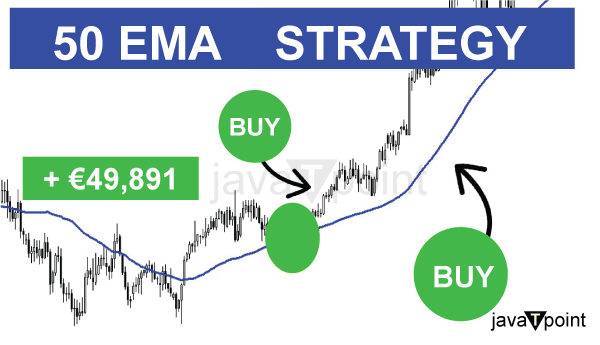
50 Day FractalsTrading fractals are patterns that repeatedly appear at various scales or timeframes and reveal potential turning points or essential price levels. Finding patterns that appear over 50 days is the primary goal of 50-day fractals. These fractals indicate possible trend reversals or continuations. The moving average performs equally well in both shorter and longer time frames. Determining natural endpoints for intraday oscillations is a benefit of using 50-bar EMAs on 15 and 60-minute charts for day traders. Just keep in mind that noise gets worse as the time frame gets smaller, which reduces its significance on charts for 5 and 1 minutes. The indicator, on the other hand, has exceptional dependability on weekly and monthly charts, frequently identifying precise turning points in corrections and long-term trends. This makes sense when you realize that the 50-week EMA defines mean reversion over a year. In contrast, the 50-month EMA follows market activity over more than four years, which is close to the typical duration of a business cycle. While violations provide the ideal levels to take profits and reallocate capital into other long-term instruments, market timers can use these moving averages to construct profitable positions lasting for months or years. Example: In 2009 and 2013, Apple (AAPL) created fantastic buying chances near the 50-month EMA. In April 2009, it remounted that level after breaking through moving average support in September 2008, sending out a "failure of a failure" buy signal that resulted in gains of more than 80 points over three years. After a second test of the moving average in 2013, it spent four months forming a double bottom that set off a 100 percent surge into 2014. It is essential to note how the lower level coincides with support, providing a very low-risk entry for frequent market participants. 50-200 Day PinballA trading method known as the "50-200 pinball" combines the 50-day and 200-day Simple Moving Averages (SMA). It entails using the 200-day SMA to confirm trend direction and the 50-day SMA as an emotional support or resistance level. Trading professionals wait for the price to bounce off the 50-day SMA like a pinball before confirming the trend by examining how it interacts with the 200-day SMA. A bullish trend is suggested by a price that continuously exceeds the 200-day SMA, while a bearish trend is suggested by a price that constantly falls below it. Traders can use this method to determine potential entry or exit points based on how these moving averages interact. Example: After a prolonged upswing, Biogen (BIIB) reached a new high in March before entering a sharp decline that broke the 50-day EMA a few days later. After crossing more than 75 points between new resistance at the 50-day EMA and long-term support at the 200-day EMA, price movement launched a two-month game of 50-200 pinball. Swing reversals occurred in close proximity to the targets, enabling simple entry and reasonably close stops for a stock with a triple-digit price range. Bullish and Bearish CrossoversBullish and bearish crossovers are terms used in technical analysis to describe the interaction between two moving averages, typically shorter and longer-term. Here's an explanation of both: Bullish Crossover: A bullish crossover happens when the 200-day SMA crosses above the 50-day SMA, a shorter-term moving average. This crossover points to a possible transition from a downtrend to an uptrend, indicating that there may be rising purchasing pressure. It is seen as a bullish indication and may lead traders to open new long bets or expand their current bullish ones. The crossover is frequently taken as a sign that rising momentum is present. Bearish Crossover: A bearish crossover takes place when the shorter-term moving average crosses below the longer-term moving average. For instance, the 200-day SMA and the 50-day SMA both cross below. This crossover points to the possibility of a change in trend from an uptrend to a downtrend, indicating that there may be growing selling pressure. A bearish indication can cause traders to open new short bets or enhance their existing bearish positions. The crossover is frequently interpreted as confirming downward momentum. The Bottom LineThe 50-day EMA pinpoints a natural mean reversion level for the intermediate time range. It has several uses in strategy design, position selection, and price prediction. The 50-day EMA study is helpful for traders, market timers, and investors alike, making it an essential component of your technical market analysis. |
 For Videos Join Our Youtube Channel: Join Now
Feedback
- Send your Feedback to [email protected]
Help Others, Please Share


