| |

Moving Average Strategies for Forex TradingUnderstanding the Moving Average Trading StrategyA Moving Average is a popular technical analysis method for forecasting future price movements using past price data. To discover opportunities, investment analysts meticulously monitor price changes. It applies to all financial instruments, including stocks, commodities, currencies, indexes, and exchange-traded funds (ETFs). 
Simply put, the Moving Average is an asset's average market price over a given (or considered) period. The moving average is named from the fact that it is displayed on a chart bar by bar and generates a line along the chart as the mean price moves. CharacteristicsThe following are the essential characteristics that define the simple moving average: CustomizableIt may be tailored to different periods. A 10-day simple moving average could be used by a short-term investor to assess short-term trends. A long-term investor, on the other hand, might like a 200-day simple moving average. Short-term simple moving averages frequently react faster to price changes in underlying assets than long-term moving averages. VolatilityIt also minimizes volatility. The simpler the moving average, the longer the moving average's time horizon. The short-term moving average, despite being more volatile, is closer to the recent source of data but somewhat riskier to utilize to reach any trading conclusion. Lagging IndicatorIt is a lagging indicator based on price movements in the past. The lag is proportional to the SMA (simple moving average) period, with the more prolonged SMA period resulting in a more considerable lag. Moving Average's BenefitsTraders and analysts evaluate market mood using technical methods such as simple moving averages at the most basic level. A primary Moving Average is mainly used for trend analysis and determining support and resistance levels: Analysis of TrendsIt is used to determine if the price of a security is rising or falling. A security trading above its simple moving average is in an uptrend, according to the simple moving average trading rule. A security trading below its simple moving average, on the other hand, is in a downtrend. Another analytical use may include comparing two simple moving averages that cover different time frames. When the shorter-term moving average exceeds the longer-term moving average, an uptrend is predicted. In contrast, if the longer-term moving average is higher than the shorter-term moving average, it shows a planned downturn. Support and ResistDuring a trend, a simple moving average can also assist in identifying support and resistance levels. In a long-term uptrend, for example, security may fall slightly but find support near the 200-day simple moving average. As a result, the 200-day simple moving average acts as support. It can offer assistance in the identification of a trend changeover. Moving Average's LimitationsIt forecasts future trends using previous data. However, it is often assumed that market prices are efficient and accurately reflect all available information. In an efficient market, it is believed that the last price data has little bearing on the future direction of asset prices. As a result, the usefulness of a simple moving average is called into question. In fact, it is not the proven approach and analysts also suggest considering other factors. Furthermore, it is still being determined whether the emphasis should be on the era's most current or historical data. Some traders feel that recent data will correctly portray a security's current trend. Others argue that favouring specific dates over others will skew the pattern. SMA CrossoverThe price of an asset crossing its simple moving averages is a standard trading signal. The most popular are bullish, bearish, and moving-average crosses: Bullish CrossoverIt happens when the price of an asset climbs above its simple moving average after dropping below it. The price movement signals that the correction has ended and that an uptrend may be coming. As a result, the bullish crossing signals the start of long trade options. In the case of a long-term slump, bullish crosses are less critical. Bearish CrossoverIt is the inverse of a bullish crossover since an asset's price falls below the simple moving average after trading above it. A bearish crossing indicates that the uptrend has ended and a decline is imminent. A bearish crossing demonstrates the time to exit a long transaction or begin a short position. In a choppy or sideways market, a bearish crossover may be inefficient. Moving-Average CrossoverIt occurs when a short-term simple moving average crosses over a long-term simple moving average. Moving-average crossovers include the golden and death crosses, such as:
Where are Simple Moving Averages used?Traders use a basic moving averages trading approach to monitor the price trend of security in a specific period while ignoring day-to-day price variations. Traders can compare trends over short, medium, and long periods. The moving average and its strategies are used in a variety of trading tactics. Apart from these, a moving average trading method may be used for technical and fundamental research. While the methods of analysis differ, a simple moving average is employed to supplement both. Exponential Moving Average vs Simple Moving AverageIn the forex trading strategy, two primary MA indicators are used: the simple moving average (SMA) and the exponential moving average (EMA). The SMA is just the market's average price over the selected period. To apply it, one can simply add the closing prices from the preceding 200 days and divide the total by 200. However, an SMA can only provide half of the story because markets respond to news and current events. In other scenarios, one may try exponential moving averages (EMA), which compute the average price of a market but also give significantly more weight to recent price movements and far less importance to previous ones. Which moving average is the most effective?There is no one-size-fits-all method when selecting an efficient moving average for establishing the optimal moving average. The investing time horizon is a critical component that influences the importance of the moving average. Below are the few moving averages plans that are frequently employed:
How to use Moving Averages in Forex Trading?It is used in a variety of ways in forex trading. Nonetheless, there are certain strategies (called Moving Average Strategies) that are most utilized for effective results in forex trading. These strategies are typically used to identify existing or impending trends in the currency market. Apart from the moving average strategies, there is also a moving average (MA) indicator, which is one of the most used technical indicators for forex traders. This entails charting MA lines on the market for a pre-specified time, either using the platform-provided indicator or manually. On a chart, for example, you may use a single MA to determine whether the market is rising or falling. What exactly are the various moving average strategies for forex trading?The following are notable moving average strategies used for effective forex trading: 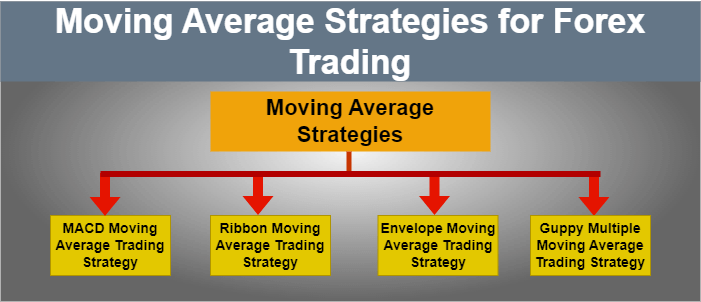
The MACD Trading StrategyThe moving average convergence divergence histogram, sometimes known as the 'MACD', is a popular technique for trading via moving averages. The MACD is a momentum indicator that may be found on a variety of financial and trading platforms. The MACD is used to look for either convergence or divergence. Also, there are numerous approaches within the MACD methodology. For instance, a crossover strategy can be used to trade. Given that the MACD is above the zero line while the price is trending higher and the MACD line crosses above the signal line from below, it suggests buying. In contrast, considering the downtrend and MACD is below the zero line, when the MACD crosses below the signal line; it suggests short selling. The Ribbon Trading StrategyThe ribbon trading method comprises many EMA or SMA lines of varied periods on the same chart, generally around ten. This produces a ribbon-like chart that can provide information to traders that more comprehensive MA charts with fewer lines cannot. When employing EMAs, for example, a ribbon method might provide a solid indication of a trend's strength and possible duration. While one or two shorter-term MA lines may detect a pattern, the longer-term lines might confirm or call it into doubt. Because of its adaptability, the ribbon method is the most popular among moving average strategies for forex trading. It can always be customized by deciding how many MA lines to display and whether they should be SMAs or EMAs. Crossovers would be sought, as with many other tactics. With the ribbon technique, though, there will probably be many more of them - and the more lines one selects, the more crossings there will be. This might be somewhat intimidating for new traders. When the price flattens into a sideways range, look for a time when all (or most) of the moving averages converge closely. The multiple moving averages should ideally be so close together that they create nearly one thick line, with very little space between the separate (or different) moving average lines. Bracket the tight trading range with a purchase order above the range's high and a sell order below the range's low. If the buy order is activated, set an initial stop-loss order below the trading range's low; if the sell order is triggered, place a stop slightly above the range's high. The Envelope Trading StrategyThe disadvantage of adopting the two tactics mentioned above is that a trend can alter abruptly and unpredictably in the volatile and fast-changing world of forex. In this strategy, moving average envelopes are utilized, which are typical percentage-based envelopes set above and below a moving average. With the envelope approach, two filters would be placed at predetermined places above and below the MA line, such as 1% and 5% above and below the MA. These provide further support and resistance to the current price, suggesting whether or not the trend is sustainable. In this way, the envelope trading strategy can be utilized in specific use cases. However, forex traders should test out different percentages, time intervals, and currency pairs to understand how they can best employ an envelope strategy. Guppy Multiple Moving Average Trading StrategyThis strategy includes tactics that are made up of 2 sets of exponential moving averages. The 1st set includes EMAs for the previous 3, 5, 8, 10, 12, and 15 trading days. A 2nd set consists of EMAs for the previous 20, 40, 60, 80 and 100 days. If revisions are required to compensate for the characteristics of a specific currency pair, the long-term EMAs are altered/ modified accordingly. Simply put, this second collection is meant to represent longer-term investment activity. If a short-term trend is not supported by longer-term averages, it may signal that the longer-term trend is exhausted. In such a case, one may refer to the ribbon method. This approach represents the short-term moving averages in one colour and the longer-term moving averages in another. The trend may reverse when the shorter standards pass below or above the longer-term moving averages. As with the Ribbon, one must also keep an eye out for crossovers between the two sets. The Bottom LineAs the world is evolving in all kinds of technologies, approaches and methods, the financial world is also keeping up with that pace. So, when it comes to forex trading, there are no exceptions there. As an investor, there are many different approaches to go for in today's world. Some are classics, while some are new and can be highly tuned for the desired outcome of what investors like. In this article, we touch upon SMAs, which are something of a stepping stone when someone tries hands in the trading world. SMA is a flexible trading method that serves both short-term and long-term investors. It reduces volatility by averaging the security's price over a set length of time. It aids in the identification of trends and supports investors in the identification of trading opportunities.
Next TopicRussell 2000 Index
|
 For Videos Join Our Youtube Channel: Join Now
Feedback
- Send your Feedback to [email protected]
Help Others, Please Share


