Spotting Breakouts as Easy as ACD
Introduction to ACD
Modern trading techniques typically refer to the ACD, particularly when discussing intraday trading and market research. It refers to a technical indication that aids traders in anticipating possible price changes during a particular trading session. Mark B. Fisher, a well-known trader and author, created and theoretically established the concept of ACD.
The Opening Range (OR), Average Daily Range (ADR), and Current Day's Range (CDR) serve as the foundation for the ACD indicator. The price range set during the opening few minutes of a trading session, usually the first 30 minutes, is called the Opening Range. The Average Daily Range calculates an asset's average price range from high to low during a given time frame, often the last 10 to 20 trading days. The actual price range seen during the current trading session is the Current Day's Range, which is the last category.
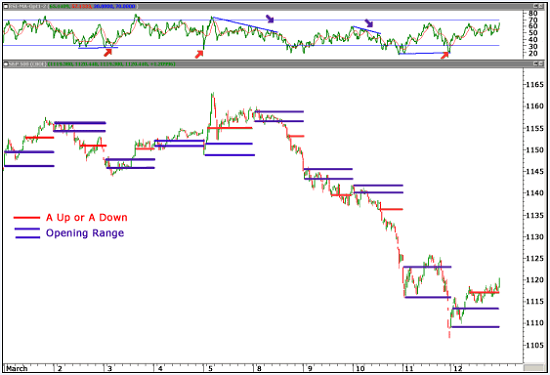
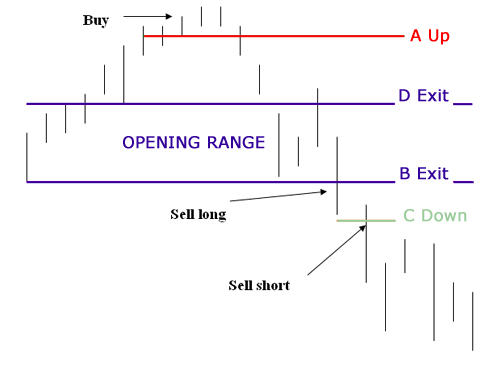
Traders first establish the High Range (HR) and Low Range (LR) based on the Opening Range before calculating the ACD levels. While the Lower Range is obtained by deducting the Opening Range from the OR's low, the High Range is computed by adding the Opening Range to the OR's high. The ADR is subsequently added to the HR and deducted from the LR. The results of these calculations are the upper and lower levels of the ACD. Traders use ACD levels to find prospective trading opportunities. When the price exceeds the ACD upper level, it implies bullish momentum and presents a chance to place long trades.
On the other hand, if the price drops below the lower ACD level, it suggests negative momentum and presents an opportunity to start short bets. Traders can also use the distance between the ACD levels and the Opening Range to gauge market strength. A wider gap denotes greater volatility and the possibility of big price changes.
The ACD idea is frequently used in conjunction with other technical indicators and trading strategies to improve decision-making. It gives traders an organized way to assess intraday price dynamics, assisting in picking entry and exit locations and risk management. Market participants seek to profit from brief price changes and enhance their trading success by adding ACD into their trading strategies, which helps them strategize their trading approaches.
Applications of ACD in Various Fields
You can strategize and implement ACD in various trading fields to logically understand the fluctuating market. Some of the applications of the ACD are as follows:
- Breakout Trading: ACD can be utilized in breakout trading strategies. Traders monitor the price movement when it breaks above the ACD upper level or below the ACD lower level, indicating potential breakouts and opportunities for entering trades in the breakout direction.
- Intraday Scalping: ACD is often employed by intraday scalpers who aim to profit from small price movements within a single trading session. Traders use ACD levels to identify short-term price fluctuations and execute quick trades to capture small profits multiple times throughout the day.
- Stop Loss Placement: ACD can assist traders in determining appropriate levels for placing stop-loss orders. Considering the ACD upper and lower levels, traders can set stop-loss orders outside these ranges to limit potential losses and protect their positions.
- Trade Management: ACD provides traders with a framework for managing their trades. Traders can adjust their profit targets based on the distance between the ACD levels and the Opening Range. A larger gap may indicate the potential for larger price movements and assist prompt traders to extend their profit targets.
- Market Reversals: ACD levels can also identify potential market reversals. If the price reaches the ACD upper level and shows signs of weakness or fails to sustain upward momentum, it could indicate a possible reversal to the downside. Similarly, if the price drops to the ACD lower level and exhibits strength or fails to continue downward, it may indicate a potential reversal to the upside.
- Trend Confirmation: ACD can also be employed to confirm the presence of a trend. If the price consistently stays above the ACD upper level, it suggests a strong bullish trend. Conversely, if the price consistently remains below the ACD lower level, it indicates a strong bearish trend.
- Price Range Assessment: ACD helps traders evaluate the potential range of price movements within a single trading session, enabling them to identify profit opportunities.
- Risk Management: ACD provides a systematic approach to managing risk by considering the distance between ACD levels and the Opening Range. Based on this information, traders can adjust their position sizes and set appropriate stop-loss levels.
- Faster Decision Making: With ACD as a tool for indication of the market's fluctuation, traders can easily visualize the changes in the market and predict the growth pattern of their desired shares, and strategize their investment plans quickly and simply.
Components of ACD
ACD, like many other indicators, has several components which combine and work with synergy to provide the asked-for analysis. The major components of the ACD are listed as follows:
- Opening Range (OR): The Opening Range (OR) is the price range set during the first 30 minutes of a trading session. It is used as a benchmark when figuring the ACD levels.
- Average Daily Range (ADR): The ADR calculates the average price range from high to low of an asset over a given time, usually the last 10 to 20 trading days. ADR is a crucial factor in figuring out ACD levels.
- Current Day's Range (CDR): The current trading session's real price range is considered the current day's range (CDR). It is figured up by deducting the day's low price from its high price.
- High Range (HR): To determine the High Range, add the Opening Range to the highest value of the OR. It stands for the maximum possible price range for the ongoing trading session.
- Low Range (LR): To calculate the Low Range, subtract the Opening Range from the lowest value of the OR. It stands for the lower end of the possible price range for the trading session.
- The midpoint (MP): The midpoint in ACD serves as a reference point between the HR and LR and hence, is the average of the high and low of the opening range. It is usually calculated to find out how the market is performing on average at a given time of the day.
- ACD Upper Level: The ACD upper level is determined by adding the ADR to the HR. If the price surpasses this level, it suggests bullish momentum, indicating an opportunity to enter long positions.
- ACD Lower Level: The ACD lower level is obtained by subtracting the ADR from the LR. If the price falls below this level, it implies bearish momentum, signalling a chance to initiate short positions.
These components collectively form the ACD indicator, providing traders with valuable information to assess price dynamics, identify trading opportunities, manage risk, and make informed trading decisions. The midpoint is an additional reference point to evaluate the distance between the HR and LR, offering insights into the strength of price movements and potential reversals.
Role of Pivots in ACD
Pivots play a significant role in the stock market's Average Current Day Range calculations. They act as reference points for determining potential support and resistance levels, aiding in identifying price movements and trade opportunities within a trading session.
Components of Pivots
Pivot Point (PP):
- The Pivot Point is a key level calculated based on the previous day's high, low, and close prices.
- It serves as a baseline for determining potential support and resistance levels.
Support Levels:
- Support levels are calculated below the Pivot Point.
- The first support level (S1) is derived by multiplying the Pivot Point by two and subtracting the previous day's high.
- The second support level (S2) is obtained by subtracting the previous day's high from twice the Pivot Point and adding the previous day's low.
Resistance Levels:
- Resistance levels are calculated above the Pivot Point.
- The first resistance level (R1) is derived by multiplying the Pivot Point by two and subtracting the previous day's low.
- The second resistance level (R2) is obtained by adding the previous day's high to twice the Pivot Point and subtracting the previous day's low.
Calculation of Pivots
Calculation of Pivot Points:
- Pivot Point = (Previous High + Previous Low + Previous Close) / 3
Calculation of Support Levels:
- S1 = (2 * Pivot Point) - Previous High
- S2 = Pivot Point - (Previous High - Previous Low)
Calculate Resistance Levels:
- R1 = (2 * Pivot Point) - Previous Low
- R2 = Pivot Point + (Previous High - Previous Low)
Application of Pivots in ACD
- Support and Resistance Levels: Pivots help identify key support and resistance levels for a trading session. Traders monitor these levels to determine potential price reversals or breakouts.
- ACD Calculation: Pivots, especially the Pivot Point, are used in the ACD formula to determine the High Range (HR) and Low Range (LR). The Pivot Point acts as a reference point for the ACD calculations.
- Trade Entry and Exit Points: Pivots assist in determining optimal entry and exit points for trades based on potential price reactions at support and resistance levels.
- Trend Analysis: Pivots can be used to assess the strength and direction of a trend. Traders analyze price movements around Pivot Point and support/resistance levels to identify bullish or bearish market conditions.
- Breakout Confirmation: Pivots can help confirm breakouts in the stock market. Traders look for price movements that break above a resistance level (R1 or R2) or below a support level (S1 or S2) to validate a breakout and consider it a potential trading opportunity.
- Profit Target Levels: Pivots help establish profit target levels for trades. Traders may set profit targets near key support or resistance levels based on the assumption that the price will likely encounter selling pressure or buying interest.
- Multiple Time Frame Analysis: Pivots are used in time frame analysis to identify significant support and resistance levels across different time frames. Traders consider short-term and long-term pivots to gain a broader perspective on potential price movements.
- Volatility Assessment: Pivots can also provide insights into market volatility. Wide price ranges between support and resistance levels indicate high volatility, while narrow ranges suggest low volatility.
Getting Ready for Trading with ACD
Let's say Mrinalika is a day trader who mainly focuses on breakout trading strategies. She incorporates ACD into her analysis to identify potential trading opportunities. Here's how she applies ACD in her trading:
- Morning Preparation: Mrinalika starts by analyzing the current trading session's Opening Range (OR), typically the first 30 minutes of trading. She notes the high and low of the OR. Mrinalika also ensures that she follows the latest news updates of the major players in the trading sector she is planning to invest in, whether it be the metals industry or the FMCG industry.
- Calculating ADR: Afterwards, Mrinalika calculates the Average Daily Range (ADR) based on the previous ten trading days. She summarizes the daily price ranges (high to low) for the past ten days and divides the total by 10 to obtain the ADR.
- Determining ACD Levels: Using the OR and ADR, Mrinalika calculates the High Range (HR) and Low Range (LR). She adds the OR high to the ADR to determine the ACD Upper Level and then subtracts the ADR from the OR low to calculate the ACD Lower Level.
- Identifying Breakout Opportunities: Mrinalika monitors the price action throughout the trading session. If the price breaks above the ACD Upper Level, it signals a potential bullish breakout. Conversely, if the price breaks below the ACD Lower Level, it indicates a possible bearish breakout.
- Entry Strategy: When Mrinalika identifies a breakout, she waits for confirmation, such as a strong candlestick pattern or increased trading volume, before entering a trade. She sets her profit target based on the distance between the ACD levels and the OR, adjusting it accordingly.
- Exit Strategy: Once she figures out that the candlesticks fluctuate more than her comprehension and the stock price is highly unpredictable, she decides to exit the market as a safe play. She also sets a stop-loss order outside the ACD levels to manage risk and lower the loss margin/ range.
- Monitoring Price Reversals: During the trading session, Mrinalika pays attention to the price's behaviour around the ACD levels. If the price reaches the ACD Upper Level but fails to sustain upward momentum or shows signs of weakness, it may indicate a potential reversal to the downside. Similarly, if the price drops to the ACD Lower Level but exhibits strength or fails to continue downward, it may suggest a potential reversal to the upside.
By incorporating ACD into her trading strategy, Mrinalika can identify potential breakouts, set profit targets, stop-loss levels, and manage risk effectively. It helps her make informed trading decisions based on the price dynamics within the trading session, enhancing the probability of successful trades.
The Bottom Line
In conclusion, ACD is a valuable tool used in the stock market to gauge price volatility and identify potential trading opportunities within a trading session. ACD has several important applications. It helps traders identify potential breakouts, set profit targets, stop-loss levels, manage risk, and monitor price reversals. By incorporating ACD into their trading strategies, traders can enhance their ability to identify favourable entry points and capitalize on price movements.
Furthermore, pivots play a crucial role in ACD calculations and analysis. They are reference points for determining support and resistance levels, confirming breakouts, and identifying potential price reversals. Pivots provide traders with valuable insights into market dynamics and aid in establishing optimal entry and exit points. It's important to note that ACD should not be used as the sole basis for trading decisions. Traders should consider other technical indicators, market conditions, and risk management strategies to ensure a well-rounded approach.
|

 For Videos Join Our Youtube Channel: Join Now


