| |

Sine WaveUnderstanding Sine WaveA geometric curve with a sine wave has an oscillation that is smooth, continuous, and periodic. It informs traders if a market is moving up or going down through a cycle. 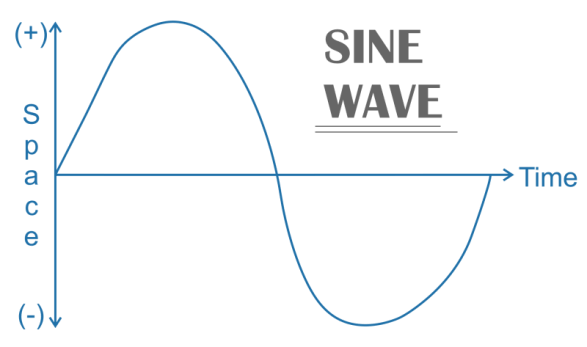
Technical analysis and stock trading both employ sine waves as analytical trading tools to help spot trends. They reveal whether a market is moving or flowing in a cycle mode. It helps traders identify possible shifts and trend crossovers as well as the start and end of a trending move. An oscillating sine wave indicates that it repeats its habit of moving up, down, or side to side. It is described mathematically by the function y = sin x. It appears as a smooth, s-shaped wave on a graph, oscillating on both sides, above and below zero. Sine waves are used in technical analysis and financial trading to identify patterns and cross-overs related to fluctuating prices and market trends. A Closer Look at the Sine Wave ComponentsAmplitudeThe greatest distance a sine wave can deviate from zero is its amplitude. The sine function has a range of +1 to -1 and an amplitude of 1. It is the distance between the centerline or the mean position and the top and bottom of a crest or trough. The peak-to-peak voltage (Vpp) is frequently considered when discussing the amplitude of electrical voltage measurements. Waves are usually in the form of how sound travels. However, in the case of a sound wave, the higher the volume of the sound, the higher the amplitude. FrequencyThe number of whole cycles that occur per second makes up a sine wave's frequency. The terms cycle and period are interchangeable. Cycles per second are the units used to measure frequency. The Hertz sometimes referred to as Hz, is a common unit of frequency that can also be used for this. Hertz is comparable to one cycle every second (1Hz). A sound wave with a frequency of roughly 256Hz represents Middle C on the piano. If you set your FM radio to 88.4, it indicates that the radio wave that is transmitting that station or channel has a frequency of 88.4MHz or 88.4 million cycles per second. PeriodThe duration of a wave is the time required for one full cycle to occur. The wave is a series of identical, repeating cycles. The electrical current in a typical American home lasts 1/6 of a second. This tiny period of time is commonly measured in milliseconds (Ms), or one-thousandth of a second, due to the American electrical standard's frequency of 60Hz, or 60 cycles per second. One-sixtieth of a second lasts for about 17 milliseconds. Market Indicators using Sine WavesSome investors have a strong conviction that the financial markets follow cycles. The sine wave indicator was developed based on the presumption that markets adhere to these cyclical patterns. Once a cycle has been discovered, a trader may attempt to create a leading indicator using the pattern. When the market moves in cycles, this works incredibly well. Investors must also make necessary trading adjustments because this strategy fails when the market moves. Markets often go through cycles and trending phases back-to-back. Prices overshooting, failing to break out, or bouncing off support or resistance levels are indications of cyclical phases. Highs, new lows, and pullbacks are signs of a trending period. Until the trend loses velocity and turns around, momentum still moves in the trend's direction. Often, oscillators with sine-shaped features are employed in technical analysis. An oscillator operates between two extreme values, and the output is used to create a trend indicator. The trend indicator is then used by the analysts to spot instances of momentary overbought or oversold conditions. Analysts interpret information such as the oscillator's value approaching the higher extreme value as indicating that the asset is overbought and information such as the oscillator's value approaching the lower extreme value as indicating that the asset is oversold. Financial Market Cycles and PatternsPrices on the stock and commodity markets frequently fluctuate in a predictable and recurrent way. On a chart, they may resemble a string of ocean waves or a succession of waves, each with a distinct height and length. When the waves are identical or nearly identical from wave to wave, the pattern is referred to as a cycle. Alternatively, the waves can be proportionate to one another all the time. Some market price cycles correspond to changes in the economy. Some patterns that resemble cycles adhere to a different principle. Some traders, for instance, search for patterns in the sunspot cycle or lunar cycle. The idea that human behaviour creates and repeats in particular recurrent patterns can also be applied to financial markets. However, it is impossible to say whether an occurrence that causes a cycle in the financial markets is random or results from some peculiar element of crowd behaviour. Notable Behaviour
Analyzing Charts with the Sine Wave PatternThe sine wave has a strong foundation in geometry and trigonometry, making it a useful technical chart analysis tool. The purpose of this indicator is to show whether a market is trending or in a cycle phase. Consequently, this can assist traders in determining the beginning and end of a trending move and potential trend changes. The MESA indication is the leading indicator. Based on an algorithm that was initially used for digital signal processing, John Ehlers created it. The MESA Phase foresees both short- and long-term market movements. The Sine Waves and the Lead Wave are the lines that make it up. The Composite Index of Lagging Indicators displays a sine wave. This is so because the index's constituent measurements-ratios and interest rates-tend to fluctuate in value. For instance, inflation is constantly held within predetermined ranges. Once inflation hits or exceeds a set threshold, interest rates will be changed to either increase or decrease inflation. As a result, inflation is reduced to the desired level. Thus, interest rates will fluctuate up and down to limit an undesirable inflation rate as it rises, falls, or stays the same. 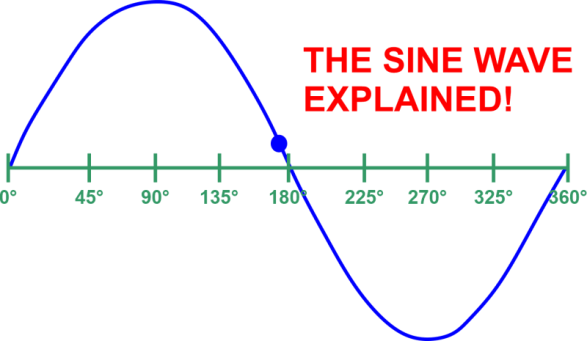
Sine Wave Crossover AnalysisBuy or sell signals can be produced by crossovers between sine and leading waves, which can identify turning moments. Additionally, the indicator can indicate whether a market is overbought or oversold. This indicates that the price is either too high or excessively low, helping to predict trends pause or reversal. Sine wave analysis is an optional technique that can be used in conjunction with other approaches. For instance, non-correlated indicators based on moving averages. In any case, the Sine Wave is a helpful tool that gives an analyst technical information. However, it is not technically proven perfectly. Under the right circumstances, line crossovers may also serve as turning point indicators and give buy or sell signals. The indicator may also indicate an overbought or oversold market (i.e., an unjustifiably high or low), which might impact the current trend's direction. Whether used alone or in combination with other techniques or non-correlated indicators, the sine waves are especially beneficial for a trader (such as moving average-based indicators). Final Thoughts on Sine Wave Patterns and Financial CyclesSometimes indicators don't work as expected, and sometimes, even the best research can lead to the wrong conclusions. Therefore, any additional assistance you can obtain outside of the box may increase your trading edge. Looking at volume, market sentiment, fundamentals, seasonality, or cycles is one approach to accomplish this. There is disagreement over whether cycles are a necessary component of technical analysis. Cycles are a part of the technological world since they occur in price terms without considering fundamentals. Some technical analysts accept cycle theory wholeheartedly. Some people add additional signs to cycle theory. Others dismiss the idea as unrealistic or ineffective because it would require too much effort. A cycle theory is not necessary for you to become a proficient technical analyst. You are also free to disregard cycle theories completely if you want to do so. However, you need at least be aware that financial cycle theories exist. |
 For Videos Join Our Youtube Channel: Join Now
Feedback
- Send your Feedback to [email protected]
Help Others, Please Share


