| |

What Is a Two-Tailed Test? Definition and ExampleWhat is a Two-Tailed Test?A two-tailed test determines if a sample is more than or less than a specific range of values by using a two-sided critical area of distribution. It is used in tests for statistical significance and null hypothesis. If the sample under test lies in any of the critical areas/regions, the "alternative hypothesis" is accepted in place of the "null hypothesis". Given a population parameter, a two-tailed test is used to assess if a claim is true or false, and it analyzes both tails of a given data range as defined by the probability distribution. As a result, the probability distribution should depict the likelihood of a given occurrence based on established criteria. 
Understanding a Two-Tailed TestHypothesis testing is a fundamental idea in inferential statistics, and it assesses if a claim is true or false in light of a population parameter. "Two-tailed test" is a hypothesis test intended to demonstrate whether the sample mean is significantly more (or less) than the population mean. It tests the region/area under both sides of a normal distribution, though it can also be applied to different non-normal distributions. A two-tailed test is intended to analyze both sides of a given data range, as defined by the probability distribution. According to preset criteria, the probability distribution should depict the likelihood of a certain result; in order to achieve this, a limit must be defined indicating the highest (or higher) and lowest (or lower) allowed variable values contained within the range. Any data point outside of the acceptable range, also known as the rejection range, is one that is found either above or below the upper (or lower) limits. The number of data points required to be present within the acceptability range typically has no inherent criterion. A rejection rate of 0.001% or below may be implemented in situations when accuracy/precision is necessary, like when developing pharmaceutical medications. A rejection rate of 5% could be acceptable in circumstances where accuracy is not as important, such as when determining the quantity of food in a product bag. A two-tailed test can also be utilized practically during specific manufacturing tasks inside a company, for example, when candy is made and packaged at a specific facility. Any bag found to have less than 45 or more than 55 candies is regarded as falling beyond the permitted distribution range (or rejection range) if the production facility sets a goal of 50 candies per bag. Random sampling may be used to validate that the packing mechanisms are calibrated correctly to achieve the desired output/production. Likewise, each participant in a basic random sample of the population has an equal chance of being chosen. The sample often includes a small, random percentage of the total population to represent the complete data set. As discussed in an example, the packing techniques need to contain, on average, 50 candies per bag with the right distribution for them to be regarded as accurate. In addition, the quantity of bags falling within the rejection range must be less than the probability distribution limit, which is regarded as an acceptable error rate. Therefore, in this situation, the "null hypothesis" in this case is that the mean is 50, and the "alternate hypothesis" is that it isn't 50. The facility or related equipment may need to be changed in order to make the necessary corrections if, after performing the "two-tailed test", the "z-score" is in the rejection region, indicating that the variation is too far from the expected mean. Long-term production control can be established by routinely employing two-tailed testing techniques. A "Z-score", which is expressed in terms of the number of "standard deviations" from the "mean", quantifies the relationship between a value and the mean of a set of values. When a data point has a Z-score of 0, it means that it has the same score as the mean, while Z-scores of 1.0 and -1.0 would suggest values that are one standard deviation above or below the mean, respectively. Two-Tailed Test vs. One-Tailed Test"One-tailed test" is used when a hypothesis test is designed to demonstrate that the sample mean would be greater (or less) than the population mean, whereas a "two-tailed test" is intended to look at both tails/sides of a defined data range to determine whether a sample is higher (or less) than the range of values. The one-tailed test examines the region under one of the sides (or tails) of a normal distribution. When doing a "one-tailed test", an analyst disregards the likelihood of a relationship in the other direction while testing for the likelihood of a relationship in the direction of interest. The "alternative hypothesis" will be taken instead of the null hypothesis if the sample under test falls into the one-sided critical region. The "directional test" and "directional hypothesis" are other names for a "one-tailed test". Example of a Two-Tailed TestConsider the hypothetical instance where XYZ, a new stockbroker, says that their brokerage fees are cheaper than those of ABC, the present stockbroker. According to data from a research agency, the "mean" and "standard deviation" of all ABC broker customers are $18 and $6, respectively. The new XYZ broker rates are used to determine brokerage fees for a sample of 100 ABC clients/ customers. Can anything be concluded regarding the difference in the typical brokerage bill between brokers ABC and XYZ if the sample mean is $18.75 and the sample standard deviation is $6? In this instance, we get the following calculations:
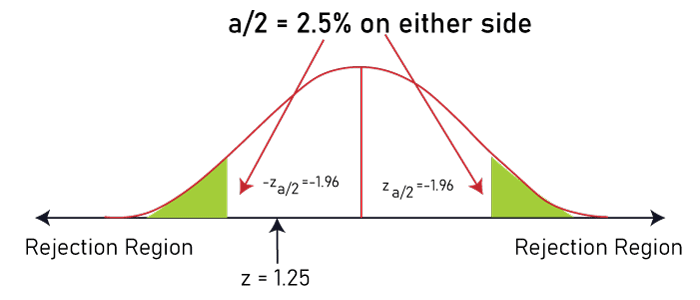
This means that there isn't enough information to draw any conclusions about a possible variation in rates between the current broker and the new broker; thus, the "null hypothesis" can't be rejected. Alternatively, the p-value = P(Z< -1.25)+P(Z >1.25) = 2 * 0.1056 = 0.2112 = 21.12%, which is more than 0.05 or 5%, results in the same conclusion. |
 For Videos Join Our Youtube Channel: Join Now
Feedback
- Send your Feedback to [email protected]
Help Others, Please Share


