| |

Linear GraphIndicating the link between two or more quantities with the aid of a graphical form of representation is what we do. A graph is referred to as linear if it only yields a single line from all the relationships it includes. Linear refers to a completely straight path. The linear graph is typically illustrated with the aid of a straight line. So a linear graph is a straight-line graph made on a plane and connected by points displayed on x and y coordinates. A Linear Graph's DefinitionAn illustration of the linear relationship between two quantities is a two-variable linear equation displayed as a linear graph. A straight line is represented graphically by a linear graph. An opportunity to work for $15 per hour was presented to James. He spends about $50 every day on average. To save money, he wants to know the least hours he should work daily. Let's examine the solution provided by a linear graph to this issue. A linear equation is obtained if time is represented by t and income by me. I =15t The linear graph above shows that the value on the vertical axis is more than his $50 investment. James should work a minimum of the number of hours shown on the horizontal axis to have some money set aside each day. If he works 5 hours each day, as indicated by the graph, he may manage his earnings up to $ 75 ($15 x 5 hours = $ 75) and have savings of $ (75 - 50) $25. 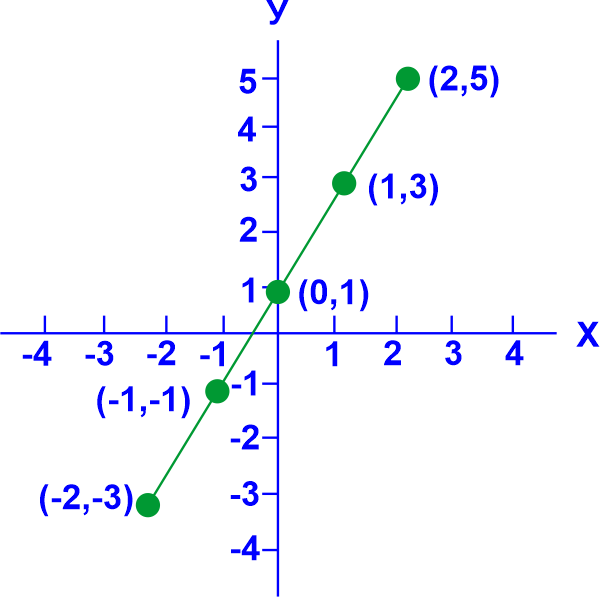
Comparing Linear and Line GraphsLet's use an illustration to grasp better the distinction between a line graph and a linear one. Can you see how B differs from A in the figure mentioned above? Here, A is a linear graph, and B is a line graph. Even though they are made up of line segments, they differ significantly. The figure created after combining the line segments shows the difference. In a linear graph, every point is collinear, and as a result, every point lies on a line. They might or might not be collinear in the case of a line graph. Different Components of a Linear GraphY-axis: The axis typically displays a measurement in the Y-axis, which runs vertically. If you want to count objects like boxes and ice creams, all the measures in this segment need to be identical in distance. X-axis: The X-axis is located on the horizontal line and displays information that has to be analyzed, such as common names, locations, and dates. As an illustration, luncheon, playtime, etc. 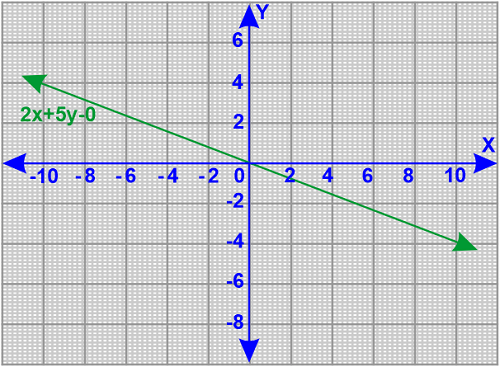
Linear Graph EquationA graphic depiction of a linear equation is what is meant by a linear graph. The linear equation, Ax + By = C, can be expressed below. The real numbers in this situation are denoted by A, B, and C, and they must not be zero. Consider this: On a graph that is described as follows, we may show the linear equation 2x + 5y = 0 in the following way: Properties of Linear Graph Equations
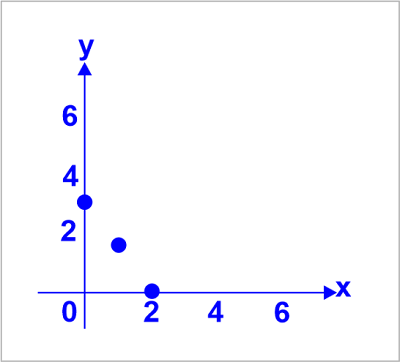
The graphing of a linear equationStep 1: Calculate the value of y concerning x using the aforementioned linear equation. Step 2: In a table, present these values. Step 3: Construct a graph and place the data points from the table. Step 4: Then, connect the points to form a straight line. What Sets a Linear Graph Apart from a Line Graph?The two photos are very different, as can be seen by comparing them. Linear and linear graphs are shown in A and B, respectively. Even though each of these graphs is made of line segments, there is a distinction between them. The figure displays the difference after the results' incorporation into a series of line segments. Since every point in this graph is collinear and lies on a line, a line graph may or may not have this property. The ConclusionGraphs can help pupils learn and comprehend various concepts without becoming perplexed. We studied the application of linear graphs in this lecture. A line and a linear graph are quite different and can depict various activities.
Next TopicParabola Graph
|
 For Videos Join Our Youtube Channel: Join Now
Feedback
- Send your Feedback to [email protected]
Help Others, Please Share


