| |

ModeThe mode in math is also a measure of central tendency. In this section, we will try to understand the definition of mode, how to find mode, and examples of mode. Mode DefinitionThe mode can be defined as the number that occurs most often. In other words, a number that appears most often in a set. A number that has the highest frequency (repetition of a number) among the numbers, is called mode. If there is no repeated number in the list or observations, there is no mode for the list. How to Find ModeTo find the mode or mode value is very easy. We can follow the steps below to find the mode:
Note: There may be more than one mode for a set.
Mode of Grouped DataThe mode may not be useful when all the numbers have the same frequency. We can find mode of grouped data by using the following two methods:
Quick MethodIt is the quick and easy method to find the mode of grouped data. In this method, we group the values, to see which group has more numbers than other groups. The group that has more numbers than others, contains the mode. The middle value of that group can be chosen as a mode. The method does not give the exact mode value. We will understand this concept at the last of this section, through an example. Using FormulaIn a grouped frequency distribution, it is not possible to determine the mode by looking at the frequencies. Here, we can locate a class with the maximum frequency, called model class. We can use the following formula to find the mode of the grouped data. 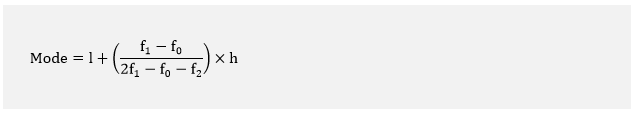
Where, l: The lower limit of the model class. f0: The frequency of the class preceding (before) the model class. f1: The frequency of the model class. f2: The frequency of the class succeeding (after) the model class. h: The size of the class interval. Let's understand what are these variables in the grouped data, through the following example. 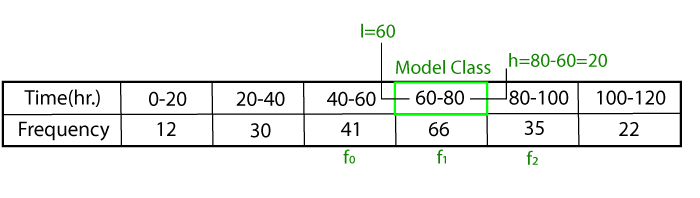
Note: The above formula gives the most accurate mode value of the grouped data.Properties of Mode
Mean - Mode = 3 [Mean - Median]
Let's see some examples. Example 1: A test was completed by 5 students. Calculate the mode? 3.7 hr., 5.3 hr., 2.5 hr., 4.1 hr., 1.9 hr. Solution: First, arrange the time in an order taken by the students. 1.9 hr., 2.5 hr., 3.7 hr., 4.1 hr., 5.3 hr. Count the frequency of each number, we get each number occurs only once. Hence, there is no mode for the given time. Example 2: The temperature of a city has been recorded in Celsius on different days. Find the mode of the temperature. -5, 0, -3, 4, -12, 0, 5, 1, 0 Solution: First, arrange the time in an order taken by the students. -12, -5, -3, 0, 0, 0, 1, 4, 5 Count the frequency of each number. We see that the temperature 0 appears three times. Hence, the mode is 0. Note: Do not confuse between no mode and 0 mode. Both are different, as we have shown in the above two examples.Example 3: Find the mode of the following list: 12, 34, 56, 12, 22, 90, 75, 12, 45, 55 Solution: First, arrange the above list in an order. 12, 12, 12, 22, 34, 45, 55, 56, 75, 90 Count the frequency of each number. We see that the number 12 occurs three times and the other numbers occurs once. Hence, the mode of the given list is 12. Example 4: In the following list, the observations of a test is given. Find the mode of the observations. 32, 6, 96, 6, 23, 120, 45, 12, 45, 6, 12, 7, 3, 12 Solution: First, arrange the above list in an order. 3, 6, 6, 6, 7, 12, 12, 12, 23, 32, 45, 45, 96, 120 Count the frequency of each number. We see that the numbers 6 and 12 occurs three times and the rest numbers appears only once. So, the list is bimodal. Hence, the mode of the given observations is 6 and 12. Example 5: Find the mode of the given list: 99, 76, 45, 55, 23, 45, 55, 12, 2, 55, 12, 44, 88, 12, 2, 6, 2 Solution: First, arrange the above list in an order. 2, 2, 2, 6, 12, 12, 12, 23, 44, 45, 45, 55, 55, 55, 76, 88, 99 Count the frequency of each number. In the above list, three numbers 2, 12, and 55 appears three-times and the rest numbers appear only once. So, the list is trimodal. Hence, the mode of the given list is 2, 12, and 55. Example 6: Calculate the mode of the given series: 4, 9, 10, 20, 22, 25, 27, 31, 44, 42, 15, 2 Solution: In the above series, each number occurs once. So, let's group (interval of 10) them.
The interval 20-29 contain four numbers, so the frequency of this group is 4 which is the highest frequency among other groups. From the interval 20-29, we will choose 25 (mid value of the group) as a mode. It is approximate mode of the data. Example 7: Consider the grouped data given below and find the mode.
Solution: In the above data, we can see that the interval 60-80 (model class) has the highest frequency among others. The formula that we have learned above is: 
l = 60 h = 80 - 60 = 20 f0 = 41 f1 = 66 f2 = 35 Putting the values in the above formula, we get: 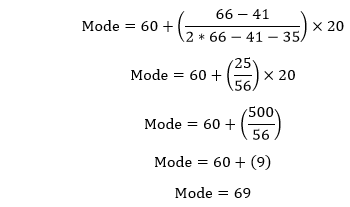
The mode of the grouped data is 69.
Next TopicProduct in Math
|
 For Videos Join Our Youtube Channel: Join Now
Feedback
- Send your Feedback to [email protected]
Help Others, Please Share


