| |

Venn DiagramIn mathematics, the Venn diagram is a diagram that represents the relationship between two or more sets. It was suggested by John Venn. He represented the relationship between different groups of things in the pictorial form that is known as a Venn diagram. In this section, we will learn that what is the Venn diagram, its types, purpose, uses, representation of it with proper example. Before moving to the Venn diagram, let's have a quick view of the set. A set is a collection or group of things. It may contain digits, vowels, animals, prime numbers, etc. A set is denoted by the capital letter and the elements of the set are denoted by the lowercase letters. All the elements of a set enclose in the pair of curly braces {}. For example, E is a set that denotes even numbers less than 10. We can represent it in the form of set, as follows: E={2,4,6,8} Where E is the set name and 2, 4, 6, 8 are the elements of the set. We can also represent a set-in pictorial form that is known as Venn diagram. What is the Venn diagram?A diagram or figure that represents the mathematical logic or relation between a finite collection of different sets (a group of things) is called the Venn diagram. It is used to illustrate the set relationship. We usually use a circle or oval to represent a Venn diagram. It may have more than one circle; each represents a set. Suppose there are two sets A and B having the elements {1, 2, 3} and {8, 5, 9}, respectively. We can represent these two sets in the Venn diagram, as shown below. 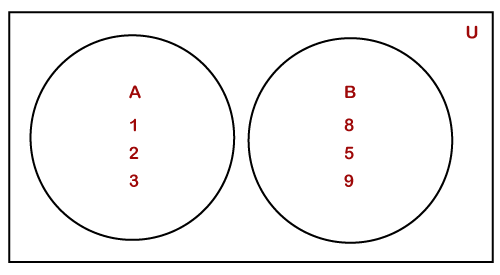
Advantages of Venn Diagram
Uses of Venn DiagramVenn diagram is used in mathematics to understand the set theory. We also use it to understand the relationship between or among sets of objects. It depicts the set of intersections and unions. How to Draw a Venn Diagram
Suppose there are two sets, A and B, having some elements in common. The Venn diagram of the sets can be drawn as follows: 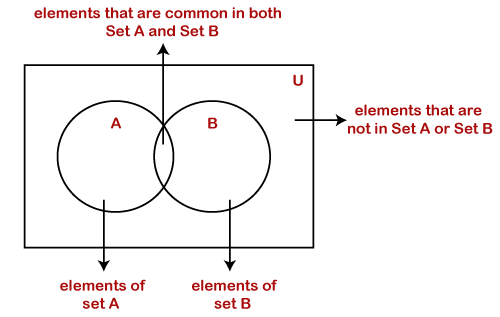
Types of Venn DiagramThere are following types of Venn diagram:
Two-Set Diagrams: When two sets overlap each other is called two-set diagrams. In the following diagram, there are two sets, A and B, having the elements {a, e, i, o, u} and {a, b, c, d, e, f, g}, respectively. There are two common elements in both sets, i.e., {a, e}. Let's represents this relationship in the Venn diagram. 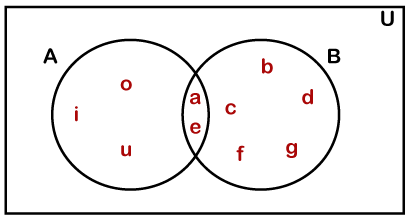
Two-Set Euler Diagrams: When two sets do not overlap each other is called two-set Euler diagrams. In the following diagram, there are two sets, A and B, having the elements {mango, apple, banana, guava, grapes} and {potato, chilly, ginger, tomato, carrot, radish}, respectively. Set A represents the set of fruits and set B represents the set of vegetables. Vegetables and fruits do not match each other, so there are no common elements in the set. Let's represents these two sets in the Venn diagram. 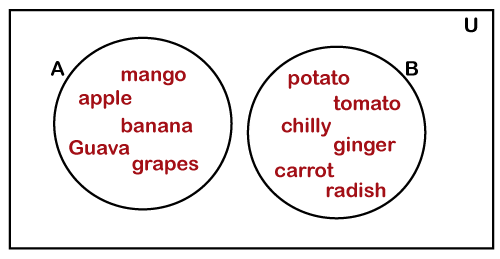
If a set is completely encompassing the other set, it is both the Euler diagram and the Venn diagram. Suppose a set A represents the set of animals and set B represents the set of carnivorous animals. It is clear that all the animals cannot be carnivorous, but vice-versa is true. Therefore, all the carnivorous animals also present in the set of animals, i.e., A. We can represent it in the Venn diagram, as follows. 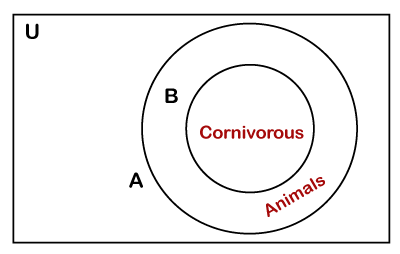
Three-Set Diagrams: When three sets overlap, each other is called three-set diagrams. In the following diagram, there are three sets A, B, and C having the elements {Andrew, Peter, Sam, Tom, David}, {Michael, Sam, Tom, Robert, Jack, Smith}, and {David, Maria, Tom, Angelina, Michael}, respectively. Set A, B, and C represents the name of students who learn physics, chemistry, and math, respectively. In the above sets, some students learn only one subject, some students learn tow subjects, and some students learn all three subjects.
Therefore, we can represent it in the Venn diagram, as shown below. 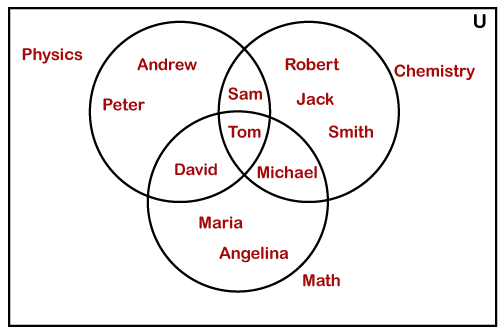
Three-Set Euler Diagram: In the three-set diagram, when a set does not overlap the other two sets is called a three-set Euler diagram. Suppose, the set A represents the set of vowels {a, e, i, o, u}, set B represents the set of alphabets {a, b, c, d, e, f, g}, and set C represents the set of Greek letters {ρ,ω,φ,θ,ϵ}. We can represent it in the Venn diagram, as follows. 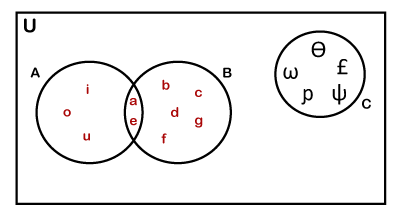
The three-set Euler diagram can have a nested set. In the following diagram, the pink things set may contain a set of light-pink things. 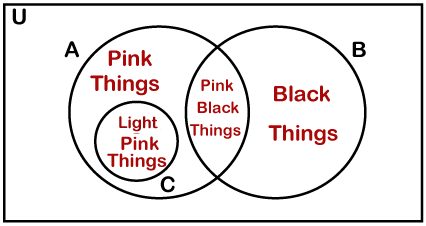
The above diagram is not a Venn diagram because two sets do not overlap (Black Things & light-pink Things) each other. Four-Set Diagram: We use an oval shape to represent the four-set diagram because the circle no longer overlaps each other. The oval shape ensures that all sets overlap each other. It is the only option to represent the four-set diagram. 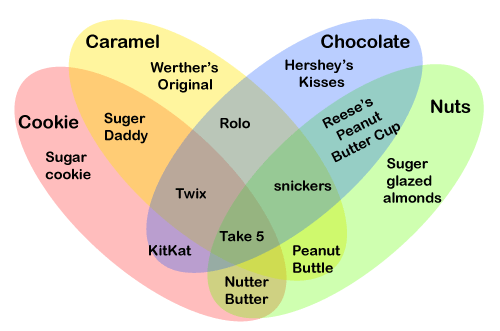
We also use a three-set diagram with a curve to represent the four-set diagram. When a four-set diagram that uses circles will also be a Euler diagram, the circle would not show the union between every pair of sets. 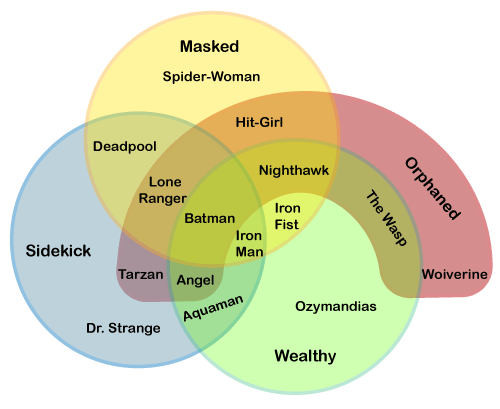
Before moving to example, let's have a quick view of the symbols used in set theory.
Let's solve some examples based on the Venn diagram. Example 1: In an office, 200 employees are randomly selected for a survey. Out of 200 employees, 140 like tea, 120 like green tea, and 80 like both tea and green tea. On the basis of the data given in the question-answer, the following questions.
Solution: we can represent the given information by the following Venn diagram, where T denotes the tea, and G denotes the Green tea. 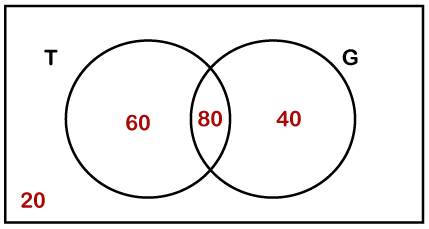
Example 2: In a survey of 500 students of a school, the team observed that:
On the basis of the above data, answer the following questions.
Solution: n(F) = students who like to play football = 49% Since, 5% like to play none of the given games so, n (F ∪ H ∪ B) = 95%. Now applying the basic formula,
95% = 49% + 53% + 62% -27% - 29% - 28% + n (F ∩ H ∩ B)
Solving, we get n (F ∩ H ∩ B) = 15%. Now, we will draw the Venn diagram based on the information that we have calculated. Remember that all the values in the diagram are in percentages. 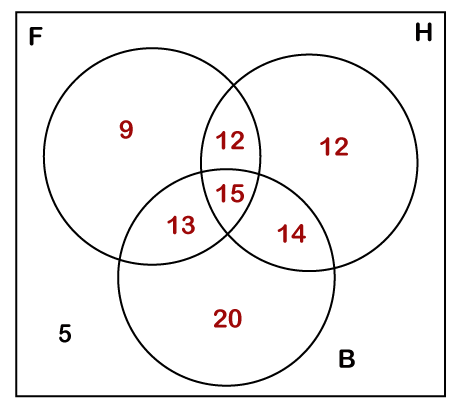
Next TopicCompound Interest
|
 For Videos Join Our Youtube Channel: Join Now
Feedback
- Send your Feedback to [email protected]
Help Others, Please Share


