| |

Bandpass Filters in MATLABIntroductionAn electronic circuit or signal processing system called a bandpass filter is made to attenuate frequencies outside of a designated range while permitting a certain range of frequencies to pass through. In essence, it functions as a frequency gate, rejecting or attenuating signals outside of a specified bandwidth while permitting signals inside that range to pass.
Frequency Spectrum and Signal ProcessingUnderstanding the frequency spectrum of a signal is fundamental to appreciating the role of bandpass filters. The frequency spectrum represents how the amplitude of a signal varies with different frequencies. For instance, in audio processing, the frequency spectrum of a music signal shows the distribution of energy across different musical notes. Bandpass filters are designed to work within this frequency spectrum, allowing engineers to focus on specific frequency bands and manipulate signals accordingly. This capability is crucial in applications such as wireless communication, where different frequency bands are allocated for different services to avoid interference. Types of Bandpass FiltersActive Bandpass filtersActive bandpass filters obtain their frequency-selective properties by means of active components such as operational amplifiers. When a gain is needed in addition to frequency selection, these filters are frequently chosen. In communication systems, instrumentation, and audio processing, active bandpass filters are frequently utilized. Passive Bandpass filtersOn the other hand, passive bandpass filters are made of passive parts like resistors, capacitors, and inductors and don't need a power supply. They are frequently utilized in radio frequency (RF) circuits and find value in basic filtering jobs. Digital Bandpass FiltersDigital bandpass filters gained popularity after digital signal processing was introduced. These filters provide benefits including flexibility, simplicity of use, and integration with digital communication systems. They work on digital representations of signals. Program: Output: 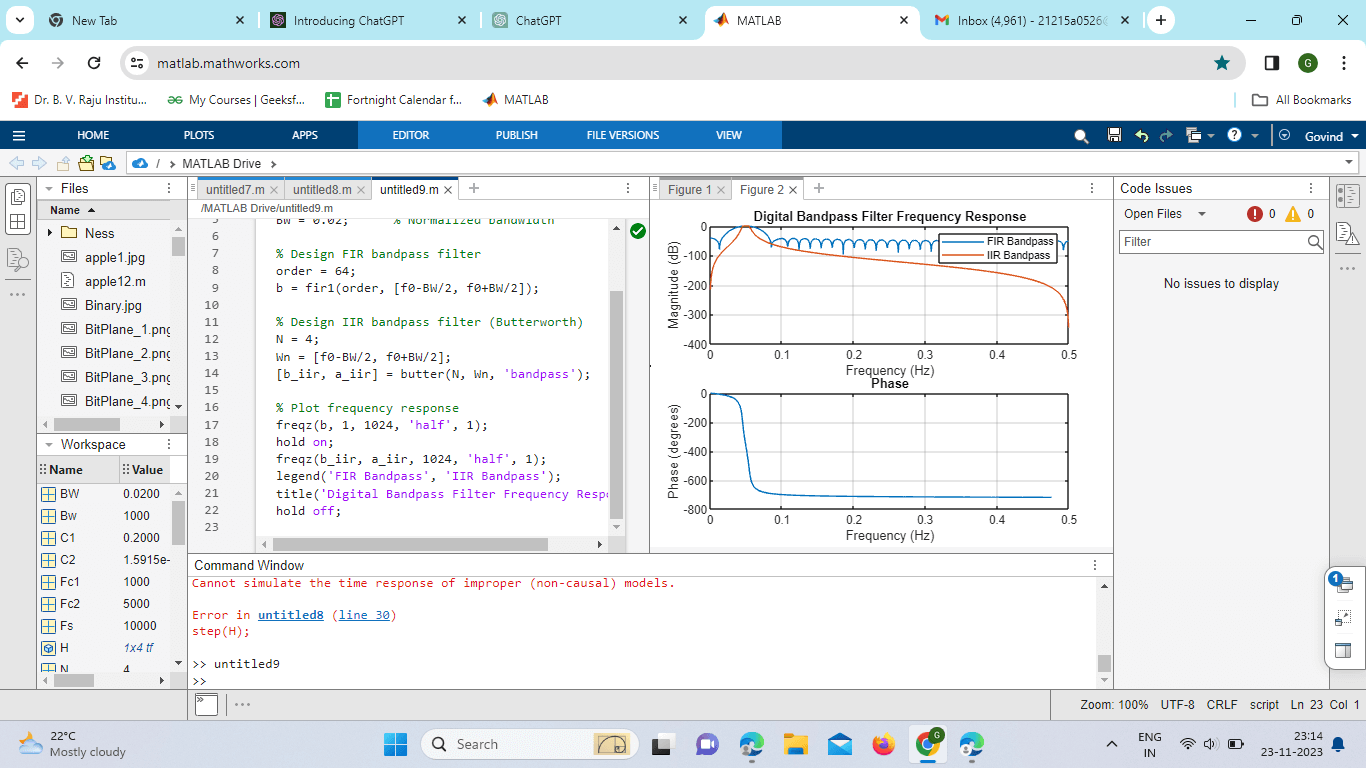
Explanation: Normalized Center Frequency and Bandwidth: f0 represents the normalized center frequency of the bandpass filter. BW represents the normalized bandwidth of the bandpass filter. FIR Bandpass Filter Design: Order specifies the order of the FIR filter. fir1 designs a bandpass FIR filter using a Hamming window with the specified order and frequency range. IIR Bandpass Filter Design (Butterworth): N specifies the order of the Butterworth filter. Wn defines the normalized frequency range for the bandpass filter. Butter designs a bandpass Butterworth filter with the specified order and frequency range. Plotting the Frequency Response: freqz is used to plot the frequency response of the filters. 1024 is the number of points used for the frequency response plot. 'half' specifies that only the positive frequencies are plotted. One indicates the sampling frequency, which is normalized in this case. Hold on to ensure that both FIR and IIR filter responses are plotted on the same figure. Legend and Title: Legend adds a legend to the plot to distinguish between FIR and IIR filters. The title sets the title of the plot. Hold off: Hold-off is used to reset the plot hold state to off so subsequent plots will overwrite the current plot. Key Characteristics of Bandpass FiltersCenter Frequency The midpoint of the frequency range that a bandpass filter permits to pass through is known as the center frequency. It is a crucial factor in identifying the precise interest band for a certain application. Bandwidth The range of frequencies between the lower and upper cutoff frequencies is known as a bandpass filter's bandwidth. It shows how wide the frequency range is that the filter lets through without noticeably attenuating the signal. Q-Factor (Quality Factor) The sharpness of the frequency response of the bandpass filter is gauged by the Q-factor. It is the bandwidth divided by the central frequency. Sharper frequency response and a smaller bandwidth are indicated by a greater Q-factor. Design MethodologiesButterworth Bandpass Filter The Butterworth filter is renowned for having a passband frequency response that is as flat as possible. It is a well-liked option for uses like audio processing when a flat response is preferred. Chebyshev Bandpass Filter A sharper roll-off in the transition between the passband and the stopband is possible with the Chebyshev filter. There are two varieties available: Type I features a ripple in the passband, while Type II has a ripple in the stopband. Elliptic Bandpass Filter A middle ground between the properties of the Butterworth and Chebyshev filters is offered by the elliptic filter, sometimes referred to as the Cauer filter. It has an equal ripple in the passband and stopband and permits a quick roll-off. FIR Bandpass Filter The linear phase response of finite impulse response (FIR) filters is one of their distinguishing features.FIR bandpass filters are frequently employed in image processing and other fields where phase linearity is essential. MATLAB Functions for Bandpass Filter DesignMATLAB's butter function is frequently used to create Butterworth filters. It offers a practical means of implementing these filters by accepting parameters like cutoff frequencies and filter order. Chebyshev Filters: cheby1 and cheby2 Type I and Type II Chebyshev filters are designed using the cheby1 and cheby2 functionsrespectively.The desired filter properties can be achieved by engineers by specifying parameters like ripple and attenuation. For Elliptic Filters, Ellip With parameters that allow control over the passband ripple, stopband attenuation, and other crucial features, elliptic filters can be designed thanks to the ellipse function. FIR Filters: fir1 Bandpass filters and other finite impulse response filters are designed using the fir1 function. To customize the filter's response to their needs, engineers can define the cutoff frequencies and filter order. Filter Specifications and RequirementsOrder of the Filter The order of a filter is a crucial parameter that determines the complexity of the filter design. Higher-order filters can provide steeper roll-offs but may introduce more phase distortion. Ripple and Attenuation Ripple refers to the variation in amplitude within the passband or stopband of a filter. Attenuation is the reduction in signal amplitude in the stopband. Engineers must balance these factors based on the specific requirements of their application. Transition Width The transition width is the frequency range between the passband and stopband. A smaller transition width indicates a sharper transition between the allowed and rejected frequencies. Filter Design and Analysis in MATLABDesigning a Bandpass Filter Using MATLAB, engineers can design bandpass filters by selecting the appropriate design function (e.g., butter, cheby1, ellip, fir1) and specifying the required parameters such as filter order, center frequency, and bandwidth. Frequency Response Analysis MATLAB provides tools for analyzing the frequency response of bandpass filters, including functions like freqz to visualize the filter's magnitude and phase response. Pole-Zero Analysis Understanding the poles and zeros of a filter is essential for analyzing its stability and behavior. MATLAB's pump function allows engineers to visualize the distribution of poles and zeros in the complex plane. Audio Signal Filtering Bandpass filters are widely used in audio processing to isolate specific frequency bands, such as filtering out noise or emphasizing certain musical tones. MATLAB can be employed to design and implement bandpass filters for audio applications. Implementation:Output: 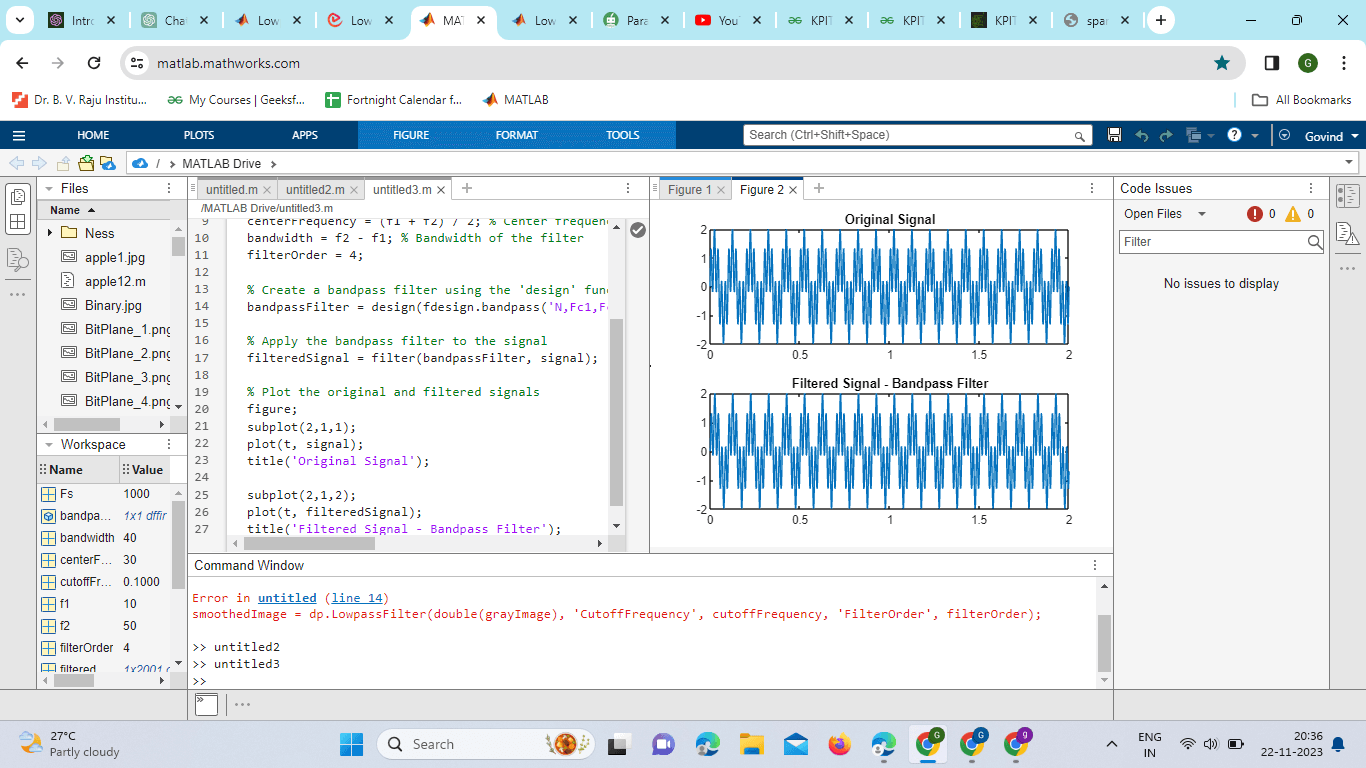
Explanation: Sample Signal Generation: A sample signal is generated, which is a sum of two sinusoids with frequencies f1 and f2. Bandpass Filter Design: The center frequency (center frequency) is calculated as the average of f1 and f2. The bandwidth (bandwidth) is the difference between f2 and f1. The filter order (filter order) determines the complexity of the filter. The design function is used to create a bandpass filter using the specified parameters. Apply the Bandpass Filter: The filter function is used to apply the bandpass filter to the original signal. Program: Output: 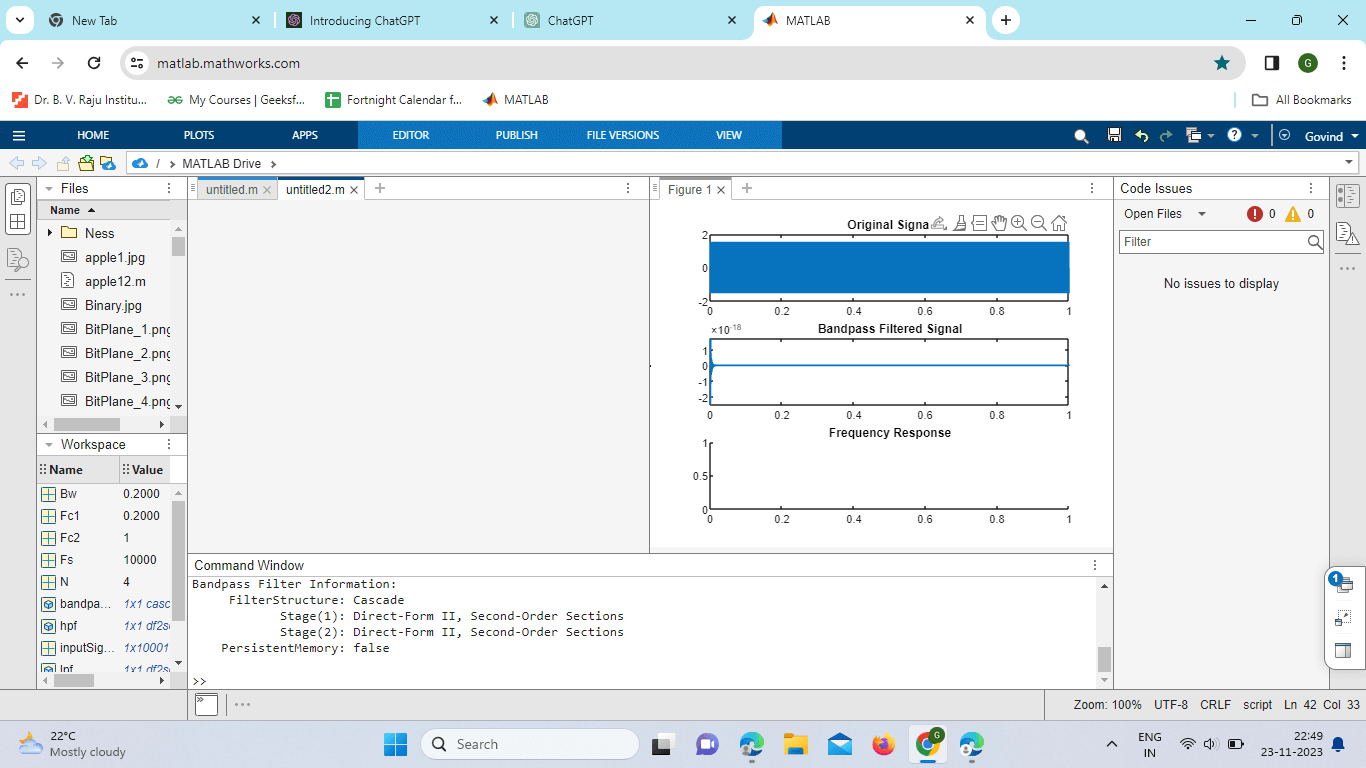
Explanation: These parameters define the specifications of the bandpass filter. Fc1 and Fc2 are the low-pass and high-pass cutoff frequencies, respectively. Bw is the bandwidth, and N is the filter order. Normalize Frequencies: The frequencies are normalized by dividing them by half of the sampling frequency (Fs/2). This step is essential because the filter design functions expect normalized frequencies in the range of 0 to 1. Design Low-pass and High-pass Filters: Two filters are designed separately: a low-pass filter (lpf) and a high-pass filter (hpf). The design is based on Chebyshev Type I filter characteristics. Combine Filters: The low-pass and high-pass filters are combined into a bandpass filter using the default. Cascade function. Generate and Filter a Sample Signal: A sample signal is generated, which is the sum of two sine waves with frequencies of 2000 Hz and 6000 Hz. The bandpass filter (bandpass filter) is then applied to filter the input signal. Plotting and Displaying: The results are visualized through a series of plots. The first subplot displays the original signal, the second subplot displays the signal after applying the bandpass filter, and the third subplot shows the frequency response of the filter. Additionally, information about the designed bandpass filter is displayed in the command window. Advantages:Frequency Selectivity: Bandpass filters allow specific frequency components within a certain range to pass through while attenuating frequencies outside this range. This is useful for isolating signals of interest in a particular frequency band. Signal Enhancement: They can be used to enhance specific features or components within a signal by isolating the relevant frequency band. Noise Reduction: By selectively allowing only a certain frequency range to pass through, bandpass filters can help in reducing unwanted noise or interference outside the band of interest. Applications in Communication Systems: Bandpass filters are crucial in communication systems for tasks such as channel selection and frequency modulation/demodulation. Versatility: MATLAB provides a variety of functions and tools for designing and implementing bandpass filters, allowing for flexibility in filter type, order, and response characteristics. Disadvantages:Phase Distortion: Depending on the filter design, bandpass filters can introduce phase distortion to the filtered signal. This distortion might affect the timing relationships within the signal. Group Delay: Bandpass filters may exhibit non-linear phase characteristics, leading to variations in group delay across the frequency spectrum. This can be a concern in applications where precise timing is critical. Complexity: Higher-order bandpass filters can be computationally expensive and may require more resources compared to simpler filters. This can be a concern in real-time applications or systems with limited processing power. Design Challenges: Designing an optimal bandpass filter requires careful consideration of specifications such as bandwidth, center frequency, and filter order. Selecting inappropriate parameters might lead to suboptimal performance. Transition Band Issues: In certain filter designs, there can be challenges in achieving a sharp transition between the passband and stopband without sacrificing other filter characteristics. Sensitivity to Parameter Variations: Some filter designs, especially those with narrow bandwidths or higher orders, can be sensitive to variations in component values, making them more challenging to implement accurately.
Next TopicF-Zero in MATLAB
|
 For Videos Join Our Youtube Channel: Join Now
Feedback
- Send your Feedback to [email protected]
Help Others, Please Share


