| |

MATLAB Plot MarkersIntroductionIn the realm of data visualization using MATLAB, plot markers serve as essential elements for enhancing the clarity and interpretability of plots. Whether you are dealing with scatter plots, line plots, or other graphical representations, markers play a pivotal role in highlighting individual data points and conveying specific information to the viewer. This introduction provides an overview of MATLAB plot markers, their significance, and the fundamental concepts surrounding their usage. What are Plot Markers?Plot markers are symbols or glyphs used in data visualization to represent individual data points on a graph or plot. They play a crucial role in making the data visually accessible, allowing viewers to identify and interpret specific values within a dataset. In MATLAB, a popular programming environment for numerical computing and data visualization, plot markers are widely employed in various types of plots, such as scatter plots, line plots, and more. Key Characteristics of Plot MarkersPlot markers are integral components of data visualization, serving as visual indicators of individual data points on a graph. Understanding their key characteristics is crucial for creating effective and informative plots. In this detailed exploration, we delve into the primary features that define plot markers and their role in enhancing the interpretability of visualized data. Symbolic Representation:
Positioning on the Plot:
Customization Options:
Multiple Marker Types in a Single Plot:
Use Cases of Plot Markers:
Basic Syntax in MATLAB:Function Usage: In MATLAB, the 'scatter' function is commonly used for creating plots with markers. Syntax: This example utilizes circular markers ('o') with specific sizes, fill colors, and edge colors. Understanding the Need for Plot Markers in Data VisualizationData visualization is a powerful tool for interpreting complex datasets and extracting meaningful insights. However, when dealing with a multitude of data points, the challenge arises in making individual data values discernible and understandable to the viewer. This is where the need for plot markers becomes evident. Plot markers are indispensable elements in data visualization, offering a visual shorthand to represent specific data points on a graph. Let's explore the reasons behind the crucial role of plot markers in enhancing the effectiveness of data visualization. Enhancing Individual Data Point Visibility: In plots with numerous data points, it can be challenging for viewers to distinguish individual values. Plot markers provide a visual representation at each data point, making it easier for the viewer to identify and focus on specific values within the dataset. Example: In a scatter plot, each marker corresponds to a distinct data point, allowing the viewer to visually connect the marker to a specific set of x and y coordinates. Highlighting Trends and Patterns: Understanding trends or patterns within a dataset may require identifying specific points of interest. By strategically placing markers along a plotted line or within a scatter plot, users can draw attention to crucial data points that contribute to observed trends. Example: In a line plot, markers can be used to highlight critical data points where the trend changes or exhibits significant behavior. Facilitating Categorical Data Representation: Representing categorical data without clear visual indicators can lead to confusion. Plot markers can serve as categorical symbols, allowing viewers to quickly associate a marker type with a specific category or group. Example: Different marker types representing different product categories in a sales dataset can aid in easily distinguishing between product types. Identifying Outliers and Anomalies: Detecting outliers or anomalies within a dataset is crucial for understanding data integrity. Plot markers can be employed to explicitly highlight data points that deviate significantly from the overall trend, making outliers more apparent. Example: In a scatter plot, an unusual data point can be marked with a distinct marker, signaling its potential importance. Improving Aesthetics and Interpretability: Aesthetic appeal and interpretability are essential for effective communication of data. Well-chosen and well-customized plot markers contribute to the overall visual appeal of a plot and aid in conveying the intended message. Example: Adjusting marker size, color, and transparency can make the plot visually engaging and guide the viewer's attention to specific data features. Enabling Multiple Dataset Differentiation: When dealing with multiple datasets within a single plot, differentiation is crucial. Different marker types or customization options can be applied to represent distinct datasets, making it clear which data points belong to each set. Example: Using circles for one dataset and squares for another in the same scatter plot helps viewers associate each marker with its respective dataset. Adding Context to Data Points: Understanding the context or significance of individual data points can be challenging without visual aids. Plot markers can be used to annotate or symbolize specific data points, providing additional context or information. Example: Placing a star-shaped marker on a data point that represents a critical event in a time series plot adds context to that particular data point. Types of Plot Markers in MATLABIn MATLAB, a versatile software tool for numerical computing and data visualization, a variety of plot markers are available to users. These markers allow for the visual representation of individual data points in different plot types. Let's explore some of the commonly used types of plot markers in MATLAB: Default Markers:MATLAB provides default circular markers when the marker type is not explicitly specified. Example: This code generates a scatter plot with default circular markers. Circle ('o'): Circular markers are commonly used for general-purpose scatter plots. Example: scatter(x, y, 'Marker', 'o'); Square ('s'): Square markers provide an alternative to circles and can be useful for categorical representation. Example: scatter(x, y, 'Marker', 's'); Triangle ('^' and 'v'): Upward ('^') and downward ('v') triangles can be employed to indicate directional trends. Example: scatter(x, y, 'Marker', '^'); % Upward triangle scatter(x, y, 'Marker', 'v'); % Downward triangle Cross ('+'): Cross markers are straightforward symbols for highlighting specific data points. Example: scatter(x, y, 'Marker', '+'); Asterisk ('*'): Asterisk markers offer a visually distinctive symbol for emphasis. Example: scatter(x, y, 'Marker', '*'); Point ('.'): Point markers represent data points with minimal visual impact, often used in dense datasets. Example: scatter(x, y, 'Marker', '.'); Diamond ('d'): Diamond markers provide a unique shape suitable for highlighting specific data points. Example: scatter(x, y, 'Marker', 'd'); Hexagram ('h'): Hexagram markers add a geometric variation to the available marker types. Example: scatter(x, y, 'Marker', 'h'); Pentagram ('p'): Pentagram markers offer another geometric shape for customization. Example: scatter(x, y, 'Marker', 'p'); Custom Marker Symbols:Users can define custom marker symbols using characters or symbols not covered by the default set. Example: Combining Marker Types:Multiple marker types can be used within the same plot for differentiation or emphasis. Example: Implementation:Output: 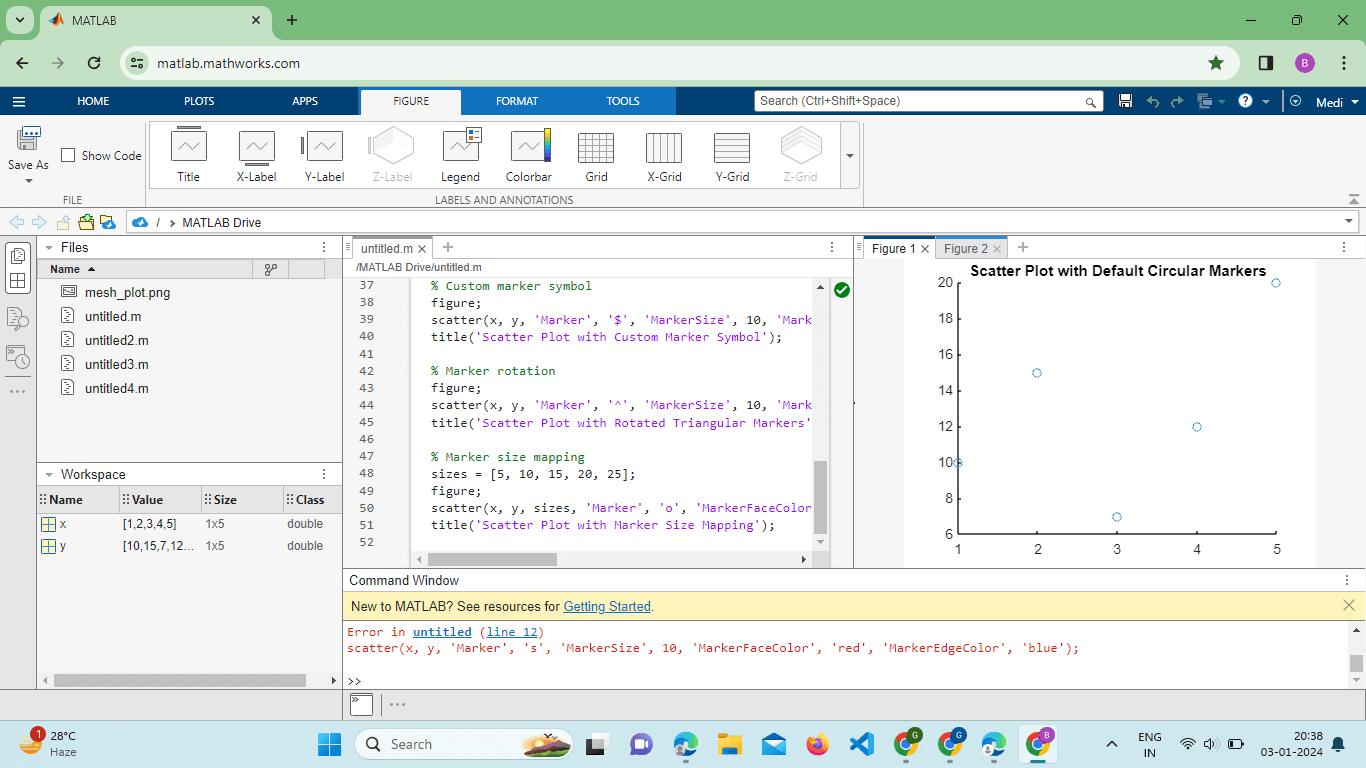
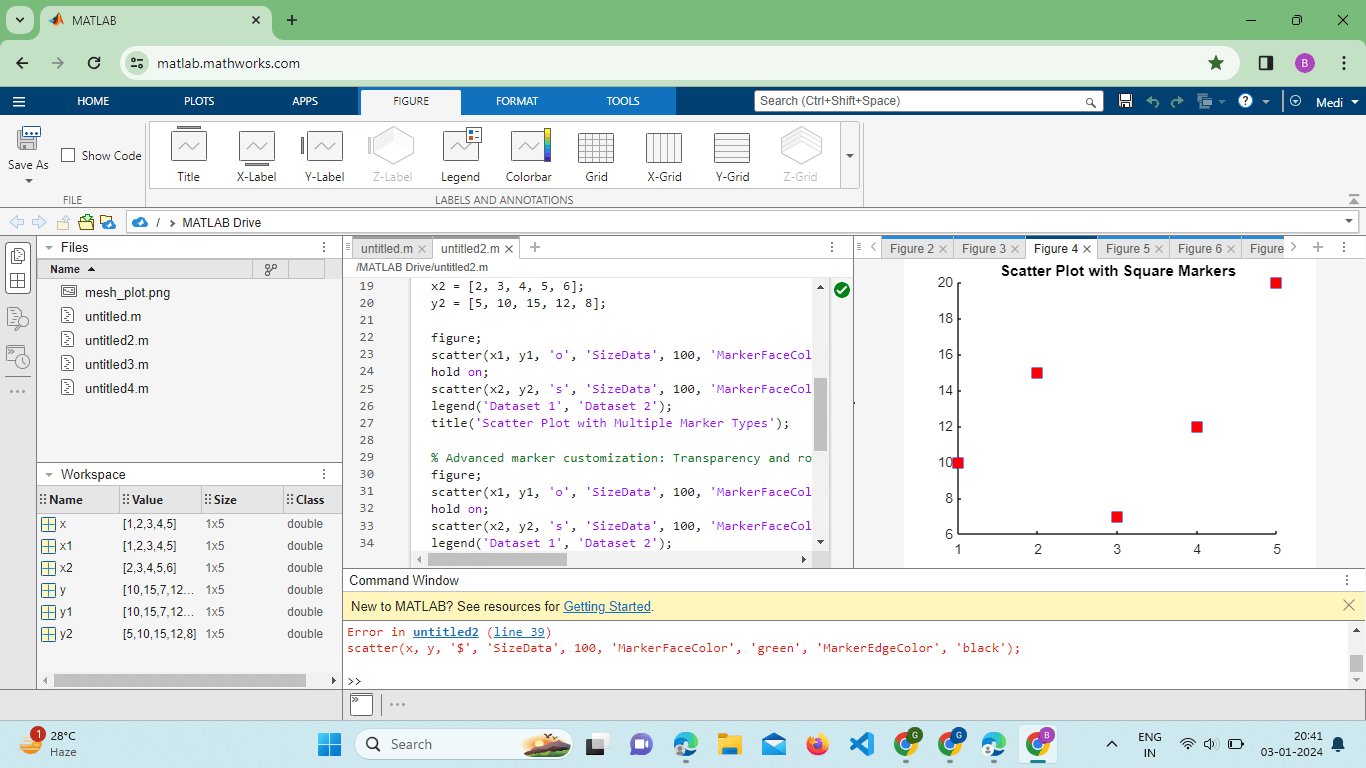
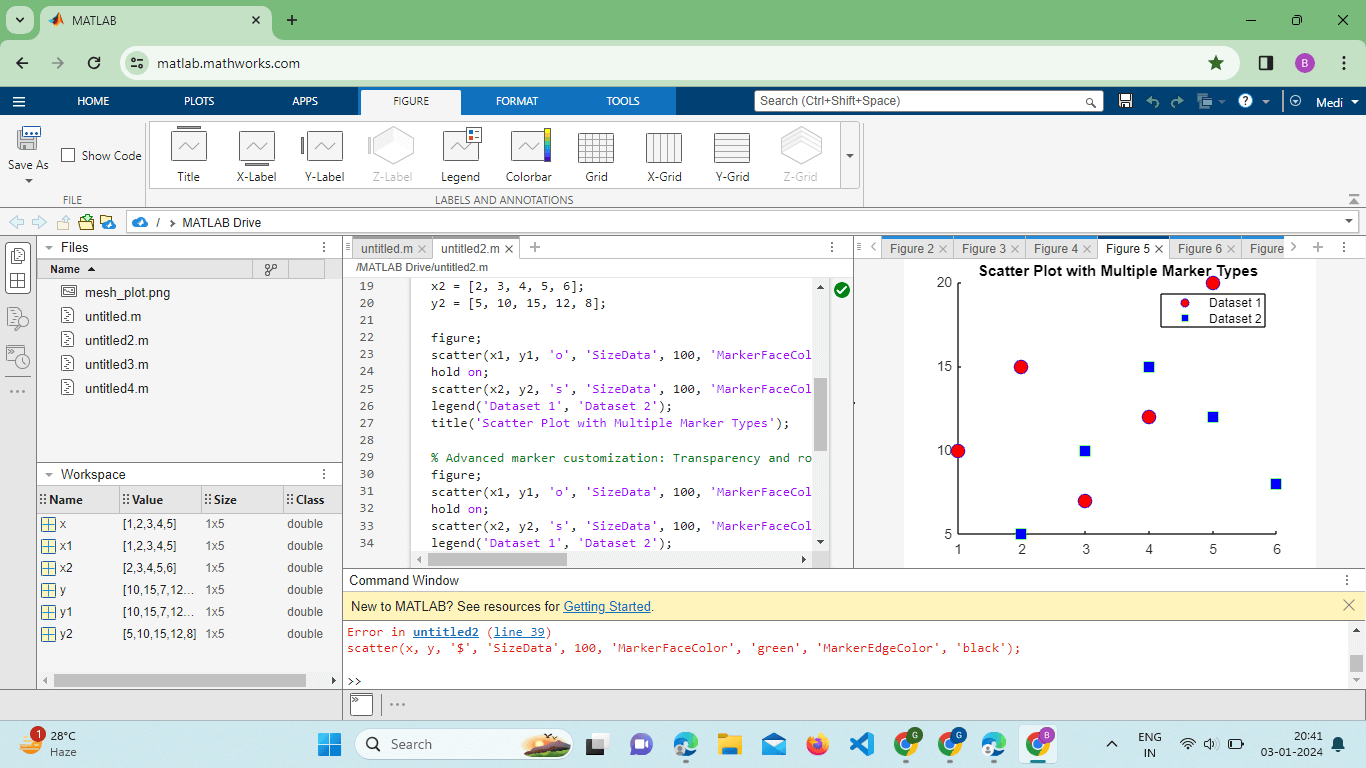
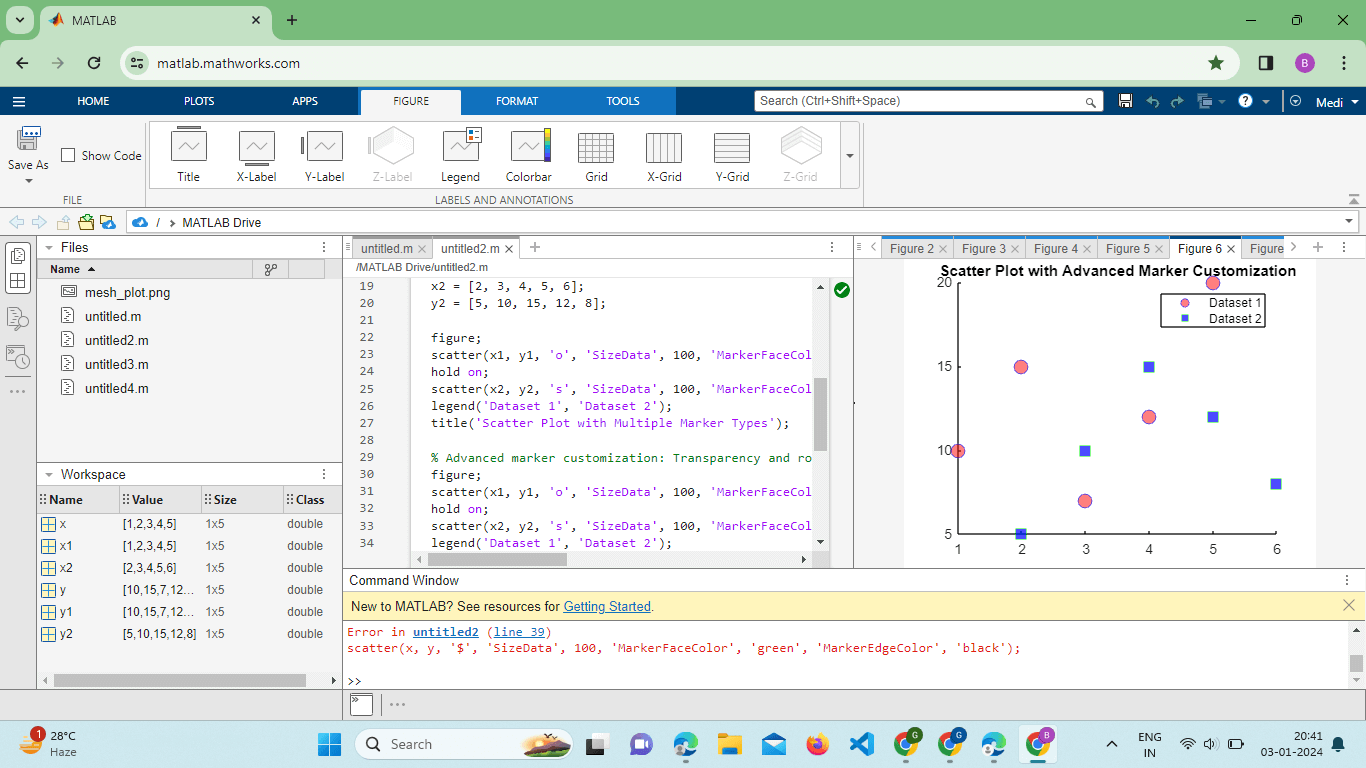
Explanation: Scatter Plot with Default Circular Markers: The initial plot serves as a baseline, using the default circular markers provided by the scatter function. This type of plot is commonly used for simple visualizations. Scatter Plot with Square Markers: The second plot introduces square markers ('s') with a specified size ('SizeData') of 100. The marker face color is set to red, and the marker edge color is set to blue, showcasing customization options beyond the default settings. Scatter Plot with Multiple Marker Types: The third plot demonstrates the ability to use different marker types for multiple datasets within the same figure. Circular markers ('o') represent Dataset 1, while square markers ('s') represent Dataset 2. The legend aids in distinguishing between the datasets. Scatter Plot with Advanced Marker Customization: The fourth plot showcases advanced customization, including transparency settings ('MarkerFaceAlpha' and 'MarkerEdgeAlpha') for both datasets. Varying transparency levels enhance visual distinction and highlight overlapping data points. Scatter Plot with Custom Marker Symbol: The fifth plot introduces a custom marker symbol ('$') with a specified size and color. This demonstrates the flexibility to use unique symbols for markers beyond the default setting. Scatter Plot with Rotated Triangular Markers: The sixth plot illustrates marker rotation using the 'MarkerAngle' property. Triangular markers ('^') are rotated by 45 degrees, offering an additional customization feature. Scatter Plot with Marker Size Mapping: The final plot introduces marker size mapping, where the sizes of markers are determined by the 'sizes' vector. The 'SizeData' property is utilized to represent an additional variable through marker sizes visually. Advanced Marker CustomizationAdvanced marker customization in MATLAB allows users to fine-tune the appearance of plot markers, providing more control over their size, color, transparency, rotation, and even the choice of custom symbols. This level of customization is particularly valuable when creating complex visualizations or when aiming for a specific aesthetic. Let's explore some advanced marker customization options in MATLAB: Marker Transparency: Property: MarkerFaceAlpha and MarkerEdgeAlpha control the transparency of the marker fill and edge, respectively. Example: In this example, markers from two datasets are overlaid with varying transparency levels for better visualization. Custom Marker Symbols: Property: Users can define custom marker symbols using characters or symbols not covered by the default set. Example: In this example, a dollar sign ('$') is used as a custom marker symbol. Marker Rotation: Property: MarkerAngle allows users to specify the rotation angle of certain marker types (e.g., triangles). Example: In this example, upward triangles are rotated by 45 degrees. Marker Size Mapping: Property: Users can map a range of data values to marker sizes, allowing for visual representation of an additional variable. Example: Marker sizes are determined by the 'sizes' vector in this example.
Next TopicSqueeze in Matlab
|
 For Videos Join Our Youtube Channel: Join Now
Feedback
- Send your Feedback to [email protected]
Help Others, Please Share


