Imagesc in MATLABIntroductionImages are a fundamental part of many fields, from scientific research to image processing and beyond. MATLAB, a powerful computing environment, provides a plethora of tools for working with images, and one of the most commonly used functions for visualizing images is images. Understanding Images in MATLABBefore we dive into imagesc, it's crucial to have a basic understanding of how MATLAB represents and works with images. In MATLAB, images are typically represented as matrices where each element corresponds to a pixel value. For grayscale images, these matrices are 2D, with values representing pixel intensities ranging from 0 (black) to 1 (white) or 0 to 255 (8-bit representation).
Introducing imagescThe imagesc function in MATLAB is designed for visualizing matrices as images with scaled colors. Unlike the image function, which directly plots pixel values as colors, imagesc scales the data to use the full colormap range, providing better contrast and visualization for matrices with varying value ranges. SyntaxThe basic syntax for imagesc is straightforward: Here, C is the matrix you want to visualize. When you call imagesc(C), MATLAB creates a pseudocolor plot of the matrix elements. Understanding the Pseudocolor PlotThe pseudocolor plot generated by imagesc assigns colors to the matrix elements based on their values. MATLAB uses a colormap to map the matrix values to colors, with lower values corresponding to one end of the colormap spectrum and higher values to the other. Additional Parametersimagesc offers additional parameters to customize the plot according to your requirements: Clim: You can specify the color limits using the clim parameter. This parameter allows you to set the minimum and maximum values of the colormap, providing control over the color scaling. AlphaData: This parameter allows you to specify an alpha (transparency) value for each pixel. It can be used to overlay images or create effects where some parts of the image are transparent. Parent: If you want to display the image in a specific axes object, you can use the Parent parameter. XData and YData: These parameters allow you to specify the coordinates for the image. imagesc('XData', x_values, 'YData', y_values, C) Implementation:Output: 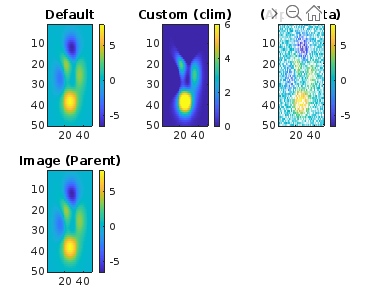
Explanation:
Practical Applications of ImagesNow that we understand the basics of images, let's explore some practical applications where this function shines. Implementation: Output: 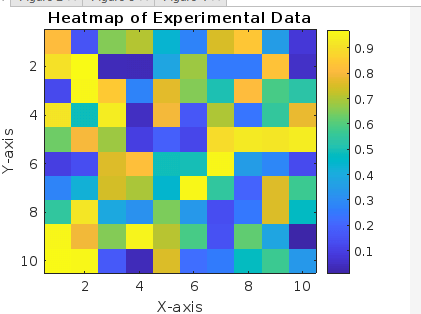
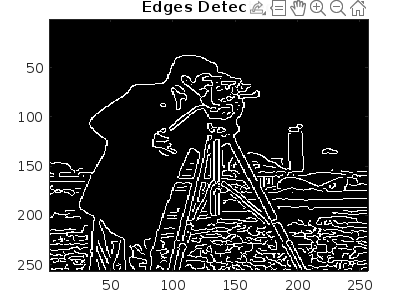
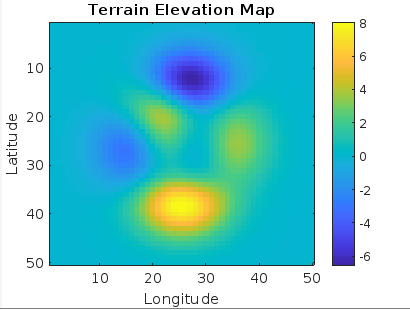
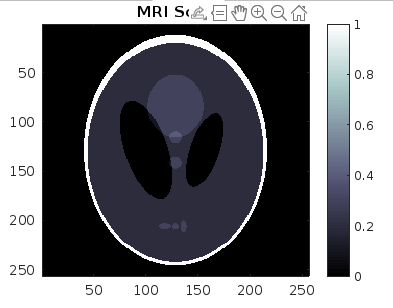
Each plot showcases a practical application of images in different domains, from data visualization to image processing, remote sensing, and medical imaging. Heatmaps and Data Visualization One of the most common uses of images is for visualizing data in the form of heat maps. In scientific research, heat maps are invaluable for displaying data trends, patterns, and variations. Suppose you have a matrix data_matrix representing some experimental measurements. You can create a heatmap of this data using images: Here, the colorbar adds a color scale to the side of the plot, providing a reference for the data values. The title, xlabel, and ylabel functions add labels for clarity. Image Processing and Enhancement images are also useful in image processing tasks for visualizing intermediate results or enhancing images for better analysis. Let's say you are working on edge detection in an image original_image. After applying an edge detection algorithm, you can visualize the detected edges: Here, we use the edge function with the 'Canny' method to detect edges in the original image. The colormap(gray) function sets the colormap to grayscale for better edge visualization. Remote Sensing and Geospatial Analysis In fields like remote sensing and geospatial analysis, images can be used to display satellite imagery, elevation maps, or other geospatial data. Suppose you have an elevation matrix elevation_data representing terrain heights. You can visualize this data as follows: Here, we use the 'parula' colormap, which is often preferred for visualizing terrain data. The colorbar function adds a color scale, and xlabel and ylabel provide axis labels. Medical Imaging and Analysis In medical imaging, images play a crucial role in visualizing various scans such as MRI, CT, or ultrasound images. It allows researchers and practitioners to analyze and interpret medical data effectively. Suppose you have an MRI scan represented by a 2D matrix mri_scan. You can display this image using the following images: Here, the 'bone' colormap is chosen for its grayscale appearance, suitable for medical imaging. The colorbar function adds a scale, aiding in intensity interpretation. Best Practices and TipsTo make the most of images and ensure clear and informative visualizations, consider the following best practices: Choose Colormaps Wisely: The choice of colormaps can significantly impact how your data is perceived. Consider the nature of your data and choose a colormap that best represents its characteristics. Use Colorbars: Colorbars provide a reference for the data values represented by colors in the plot. Always include a colorbar unless the colormap choice is intuitive without one. Label Axes and Title: Adding clear labels to the x-axis, y-axis, and a title to your plot improves readability and helps viewers understand the context of the visualization. Adjust Color Limits: Setting appropriate color limits (clim) can enhance the contrast of your image. Experiment with different values to find the optimal range for your data. Overlay Multiple Images: You can overlay multiple images or plots using transparency (AlphaData), allowing for comparisons or highlighting specific features. Consider Color Vision Impairments: If your audience may include individuals with color vision deficiencies, choose colormaps that are perceptually uniform and consider adding annotations or patterns for clarity.
Whether you're a scientist analyzing experimental data, an engineer processing images, or a researcher studying medical scans, images are a valuable tool in your MATLAB arsenal, providing insightful visualizations for your matrices of data.
Next TopicMatlab Patch
|
 For Videos Join Our Youtube Channel: Join Now
Feedback
- Send your Feedback to [email protected]
Help Others, Please Share


