| |

MATLAB text()Introduction:MATLAB, a widely used programming language and environment in the field of scientific computing, offers a plethora of functions and tools for data visualization. One such powerful tool is the text() function, which allows users to annotate plots with text, providing crucial information, explanations, or additional context. In this comprehensive guide, we will delve into the various aspects of the text() function in MATLAB, exploring its syntax, parameters, and practical applications. Syntax and Basic Usage:The text() function in MATLAB is primarily used for placing text on a figure or axes. Its basic syntax is as follows: x and y are the coordinates where the text will be placed. 'String' is the actual text that will be displayed. For example: This simple code snippet will place the text "Hello, MATLAB!" at the coordinates (0.5, 0.5) on the current axes. Customizing Text Properties:The text() function allows for a wide range of customization options to enhance the appearance of the text. Some key properties include: Font Size and Type: Users can specify the font size ('FontSize') and font type ('FontName') to make the text visually appealing and consistent with the overall design. Text Color: The 'Color' property allows users to set the text color, providing flexibility in creating visually striking annotations. Font Weight and Style: Adjusting the font-weight ('FontWeight') and style ('FontAngle') can be useful for emphasizing certain text elements. Positioning and Alignment: Precise placement and alignment of text are crucial for effective data communication. The text() function offers control over these aspects through parameters such as 'HorizontalAlignment' and 'VerticalAlignment.' Horizontal Alignment: Users can choose between 'left,' 'center,' and 'right' for horizontal alignment, ensuring text is positioned as desired. Vertical Alignment: For vertical alignment, options include 'top,' 'middle,' and 'bottom,' allowing for precise control over text placement. Annotations on Plots: One of the primary applications of the text() function is annotating plots. Whether it's labeling data points, adding axis labels, or providing additional information, text() proves invaluable in enhancing the interpretability of plots. Labeling Data Points: In this example, the text() function is used to label each data point with its corresponding y-value. Adding Axis Labels: While label () and label () are commonly used for axis labels, text() offers more flexibility for adding annotations directly to the plot. Advanced Usage and Math Text: For users dealing with mathematical content, MATLAB's text() function supports LaTeX-style formatting, enabling the inclusion of mathematical expressions within the text. The 'Interpreter' property set to 'latex' allows users to include complex mathematical expressions seamlessly. Handling Multiple Text Annotations: In scenarios where multiple annotations are required, using loops or cell arrays becomes beneficial. This allows for efficient and clean code organization. This example demonstrates how to use a loop and a cell array to place multiple annotations at specified positions. Saving Figures with Annotations: After creating a plot with text annotations, it's important to be able to save the figure for later use or sharing. MATLAB provides various options for saving figures, including the saves () function. This command saves the current figure as a PNG file, preserving all annotations made using the text() function. Implementation: Output: 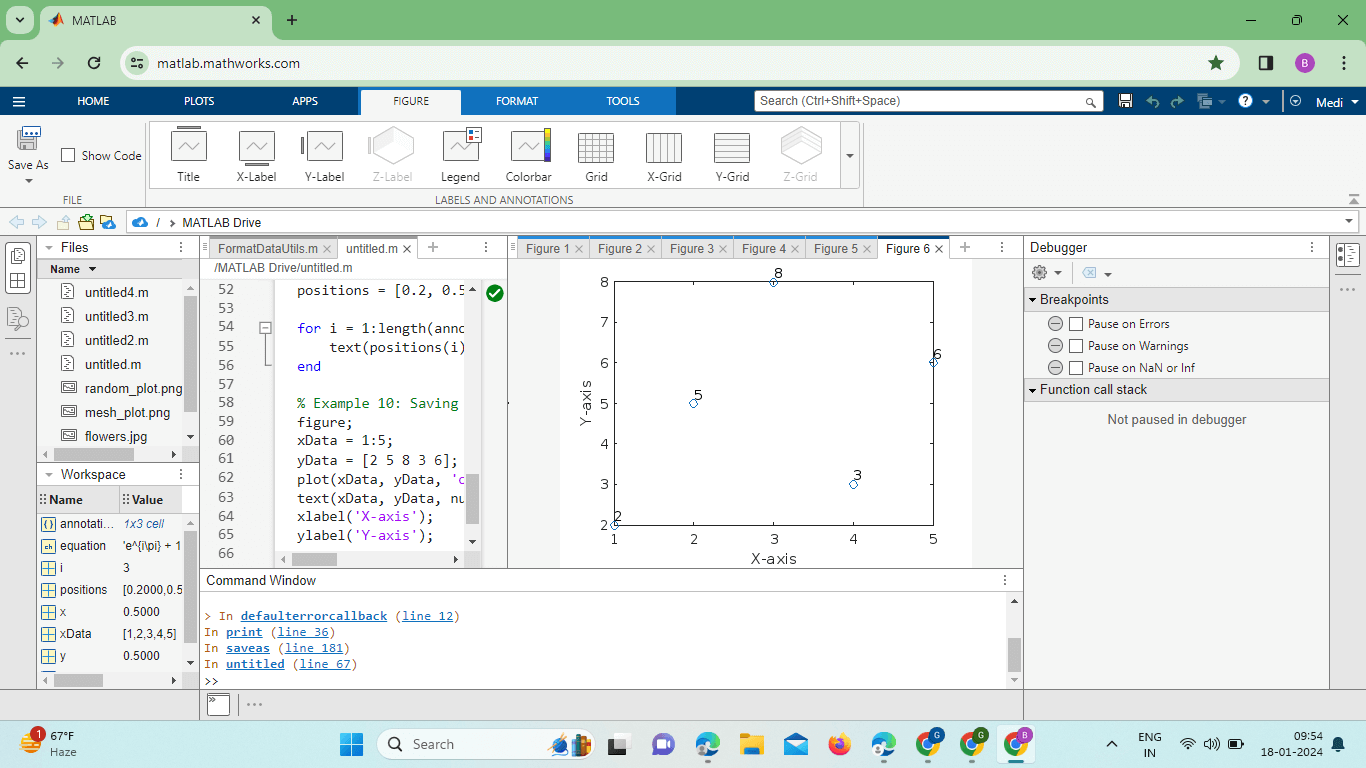
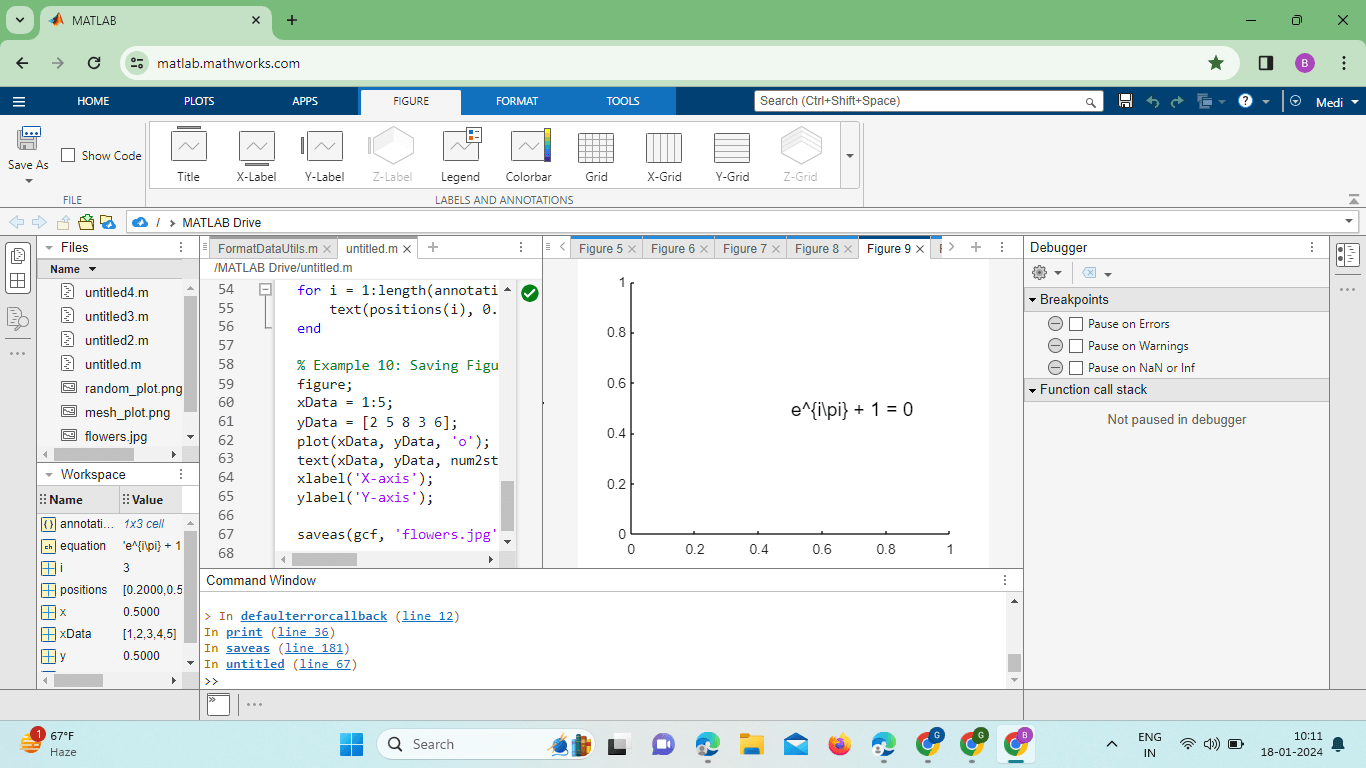
Explanation: Basic Usage This example introduces the basic usage of the text() function by placing the text "Hello, MATLAB!" at specific coordinates (0.5, 0.5) on the current axes. It demonstrates the fundamental structure of the function: text(x, y, 'String'). Customizing Font Size and Type Here, we customize the font size to 12 and set the font type to Arial using the 'FontSize' and 'FontName' properties, respectively. This illustrates how the text() function allows users to enhance the visual appearance of text annotations. Changing Text Color The 'Color' property is utilized to change the text color to red. This demonstrates the flexibility of the text() function in allowing users to customize the visual aspects of text annotations. Adjusting Font Weight and Style By adjusting the font weight ('FontWeight') to 'bold' and the font style ('FontAngle') to 'italic,' this example showcases how the text() function can be used to emphasize specific text elements for better visibility. Positioning and Alignment This example focuses on precise positioning and alignment of text using the 'HorizontalAlignment' property. The text is centered at the specified coordinates (0.5, 0.5). Annotations on Plots - Labeling Data Points In this scenario, the text() function is employed to label data points on a plot. Each data point's y-value is displayed above the corresponding point, enhancing data interpretation and clarity. Annotations on Plots - Adding Axis Labels While xlabel() and ylabel() are commonly used for axis labels, this example emphasizes the flexibility of the text() function by directly adding axis labels to a plot. Advanced Usage - Math Text This example demonstrates the advanced capability of the text() function to handle mathematical expressions. By setting the 'Interpreter' property to 'latex,' complex mathematical expressions, such as 'e^{i\pi} + 1 = 0', can be seamlessly included in the text annotations. Handling Multiple Text Annotations with a Loop Using a loop and a cell array, multiple annotations are efficiently placed at specified positions. This approach is beneficial when dealing with scenarios that require placing several annotations on a plot. Saving Figures with Annotations After creating a plot with text annotations, it's crucial to save the figure for later use or sharing. The save () function is introduced to save the current figure as a PNG file, preserving all annotations made using the text() function.
Next TopicMatlab nargin
|
 For Videos Join Our Youtube Channel: Join Now
Feedback
- Send your Feedback to [email protected]
Help Others, Please Share


