Plot a line along 2 points in MATLAB
Making a graphical representation that joins two distinct points in a 2D and 3D space constitutes plotting a line between two points in MATLAB. Plot or line functions, which are included in MATLAB, can be used for this.
Approach:
- Create a blank black-and-white image represented as a 2D matrix (bwImage) and specify the image's dimensions (rows and columns).
- Define the two points' coordinates (x1, y1, and x2, y2).
- Determine the slope of the line that connects these two points.
- Calculate the slope between each pixel and point 1 (x1, y1) by iterating through the rows and columns of the image matrix and applying the point-slope formula (m2).
- Verify that the slope m2 calculated corresponds roughly to the slope of the line connecting the two points. Set the pixel value to black (1) if they are within a modest tolerance of agreement.
- Show the final image in black and white.
The MATLAB procedure for drawing a line between two locations is detailed below:
Step 1: Define the Two Points
The x and y coordinates of the two places between which you wish to draw a line are specified in this stage.
Step2: Create a Plot
Here, you use the figure command to create a new figure before using the plot function to build a line connecting the two locations. The line should be blue, as specified by the 'b' option, and for greater visibility, the 'LineWidth' argument sets the line width to 2.
Step 3: Customize the Plot
This stage names the x and y axes to improve the plot's clarity and gives it a title.
Step 4: Add Markers to the Points(optional)
You can mark the two spots in this area using markers. You can add more details to the same plot using the hold-on command. The marker's size and design can be changed to suit your preferences.
Step 5: Display the Plot
In the last stage, you show grid lines on the plot as a guide and ensure that both axes are scaled equally to retain the proper aspect ratio.
You may use plot or line functions in MATLAB to draw a line joining two points. Here's how to execute both approaches:
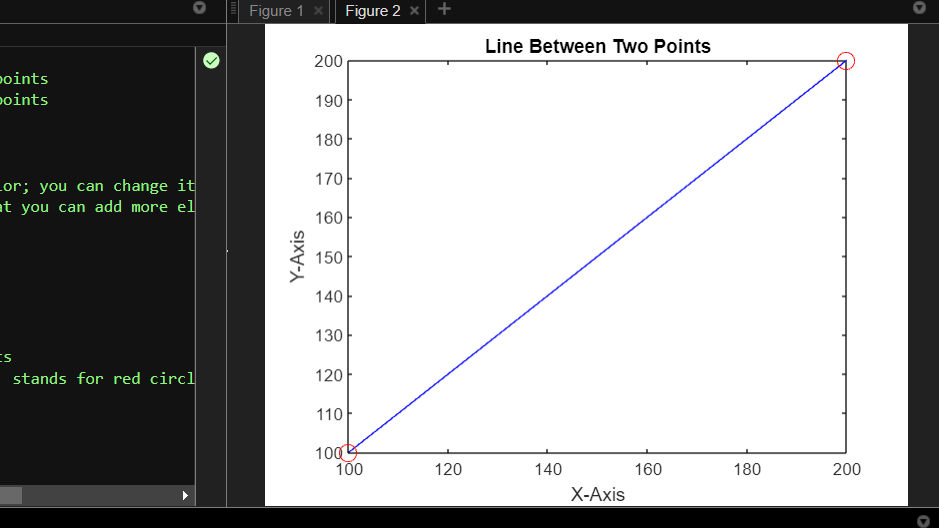
Method 1: Using the plot function
output:
Explanation:
What Are the Two Points?
The 2 points where (x1, y1) and (x2, y2) whose coordinates you want to connect with a line are specified. The arrays x and y contain these points.
Create a Plot: The plot is displayed by creating a new figure with the figure command.
Plot the Line: A line connecting the two points is drawn using the plot function. Here, you've stated that the line should be blue (the letter "b" stands for the color blue).
Hold the Plot: The hold-on command keeps the active plot in place while adding more components.
- A title can be provided using the title, and x and y axie labels can be added using xlabel and ylabel. This stage enriches the plot with descriptive details.
Add Markers (Optional): You might add markers there to make the two points more noticeable. This code uses red circles ('ro') as markers.
Release the Plot: Use the hold-off command to finish the current plot and prepare it for presentation.
Method 2: Using Two points
output:
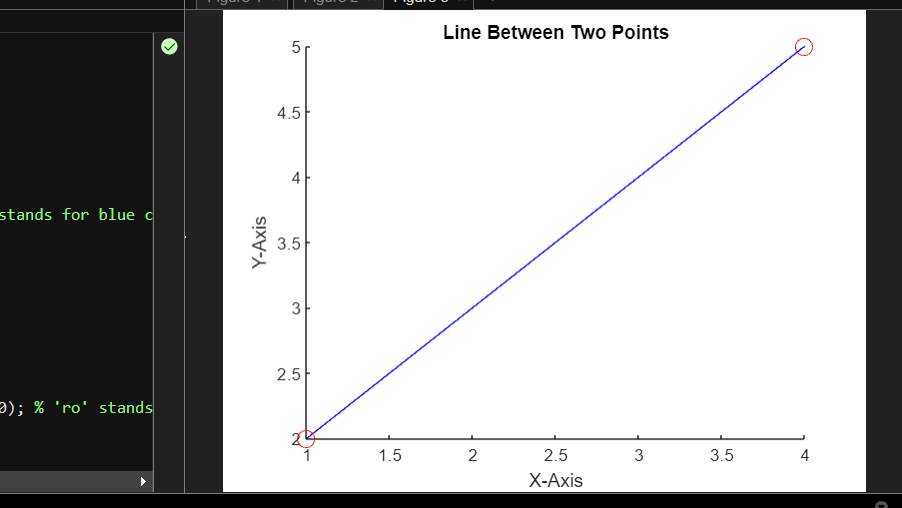
- Two points where (x1, y1) and (x2, y2) are specified in the code and will be connected by a line.
- The figure command displays the plot in a new figure window.
- A blue line connecting the two designated spots is created using the line function. You can alter the color of 'b' to whatever you choose.
- X and Y axes are labeled on the plot using xlabel and ylabel, and the caption "Line Between Two Points" is added using the title.
- Optionally, markers in red circles ('ro') are inserted at the two designated locations. The 'MarkerSize' parameter is set to 10 to make the markings bigger and more noticeable.
- The hold-on and hold-off instructions allow the current plot to be momentarily suspended while adding
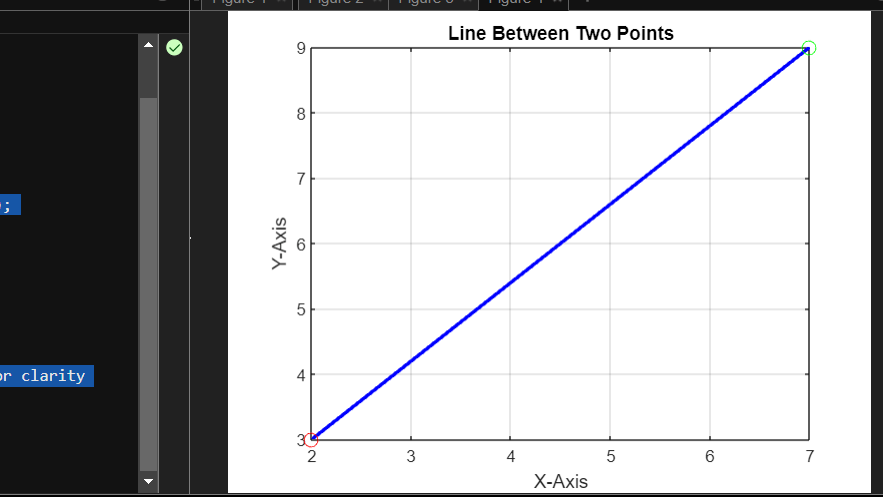
Implementation:
output:
Explanation:
- The program first defines two points' coordinates: (x1, y1) and (x2, y2).
- The figure command is used to construct a new figure to set up the plot.
- The plot function creates A blue line between the two supplied spots. To make lines more visible, the line width is adjusted to 2.
- Using the xlabel, ylabel, title, and grid on commands, the plot can be customized with labeled x and y axes, grid lines, and a title.
- For clarity, red (ro) and green (go) circle marks are optionally put at the two locations.
- The hold-on and hold-off commands control the plot's addition of markers.
- The program uses disp to display more details about its objectives.
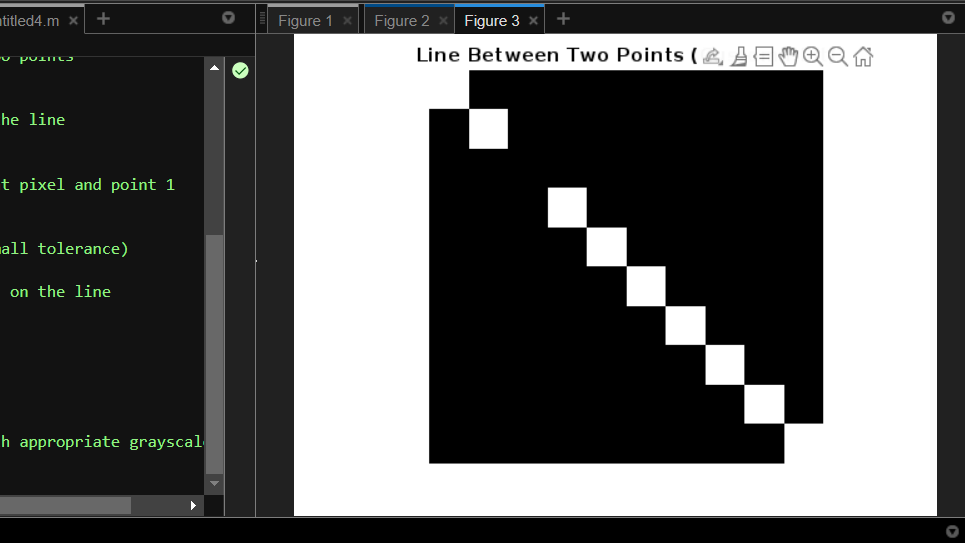
Implementation:
Explanation:
- The program creates an empty black-and-white image represented by the bwImage matrix with a size of 10x10 pixels.
- There are two determined points (x1, y1) and (x2, y2).
- Calculations are made to determine the line's slope between the two points.
- The program calculates the slope between each pixel and point1 (x1, y1) as it iterates across the rows and columns of the picture matrix.
- It determines whether the computed slope m2 almost equals the line's slope (slope) within a certain tolerance. The pixel is turned to black (1) if they coincide.
- The grayscale range [0, 1] is specified, and imshow displays the black-and-white image.
- Disp is used to display more program-related information.
Output:
|

 For Videos Join Our Youtube Channel: Join Now


