| |

Matlab ErrorbarIntroductionData visualization is a crucial aspect of data analysis, allowing researchers and scientists to convey complex information effectively. One essential tool in MATLAB for visualizing uncertainties in data is the error bar function. This comprehensive guide will delve into the intricacies of using error bars to create meaningful and accurate representations of data, providing both novice and experienced MATLAB users with valuable insights. Syntax:The basic syntax for the errorbar function is as follows:
Understanding Error BarsError bars are graphical representations used in charts and graphs to indicate the uncertainty or variability in a set of data. They provide a visual representation of the precision or reliability of the data points. Error bars are commonly used in scientific research, statistics, and data visualization. There are different types of error bars, and their interpretation depends on the context and the type of data being presented. Here are some key points to help you understand error bars: Types of Error Bars:Standard Error (SE): Represents the standard deviation of a sample divided by the square root of the sample size. Commonly used when multiple samples are taken from the same population. Smaller standard error bars indicate more precise data. Standard Deviation (SD): Represents the spread of individual data points around the mean.Useful for showing the variability within a single sample. Larger standard deviation bars indicate greater variability. Confidence Intervals (CI): Indicates the range within which the true population parameter is likely to fall. Common confidence levels include 95% and 99%. Wider confidence interval bars represent greater uncertainty. Interpreting Error Bars:Overlap: If error bars overlap between two groups, there may not be a significant difference between them. No Overlap: Non-overlapping error bars can indicate a significant difference between groups. However, statistical tests are necessary to confirm significance. Length of Error Bars:Shorter error bars indicate higher precision and less uncertainty. Longer error bars suggest greater variability or less precision. Direction: In some cases, error bars can be asymmetric, indicating that uncertainties are not equal in both directions. Outliers: Outliers can significantly affect error bars. Consider investigating any data points that might be causing unusually large error bars. Common Mistakes:Misinterpretation: Error bars should not be used to make definitive conclusions about individual data points. They represent overall trends and variability. Ignoring Sample Size: Smaller sample sizes result in larger error bars. Always consider the sample size when interpreting error bars. Inappropriate Use: Choose the appropriate type of error bar for your data and research question. For example, don't use standard deviation bars when comparing means. When to Use Error BarsUnderstanding the scenarios where error bars are essential for accurate data interpretation. Highlighting common misconceptions and potential pitfalls to avoid. Error bars are typically used in graphs and charts to represent the uncertainty or variability associated with data points visually. Here are situations where using error bars is particularly relevant:
Creating Simple Error Bar PlotsImplementation: Output: 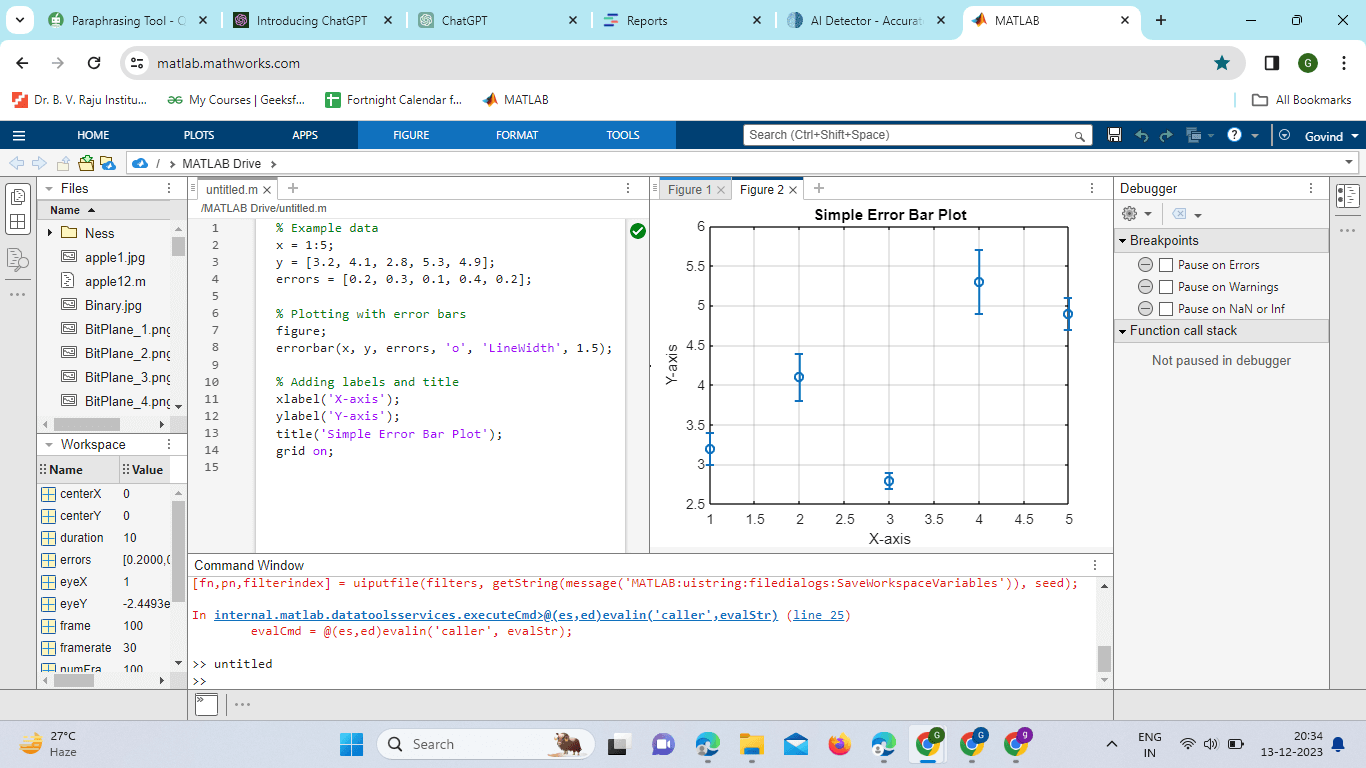
Explanation:
The errorbar function is used to create the plot, and the 'o' argument specifies that data points should be marked with circles. The 'LineWidth,' 1.5, sets the width of the error bar lines. Additional Customization: You can further customize the plot by adjusting various parameters: Line Style and Marker Style: Errorbar (x, y, errors, '-o', 'LineWidth,' 1.5, 'MarkerSize,' 8); Color Specification: errorbar(x, y, errors, 'o', 'Color,' [0.2, 0.6, 0.8], 'LineWidth,' 1.5); Handling Asymmetric Errors: upper_errors = [0.3, 0.4, 0.2, 0.5, 0.3]; lower_errors = [0.1, 0.2, 0.1, 0.3, 0.1]; errorbar(x, y, lower_errors, upper_errors, 'o', 'LineWidth', 1.5); Interpretation: The resulting plot will display data points along the x-axis with error bars extending vertically. The error bars indicate the uncertainty or variability associated with each data point. This visual representation allows viewers to assess the precision and reliability of the data. Advanced Features of errorbarMATLAB's error bar function offers several advanced features that allow for greater customization and control over the appearance of error bar plots. These features enhance the ability to convey complex information and create visually appealing representations of data. Asymmetric Error Bars: The errorbar function supports asymmetric error bars, where the upper and lower uncertainties may differ. This is particularly useful in situations where uncertainties are not symmetrically distributed. To use asymmetric error bars, provide separate vectors for the upper and lower bounds: Changing Error Bar Cap Length: The length of the caps at the end of error bars can be adjusted using the 'CapSize' parameter. This allows for better control over the visual appearance of the error bars: Custom Colors and Markers: Users can specify custom colors and markers for both data points and error bars. This adds flexibility in creating plots that align with specific color schemes or publication standards: Grouped Error Bars: When plotting data with multiple groups, it is possible to create grouped error bar plots for better visual comparison. This involves using the hold on and hold off commands to overlay multiple error bar plots on the same axes: Logarithmic Scale: MATLAB allows the use of logarithmic scales for both the x-axis and y-axis. This is particularly useful when dealing with data that spans multiple orders of magnitude. To set a logarithmic scale, use the set function: Multiple Axes: For more complex visualizations, it is possible to create plots with multiple axes. This is achieved using the subplot function. Each subplot can have its errorbar plot with customized settings: MATLAB's errorbar function offers a wide range of advanced features to cater to diverse plotting needs. Whether dealing with asymmetric errors, customizing colors, and markers, or creating complex layouts with multiple axes, these features empower users to generate highly tailored and informative error bar plots. Experimenting with these options allows for the creation of visually appealing and publication-quality visualizations in MATLAB. Implementation: Output: 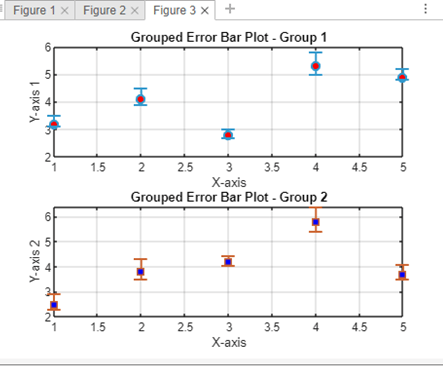
Explanation: Two sets of data (y1 and y2) with asymmetric error bars are defined. The errorbar function is used to create grouped error bar plots for each set of data, with custom colors, markers, and cap lengths. The subplot function is employed to create a figure with multiple axes, allowing for a side-by-side comparison of the two groups. MATLAB's errorbar function, from its basic usage to advanced customization and real-world applications. Whether you are a beginner or an experienced MATLAB user, mastering the errorbar function can significantly enhance your data visualization skills and contribute to more insightful data analysis.
Next TopicMatlab Eye
|
 For Videos Join Our Youtube Channel: Join Now
Feedback
- Send your Feedback to [email protected]
Help Others, Please Share


