| |

MATLAB's ezplotIntroduction:Matlab, a powerful programming language and environment developed by MathWorks, is widely used for numerical computing and data analysis. One of the essential aspects of data analysis is visualization, and MATLAB provides various tools for creating insightful and meaningful plots. Among these tools, the ezplot function stands out as a convenient and user-friendly way to generate 2D plots of mathematical expressions or functions. Understanding ezplot:The ezplot function in MATLAB simplifies the process of creating plots by allowing users to input mathematical expressions directly. This is particularly helpful for those who want to visualize functions without the need for explicit parameterization. The function is part of the MATLAB Symbolic Math Toolbox, providing a bridge between symbolic expressions and graphical representation. Here's a basic syntax for using ezplot: In this syntax, expr represents the mathematical expression or function to be plotted. ezplot automatically generates a range of values for the independent variable and evaluates the expression at each point to create the plot. Let's delve into the various aspects and features of ezplot that make it a valuable tool for data visualization. Basic UsagePlotting a Single Function Output: 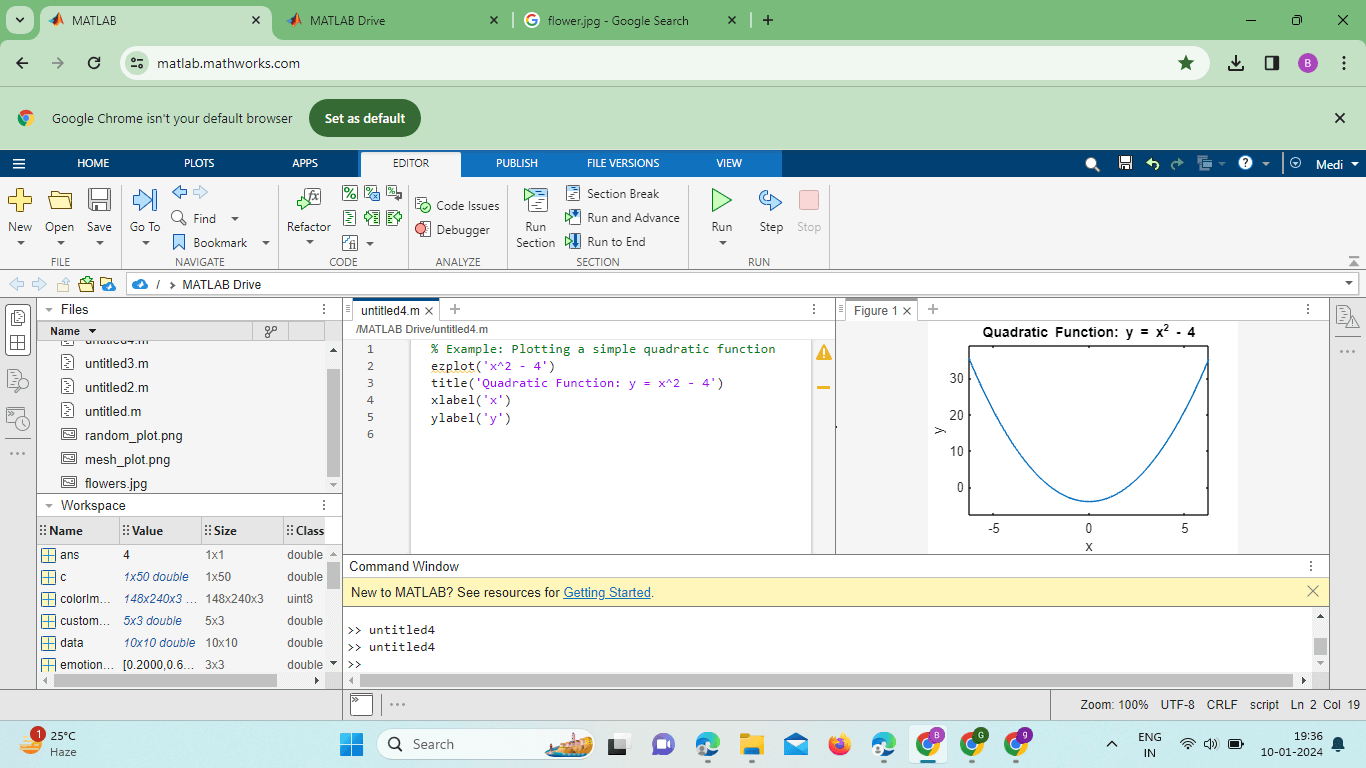
In this example, the expression 'x^2 - 4' represents a quadratic function, and ezplot automatically generates a range of values for x to create the corresponding plot. Plotting Multiple Functionsezplot also allows users to plot multiple functions within the same graph. This is particularly useful for comparing different functions or exploring the relationships between them. Example: Output: 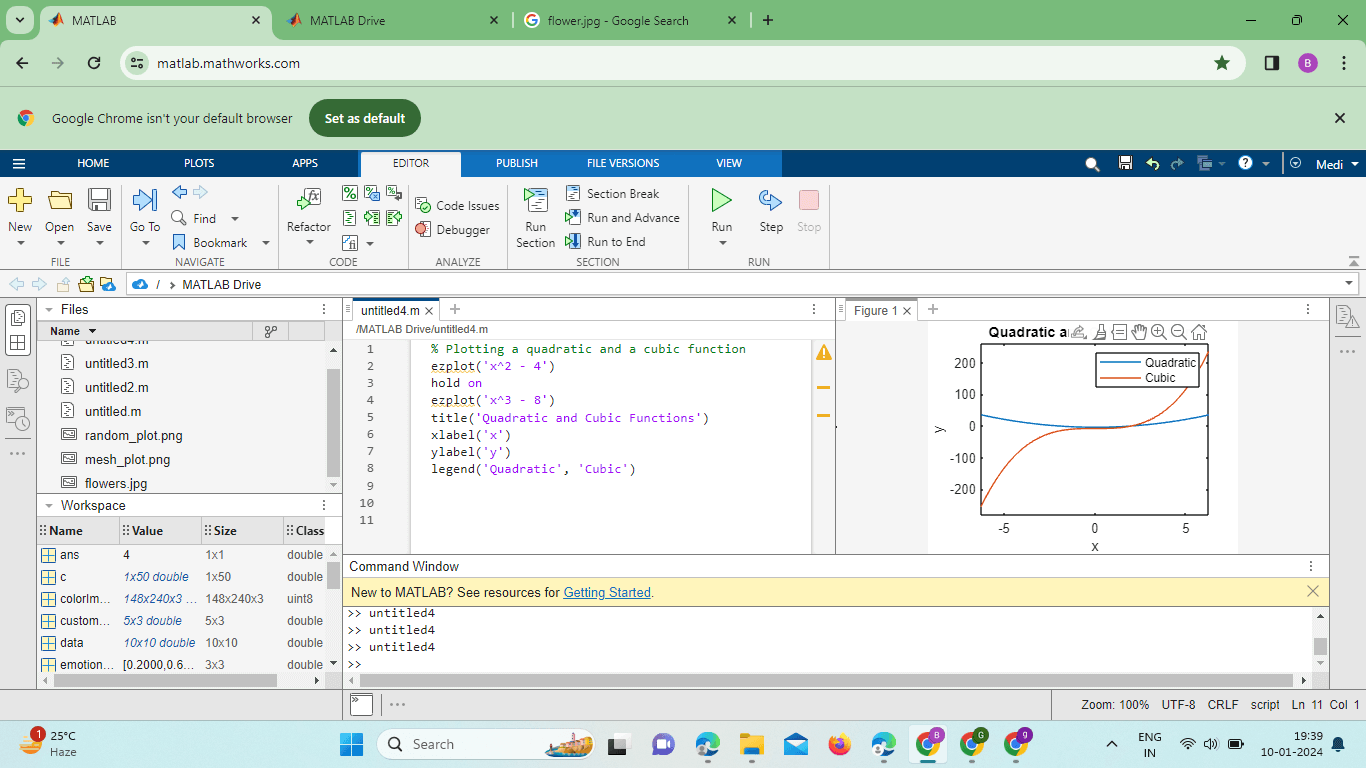
In this example, the hold on command ensures that both functions are plotted on the same graph. The legend function is then used to label each curve. Customizing PlotsTitle and LabelsTitles and axis labels are crucial for providing context to the plot. ezplot allows users to add these elements easily. Output: 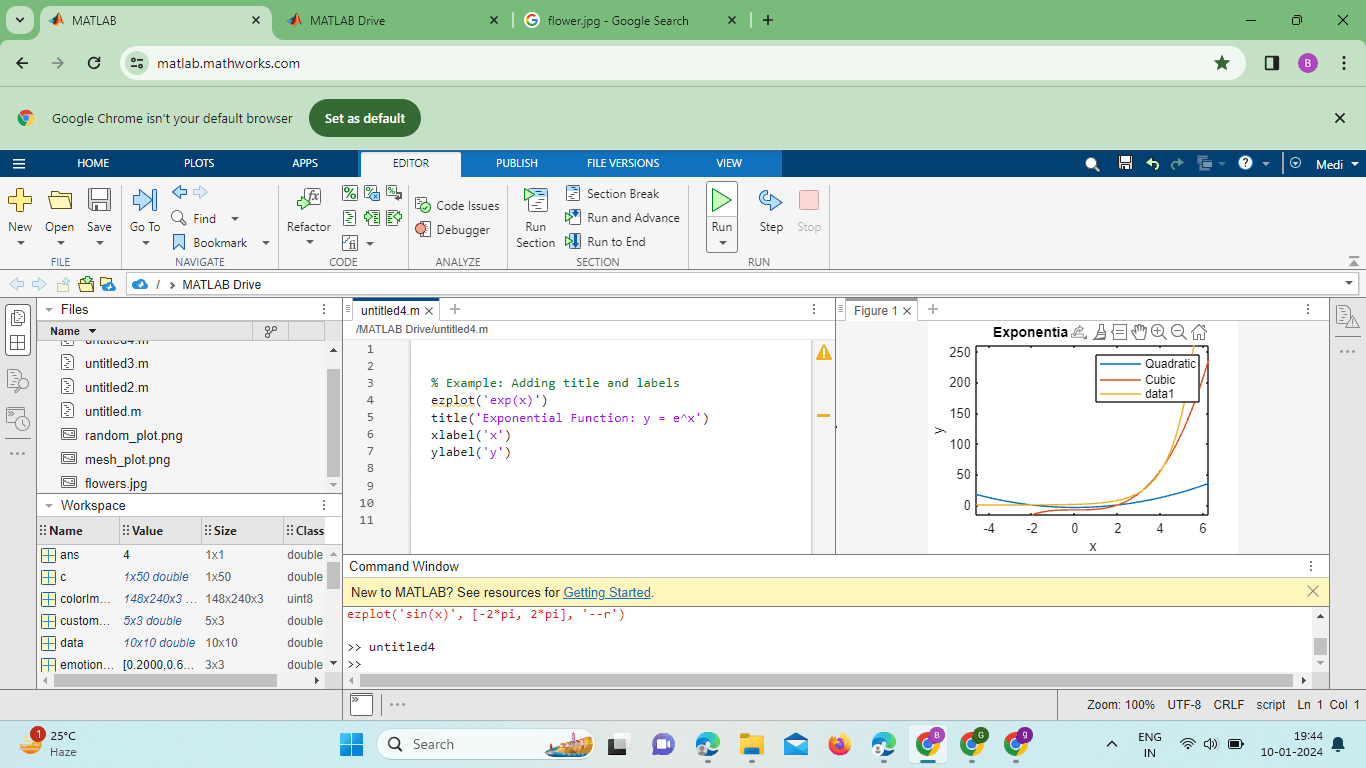
In this example, the title, xlabel, and ylabel functions are used to add a title and axis labels to the plot.
As you continue to delve into the world of MATLAB, experimenting with ezplot and its advanced features will not only enhance your data visualization skills but also deepen your understanding of mathematical concepts and relationships. Whether you are a student, researcher, or professional, mastering ezplot opens up a myriad of possibilities for expressing and analyzing data in MATLAB. Advanced FeaturesParametric Plotting: ezplot supports parametric Plotting, allowing users to visualize curves defined by parametric equations. This is particularly useful for representing complex geometries and trajectories. Symbolic Variables: Integration with symbolic variables enables users to work with symbolic expressions directly in ezplot, providing a powerful way to visualize mathematical relationships symbolically. Multiple Plots in a Single Figure: ezplot facilitates the overlay of multiple functions in a single graph, allowing for easy comparison and analysis of different mathematical expressions within the same plot. Customizable Line Styles and Colors: Users can customize the appearance of the plot by specifying line styles, colors, and markers. This feature enhances the visual appeal and clarity of the plotted functions. Interactive Exploration: The ability to set callbacks in ezplot enables interactive Plotting. Users can define functions that respond to events like mouse clicks, providing an engaging and dynamic exploration experience. Handling Undefined Points: The exploit allows users to gracefully handle undefined points in a plot, preventing disruptions due to potential discontinuities. This feature is valuable when visualizing functions with restricted domains. Integration with External Functions: Users can seamlessly integrate external functions with ezplot, providing a modular and organized approach to plotting. This is particularly useful for users working with complex or specialized mathematical functions. Symbolic Expressions and Derivatives: ezplot supports the visualization of symbolic expressions and their derivatives in a single plot. This enables a comprehensive exploration of the relationship between a function and its rate of change. Handling Large Datasets: While ezplot may have some limitations with large datasets, its simplicity can still be leveraged for visualizing smaller datasets with ease and clarity. Integration with Other MATLAB Plotting Functions: The exploit can be combined with other MATLAB plotting functions to create more intricate and customized visualizations. This integration allows users to leverage the strengths of different plotting tools.
Parametric Plottingezplot can also handle parametric Plotting, allowing users to visualize curves defined by parametric equations. Output: 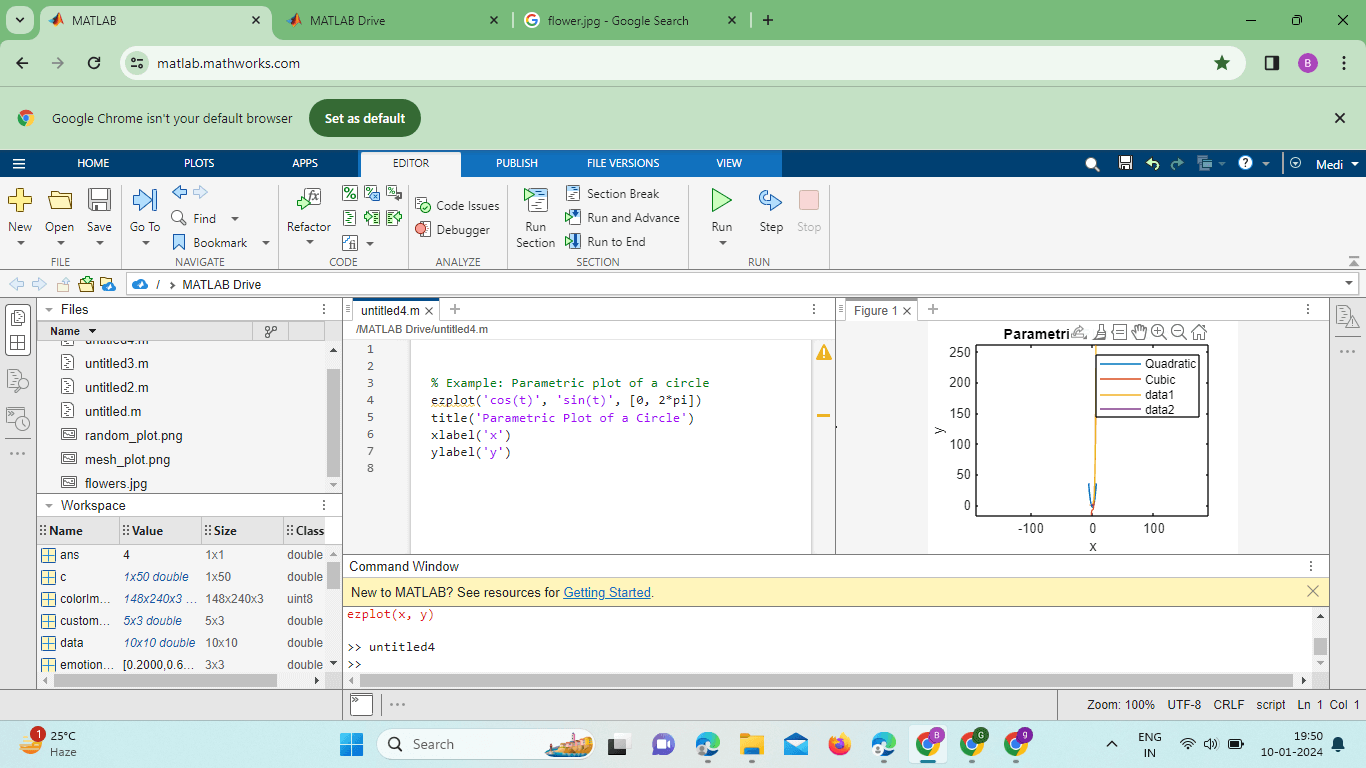
In this example, the parametric equations for a circle are provided, and the range of the parameter t is specified. Implementation: Output:
Explanation: Symbolic Variable Definition: The syms t; line defines a symbolic variable t that will be used in the parametric equations. Parametric Equations: The parametric equations for x and y are defined in terms of the symbolic variable t. Here, x = sin(2*t) and y = cos(3*t). Function Handle: The parametric_equation function handle encapsulates the parametric equations. This is done to facilitate the use of fplot with a function handle. Plotting with fplot: The fplot function is used to plot the parametric equation over the interval [0, 2*pi]. Unlike ezplot, fplot is more versatile and suitable for parametric plots, especially when dealing with symbolic expressions. Interactive Callback: The set function is used to add an interactive callback to the plot. The callback is triggered when the user clicks on the plot, and it displays the coordinates of the click in the MATLAB command window. Advantages of ezplot in MATLABEase of Use:ezplot is designed for simplicity, making it accessible for users with varying levels of MATLAB expertise. Users can plot mathematical expressions without the need for explicit parameterization, reducing the complexity of plotting tasks. Automatic Grid Generation: ezplot automatically generates a range of values for the independent variable, simplifying the process of creating plots. Users do not need to specify a grid of points manually; MATLAB takes care of the details. Quick Visualization of Functions: Ideal for quickly visualizing simple mathematical functions, making it a valuable tool for exploratory data analysis.Well-suited for educational purposes to demonstrate mathematical concepts graphically. Integration with Symbolic Math Toolbox: Supports symbolic variables, enabling users to work with mathematical symbols and expressions directly in their plots.Provides seamless integration with symbolic mathematics, enhancing the capability for symbolic manipulation. Convenient Plotting of Parametric Equations: ezplot handles parametric equations effortlessly, allowing users to visualize curves defined by parametric expressions with ease.Simplifies the process of plotting complex parametric functions. User-Friendly Styling Options: Provides straightforward options for customizing line styles, colors, and markers to enhance the visual appeal of plots. Users can easily add titles, labels, and legends to make plots more informative. Disadvantages of ezplot in MATLAB:Limited Control Over Plotting Details: While ezplot is convenient for quick visualizations, it may need more fine-grained control over plotting details that more advanced users may require. Users seeking precise control over plot properties might find the simplicity of ezplot limiting. Limited Support for 3D and Contour Plots: ezplot primarily focuses on 2D Plotting and may be a better choice for users looking to create 3D plots or contour plots. For more advanced spatial or surface visualizations, alternative functions like ezplot3 or contour might be preferred. Less Suitable for Large Datasets: When dealing with large datasets or complex numerical simulations, ezplot may not be as efficient as other MATLAB plotting methods. Users may need to resort to other plotting functions for handling larger datasets or more intricate visualizations. Dependence on Symbolic Math Toolbox: Symbolic capabilities are contingent on having access to the Symbolic Math Toolbox in MATLAB.Users with the toolbox might benefit from the full range of symbolic manipulation features. Not Ideal for Advanced Mathematical Functions: For advanced mathematical functions or those requiring specific parameterization, users might find that other plotting functions provide more flexibility and control. ezplot is most suitable for basic to moderately complex functions.
Depending on the specific requirements of a plotting task, users can choose the appropriate MATLAB plotting function that best fits their needs.
Next TopicOctave vs MATLAB
|
 For Videos Join Our Youtube Channel: Join Now
Feedback
- Send your Feedback to [email protected]
Help Others, Please Share


