| |

Colors in MATLABIntroduction:Matlab, a powerful numerical computing environment widely used in various scientific and engineering disciplines, provides extensive capabilities for working with colors. Whether you are visualizing data, creating plots, or designing graphical user interfaces, MATLAB's rich set of functions and tools for manipulating colors opens up a vibrant world of possibilities. In this exploration, we will delve into the fundamentals of color representation, manipulation, and visualization in MATLAB. Color Representation in MATLAB:Colors are represented in MATLAB using a combination of red, green, and blue (RGB) values. Each color channel can take values between 0 and 1, where 0 represents no intensity and 1 represents full intensity. For example, the color white is represented as [1, 1, 1], and black is represented as [0, 0, 0]. MATLAB also supports other color representations, such as hexadecimal and predefined color names, providing flexibility for users with different preferences. Creating Colors:MATLAB offers multiple ways to create and define colors. One common method is specifying RGB values directly, as mentioned earlier. For instance, you can create a custom color by using the RGB triplet: Another way to create colors is by using predefined color names: MATLAB also supports the use of hexadecimal values for defining colors: Color Mapping:Color mapping is a crucial aspect of visualizing data in MATLAB. It involves assigning colors to data points based on their values. MATLAB provides various built-in colormaps, such as 'jet,' 'parula,' and 'hot,' each with its distinctive color scheme. Choosing an appropriate colormap is essential for effectively conveying information in visualizations. Example: Example: 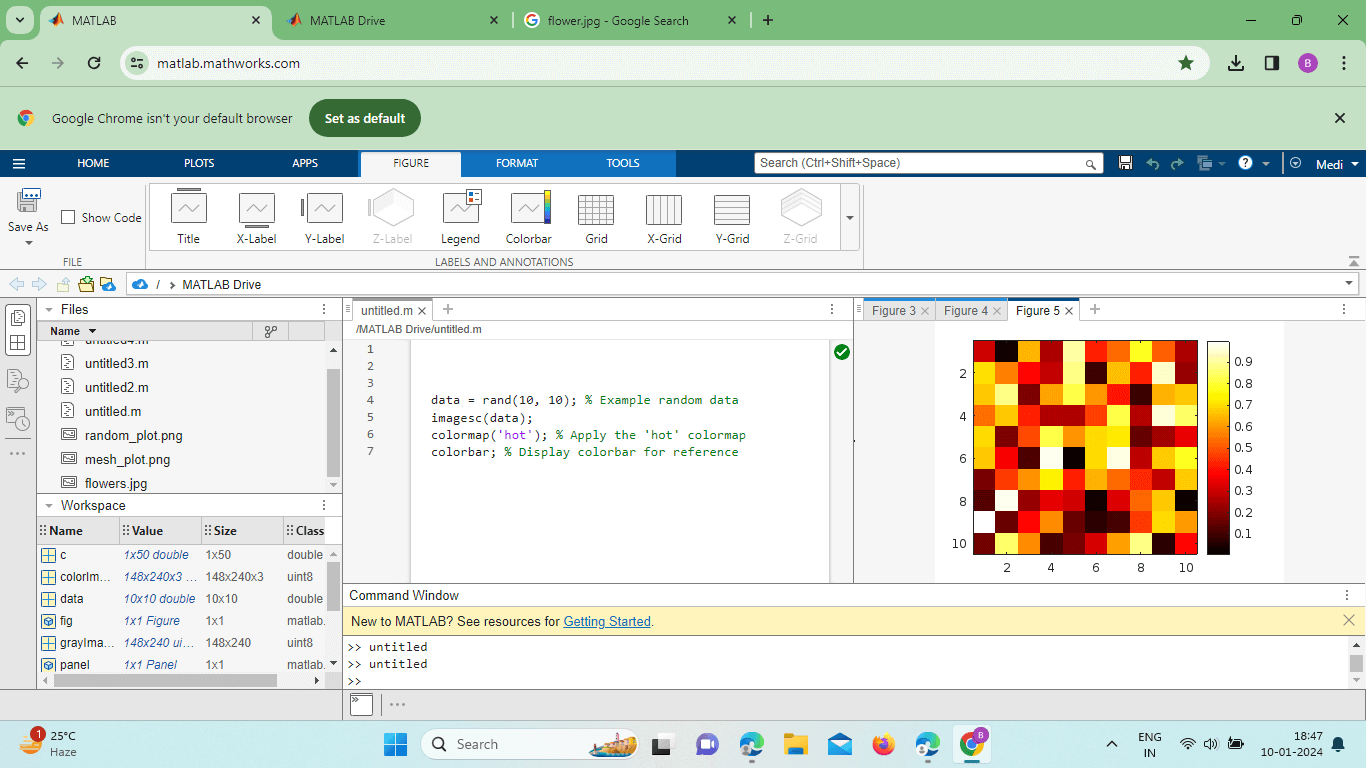
Users can also create custom colormaps using the colormap function and specifying a matrix of RGB values. This allows for personalized color schemes tailored to specific data visualization needs. Color Manipulation:MATLAB provides a suite of functions for manipulating colors, allowing users to adjust hue, saturation, brightness, and contrast. The rgb2hsv and hsv2rgb functions enable the conversion between RGB and Hue-Saturation-Value (HSV) color representations, providing a different perspective on color manipulation. Example: Example: 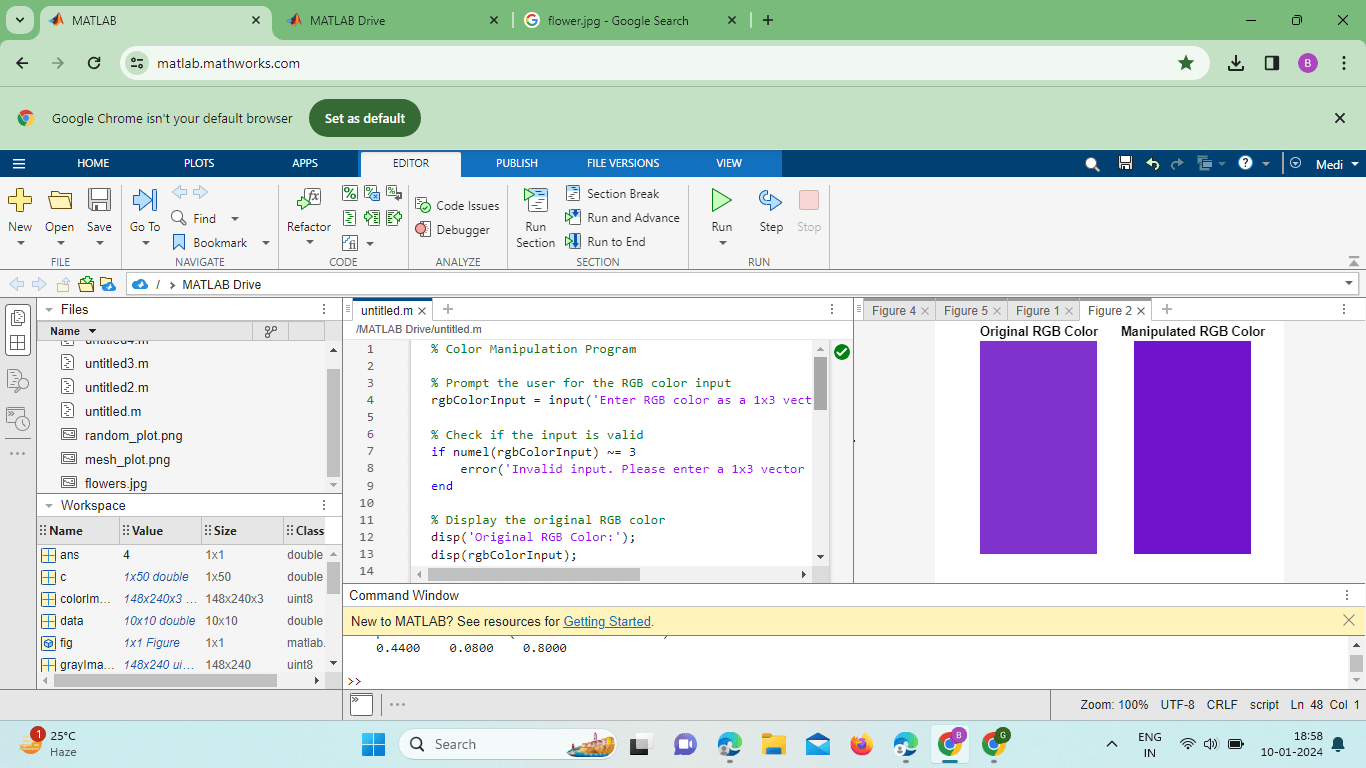
This example increases the brightness of the original RGB color. Experimenting with these functions allows users to create visually appealing variations of colors. Plotting and Visualization:In MATLAB, plotting is a fundamental aspect of data analysis and visualization. Understanding how to use colors effectively in plots enhances the clarity and interpretability of the visualized data. Example: Example: 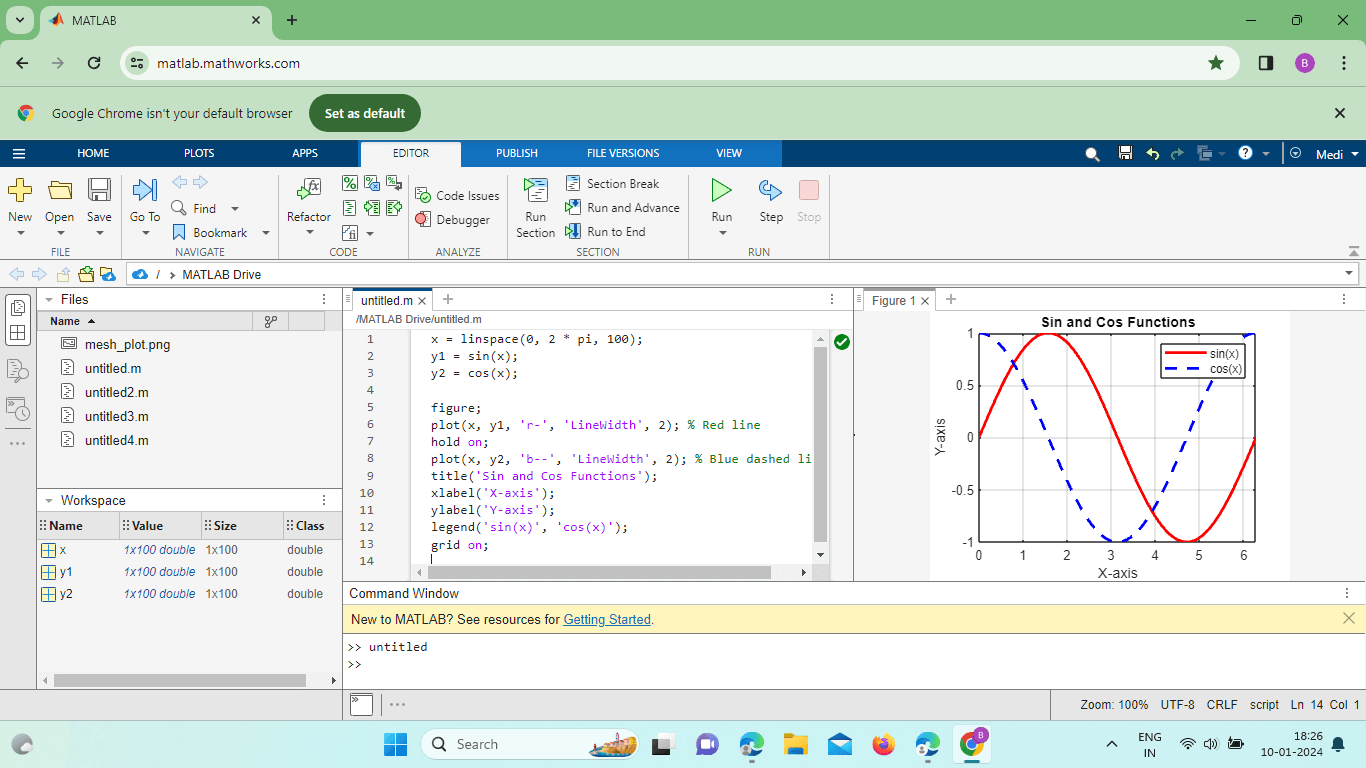
In this example, the 'r-' and 'b--' specifications define the colors and line styles for the two plotted functions. MATLAB offers a wide range of options for customizing plot colors, markers, and styles, allowing users to create visually appealing and informative visualizations. GUI Development:For those engaged in graphical user interface (GUI) development using MATLAB's App Designer or GUIDE, understanding color management is crucial. MATLAB provides tools for setting and customizing the colors of various GUI components, such as buttons, axes, and panels. Exporting and Sharing Visualizations:Once you have created stunning visualizations in MATLAB, you can share your work with others. MATLAB provides options for exporting plots and figures in various formats, including PNG, JPEG, PDF, and more. Additionally, users can customize the resolution and appearance of exported graphics to meet specific requirements. Example: 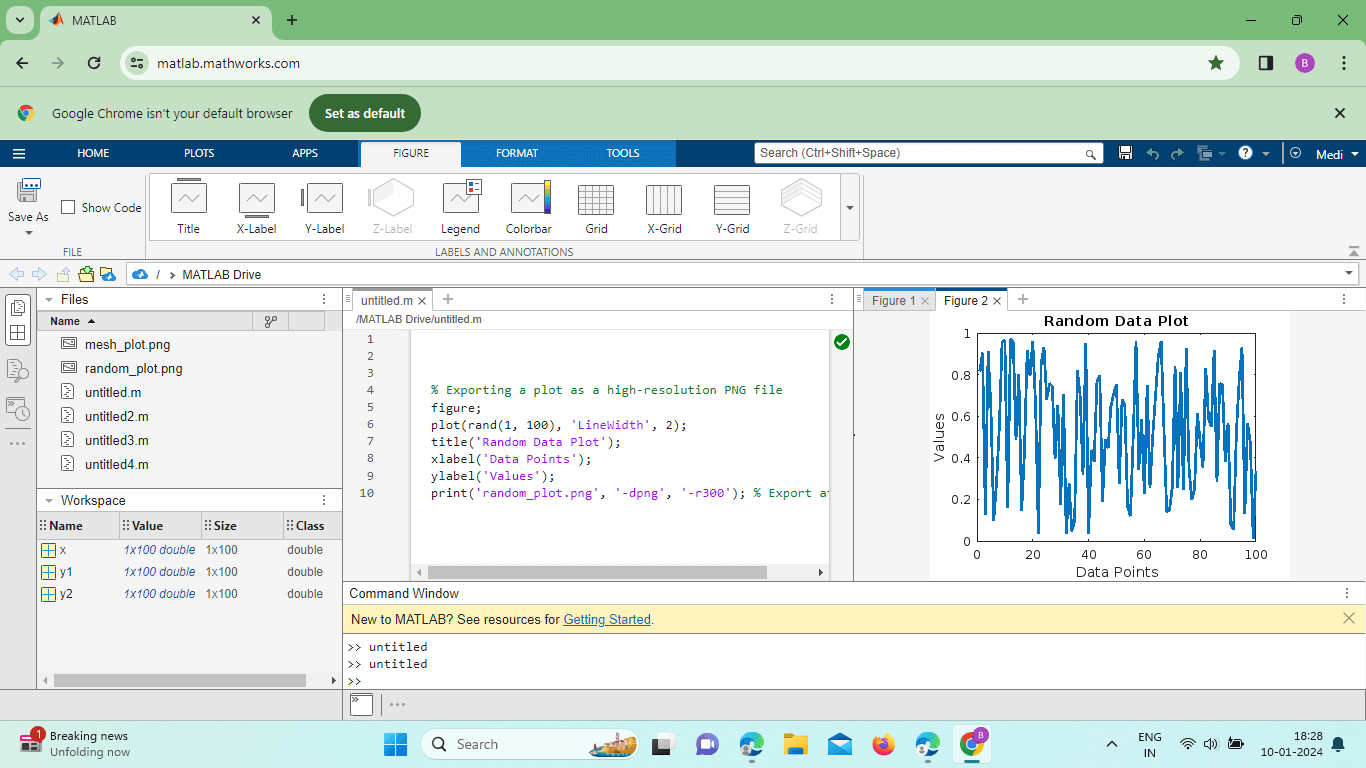
This code exports the plot as a PNG file with a resolution of 300 dots per inch (DPI). Adjusting the resolution ensures that the exported image maintains high quality for presentations, publications, or online sharing.
So, dive into the vibrant world of MATLAB colors and unleash your creativity in data visualization and graphical design. Advanced Color Techniques:In addition to the fundamental color manipulation techniques discussed earlier, MATLAB offers advanced methods for working with colors. One such technique is the use of transparency or alpha blending. Transparency allows overlapping elements in a plot to be visually distinguished, providing more information without cluttering the display. Example: 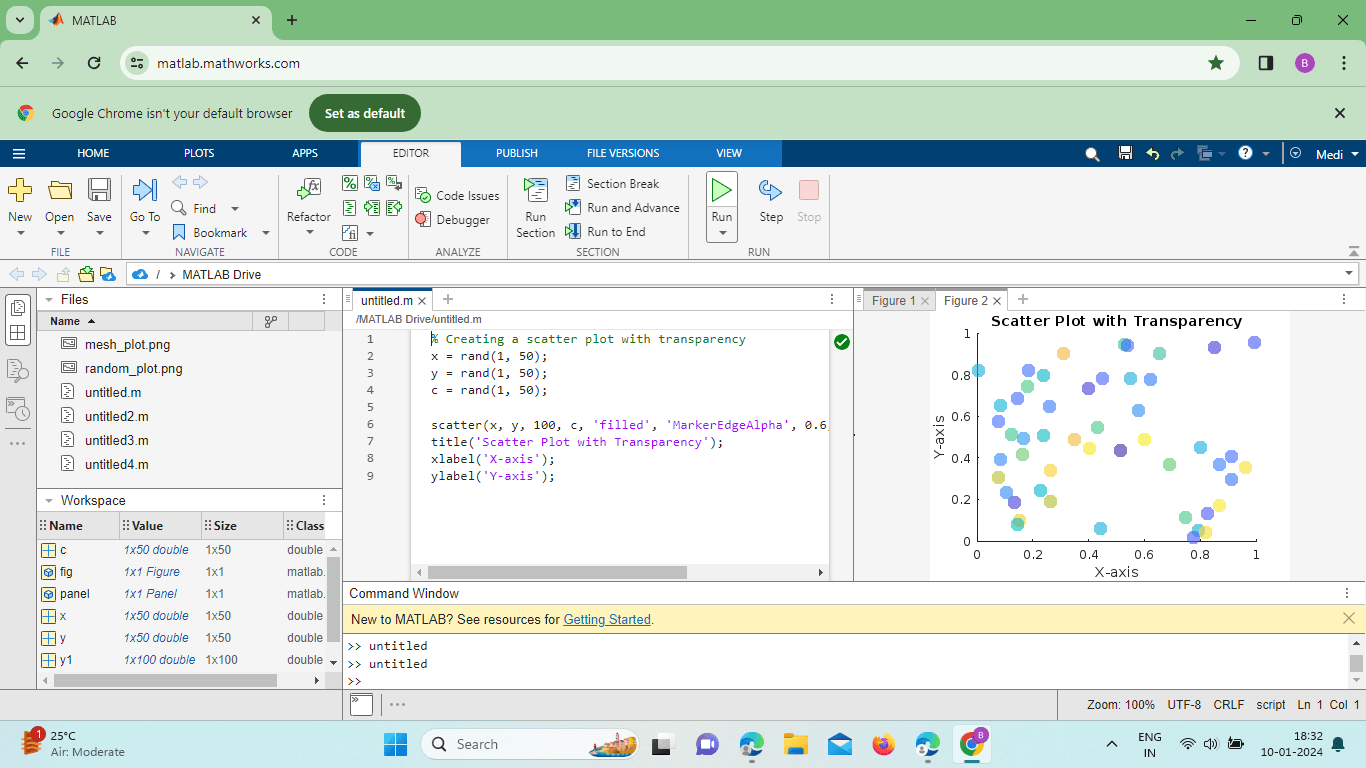
This example demonstrates how to create a scatter plot with transparent markers, making it easier to identify overlapping points. The 'MarkerEdgeAlpha' and 'MarkerFaceAlpha' properties control the transparency of marker edges and faces, respectively. Color-Based Image Processing:MATLAB is widely used for image processing, and colors play a crucial role in tasks such as segmentation and analysis. The rgb2gray function converts a color image to a grayscale, simplifying subsequent processing steps. Example: 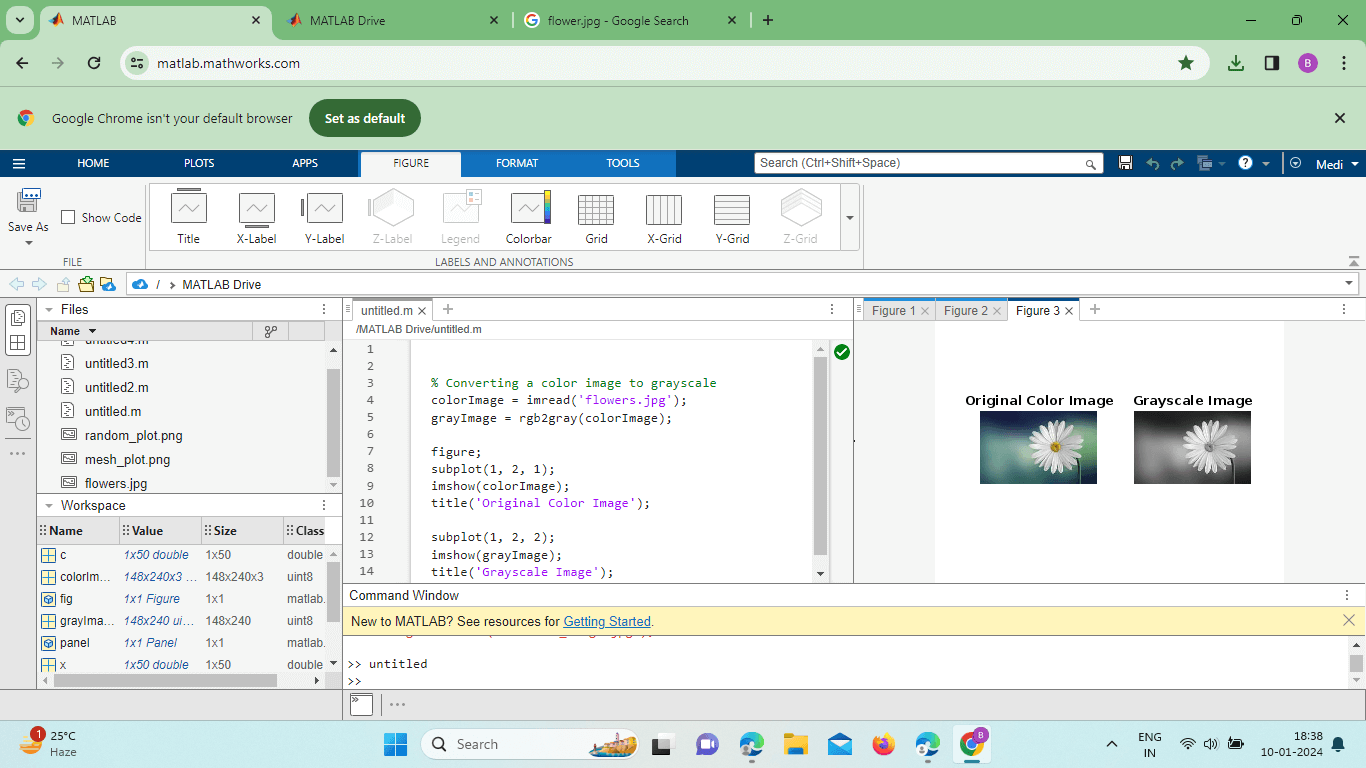
In this example, a color image is converted to grayscale for easier analysis. MATLAB's image processing toolbox provides numerous functions for extracting and manipulating color information in images. Color and Data Visualization Challenges:When working with large datasets, it's essential to choose appropriate color schemes that cater to colorblind individuals and ensure accessibility. MATLAB addresses this concern by providing perceptually uniform colormaps like 'viridis' and 'cividis,' designed to maintain uniform perceptual changes across the color range. Example: 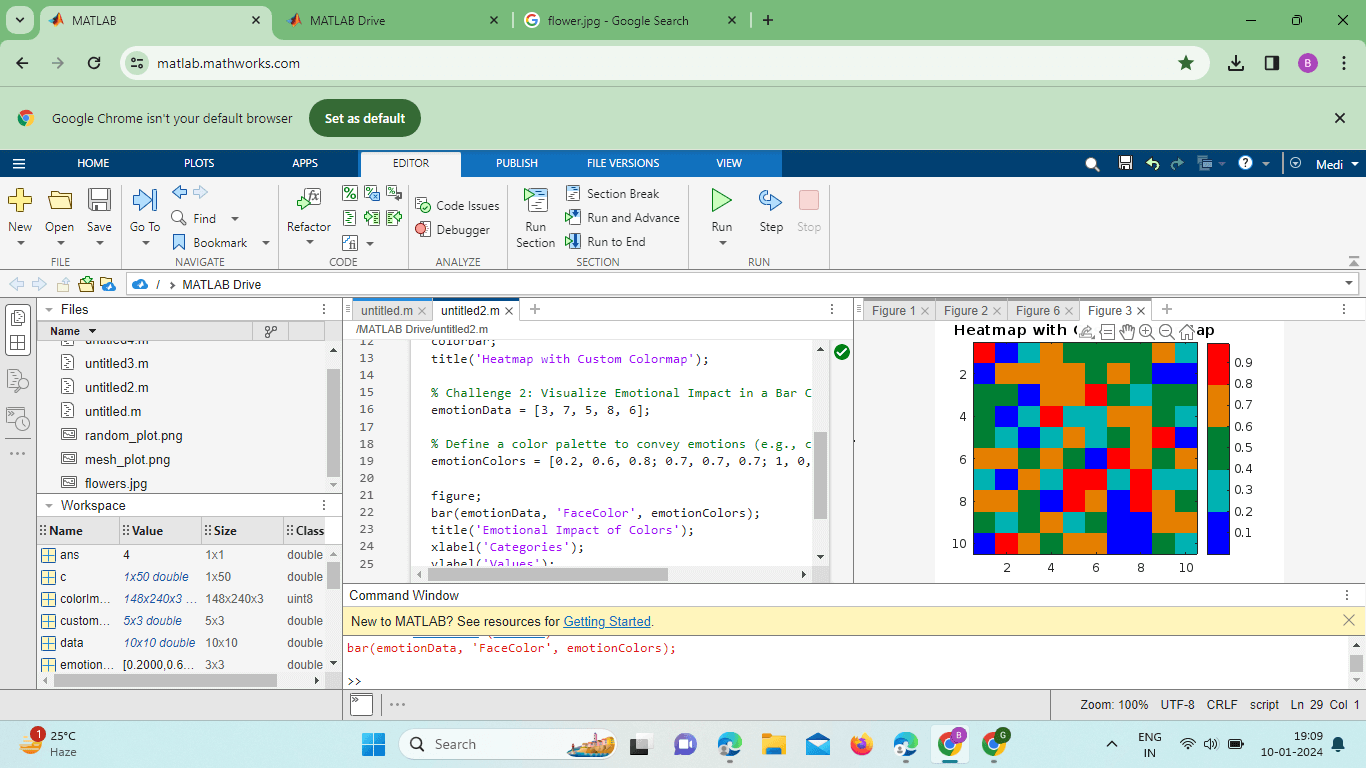
Animation and Dynamic Color Changes:MATLAB supports dynamic color changes, which can be particularly useful in animated visualizations. By updating the color properties of graphics objects in a loop, users can create engaging animations that convey temporal changes in data. Example: 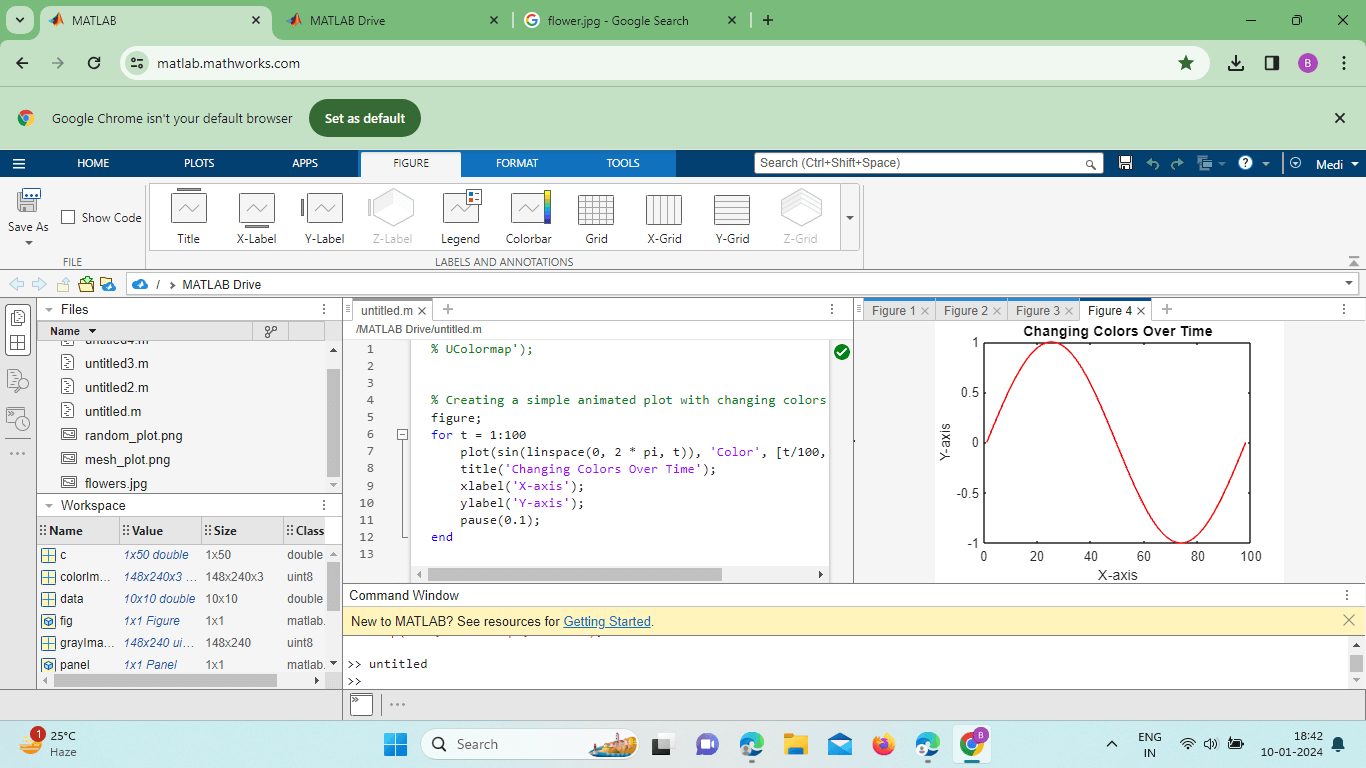
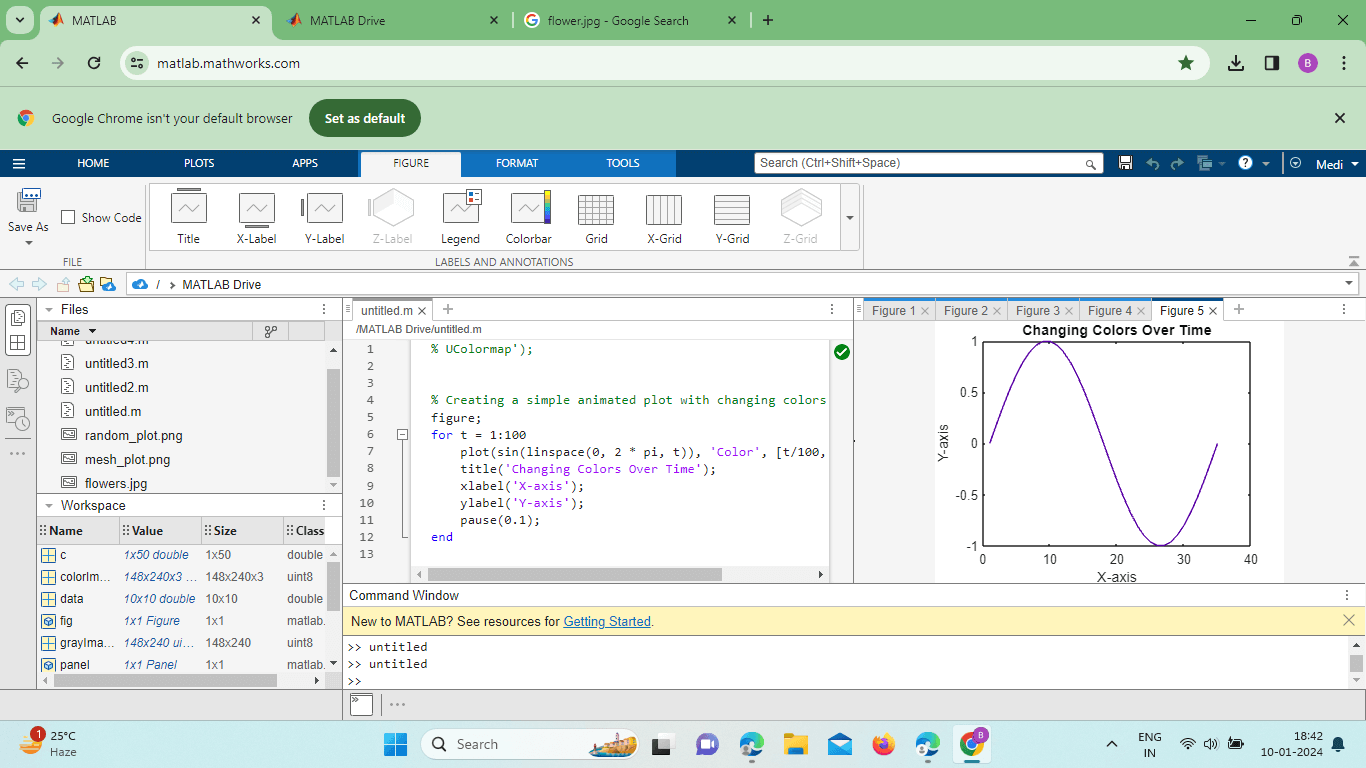
In this example, the color of the plot changes gradually over time, creating a visually dynamic representation. Color Psychology and Visualization:Understanding the psychological impact of colors is essential for effective data communication. MATLAB allows users to explore the emotional and cognitive aspects of Example: 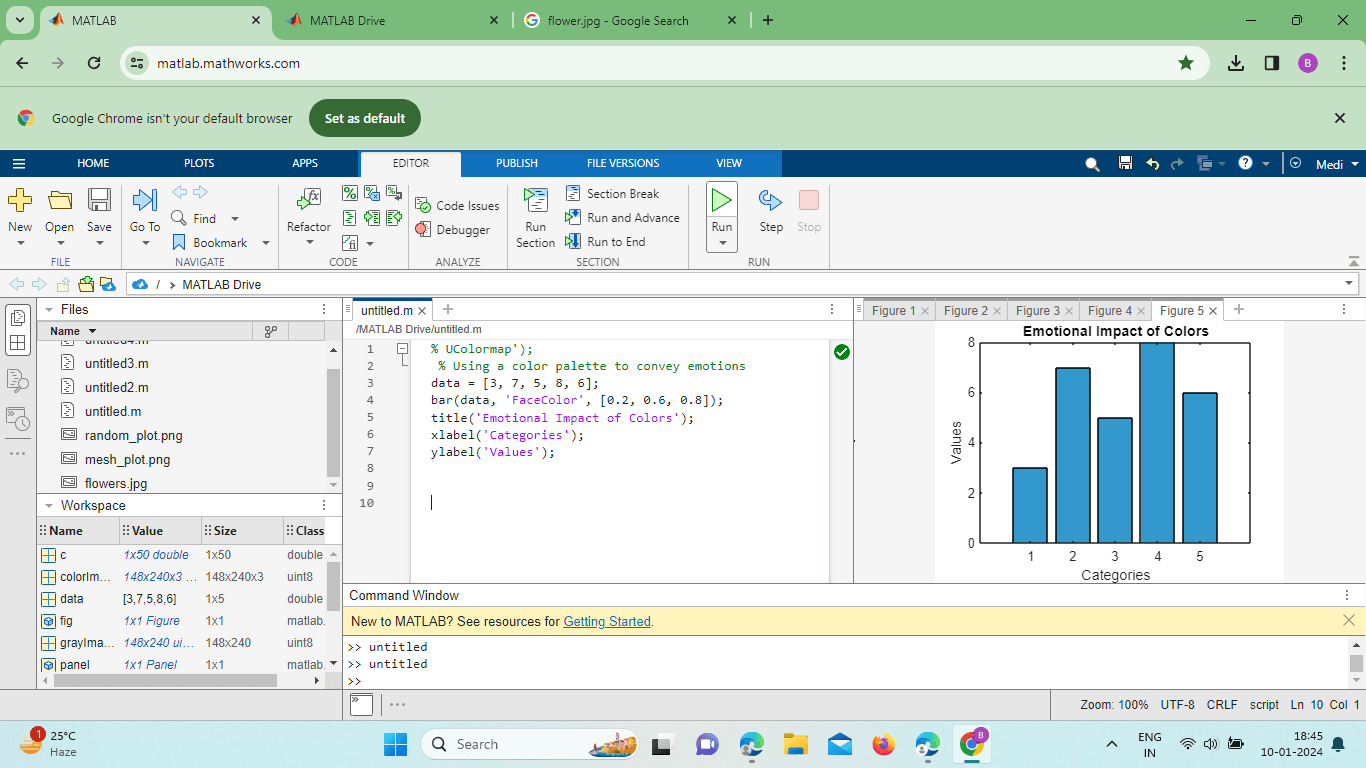
In this example, the chosen color palette aims to convey a sense of calm and stability, enhancing the viewer's emotional connection to the data.
As you continue your journey into the colorful world of MATLAB, experiment with the various techniques and functionalities discussed to elevate your work to new heights.
Next TopicMATLAB's ezplot
|
 For Videos Join Our Youtube Channel: Join Now
Feedback
- Send your Feedback to [email protected]
Help Others, Please Share


