| |

MATLAB 2-D PlotsThere are many specific graphics functions for 2-D plotting. They are used as alternatives to the plot command we have just discussed. MATLAB help desk lists more than 20 types of two-dimensional plots. Examples include stem plots, stair plots, bar plots, pie plots, and compass plots. Here we are going to discuss the 2D plotting function in MATLAB. MATLAB fplot()It is used to plot between the specific limit. The function must be of form y=f(x), where x is the vector whose specifies the limits, and y is the vector with the same size as x. SyntaxExampleOutput: 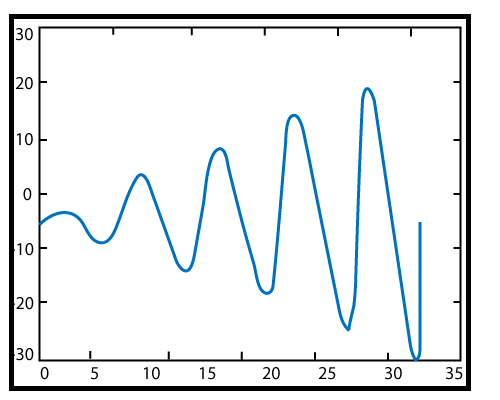
Next TopicMATLAB Semilogx()
|
 For Videos Join Our Youtube Channel: Join Now
Feedback
- Send your Feedback to [email protected]
Help Others, Please Share


Like/Subscribe us for latest updates or newsletter 


