| |

MATLAS xticksIntroduction:MATLAB is a powerful and versatile programming language commonly used for numerical computing, data analysis, and visualization. One key aspect of creating effective visualizations is controlling the appearance of the axis ticks. In this guide, we will delve into the intricacies of working with xticks in MATLAB. What are xticks?In MATLAB, xticks is a function that is used to set or query the x-axis tick locations for a plot. The x-axis ticks are the specific values or positions on the x-axis where tick marks are placed. Tick marks are small markers or labels that help in identifying specific points on the axis. Here is the basic syntax for using xticks: Ticks: This parameter specifies the locations on the x-axis where you want to place the tick marks. It can be a vector of numeric values representing the positions of the ticks. You can use this function to customize the appearance of the x-axis ticks in your MATLAB plots. For example: In this example, xticks sets custom tick locations on the x-axis, and xticklabels provides labels for those ticks. Output: 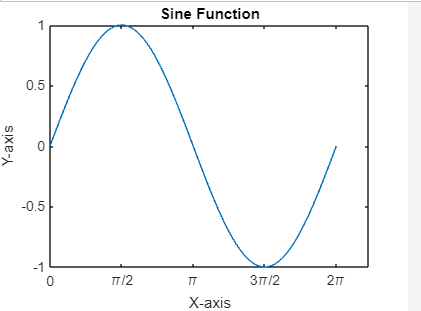
You can also use xticks without providing any input to get the current x-axis tick locations: Basic xticks manipulationTo set custom sticks, you can use the sticks function in MATLAB. For example: Output: 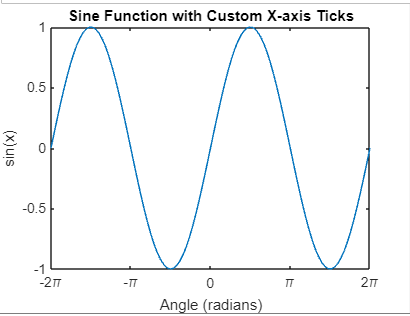
In this example: We create a vector x with values ranging from -2*pi to 2*pi. We calculate the corresponding y values using the sine function. We plot the sine function using plot(x, y). We use xticks to set custom x-axis tick locations at -2*pi, -pi, 0, pi, and 2*pi.We use stick labels to add labels to the custom ticks. Common Use Cases:
Advanced xticks TechniquesDatetime Axis:MATLAB's datetime objects allow you to work with dates and times flexibly. The caldays function generates datetime values.xticks and xtickformat are used to specify tick locations and format the tick labels on the x-axis, respectively.
However, this technique is best suited for datasets with a time-related context. If applied inappropriately, it might not provide meaningful insights, and the user should be cautious about the potential misinterpretation of non-time-related data. Example: Output: 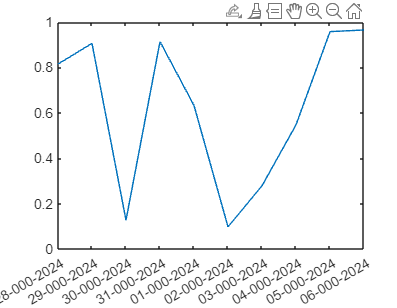
Logarithmic Scale:When dealing with data that spans several orders of magnitude, use a logarithmic scale on the x-axis.
One significant advantage is the effective emphasis on changes in smaller values while preventing larger values from dominating the visualization. This is particularly useful in scenarios such as seismic data analysis, where small earthquakes are of interest alongside larger ones. However, users must exercise caution, as the logarithmic scale may distort the perception of the data if not used appropriately. Example: Output: 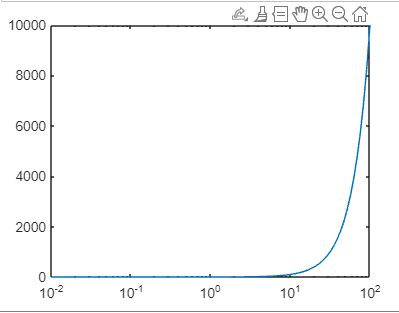
Custom Tick Labels:Customize the appearance of tick labels, including LaTeX symbols and formatting. Customizing tick labels involves using LaTeX-style formatting for mathematical symbols and expressions. The xticklabels function sets custom labels for specific tick locations, and xtickangle rotates the tick labels for better readability.
The advantage lies in the improved interpretability of the plot, as users can choose labels that convey relevant information. For instance, in a plot of trigonometric functions, using custom tick labels for angles in radians enhances the understanding of the data. However, manual specification of tick labels may be time-consuming for large datasets, and users should strike a balance between customization and practicality. Example: Output: 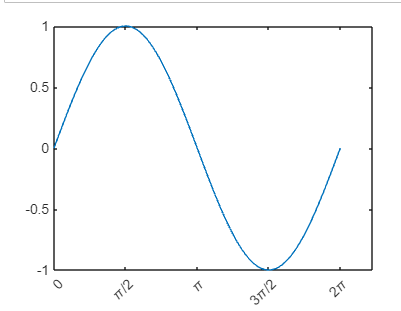
Dynamic Tick Locations:Adjust x-axis ticks dynamically based on the data range. Dynamically adjusting x-axis ticks based on the data range helps improve the plot's clarity. The slim function sets the x-axis limits, and sticks are used to specify tick locations within that range.
The advantage lies in the adaptability to varying data ranges, preventing overcrowding or sparse distribution of ticks. However, users should be cautious about the automatic adjustment of tick locations, as it may lead to unexpected results if not well understood or controlled. Example: Output: 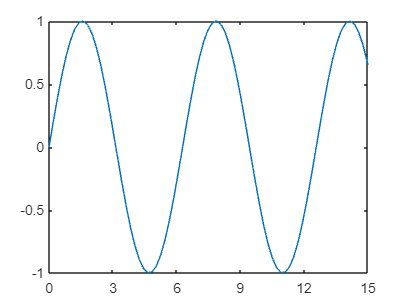
Ticks with Units:When dealing with large or small numbers, displaying ticks with appropriate units or scientific notation is beneficial. xticks and stick labels are used to specify the tick locations and their corresponding labels. Scientific notation is applied to express ticks in a compact form.
Display ticks with appropriate units. Output: 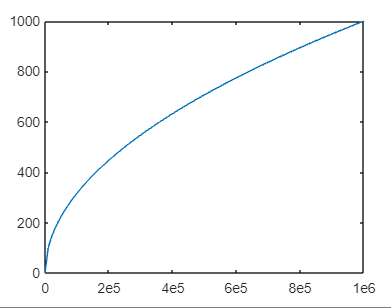
These advanced techniques provide more flexibility in customizing x-axis ticks based on the specific characteristics of your data. Explore the documentation for each function to discover additional options and features. Avoid clutter with fewer xticksWhile it's essential to have informative xticks, overcrowding the x-axis with too many ticks can lead to a cluttered plot. Consider reducing the number of xticks to maintain readability. Here, xticks are set at intervals of 2 to simplify the appearance of the x-axis. 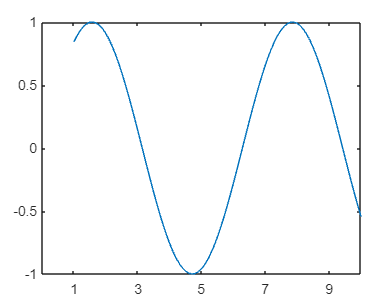
Consistent xticks across subplots When creating subplots, maintaining consistent xticks across all plots can improve the overall coherence of your figures. Use linkages to synchronize x-axis limits and ticks: Here, linkages ('x') ensure that the x-axis limits and ticks are consistent between the two subplots. 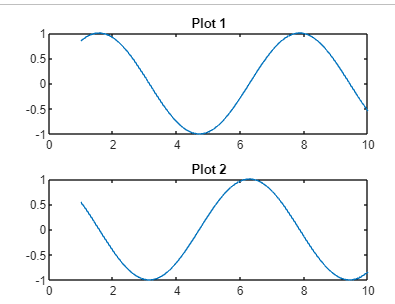
Saving and exporting customized plotsAfter customizing your plot with the desired xticks, it's crucial to save or export the figure for further use. MATLAB supports various file formats, such as PNG, PDF, and EPS. Use the saveas function to save your plot: This command saves the current figure (GCF) as a PNG file named 'custom_plot.png.'
With these skills, you'll be well-equipped to produce professional-quality visualizations tailored to your specific needs. Advanced Techniques for xticks CustomizationMultiple x-axes In some cases, you may need to display multiple x-axes on the same plot, each with its own set of ticks and labels. This can be achieved using the ax = gca and ax2 = axes('Position,' ax. Position, 'XAxisLocation,' 'top,' 'YAxisLocation,' 'none') commands. The following example demonstrates this: Here, two plots share the same y-axis but have different x-axiss. Adjustments to xticks and labels are applied separately to each x-axis. 
Discontinuous x-axisIn some scenarios, you might encounter datasets with gaps or discontinuities in the x-axis. MATLAB allows you to visualize such data effectively by breaking the x-axis. The break axis function, available on the MATLAB File Exchange, enables this feature: In this example, the x-axis is broken between the ranges of 5 and 7, clearly illustrating the data gap. 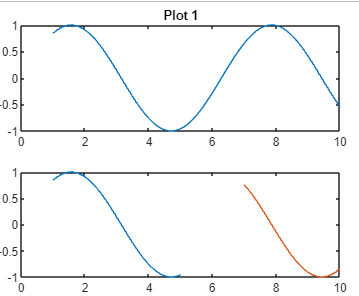
Customizing xticks Appearance in 3D Plots3D plots with xticksWhen working with 3D plots, xticks customization can be applied similarly. Consider this example: Output: 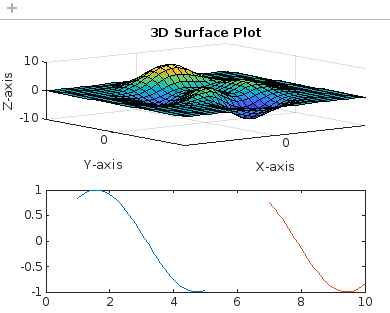
Here, sticks, sticks, and sticks are employed to set specific ticks on the x, y, and z-axes, respectively, in a 3D surface plot. Advantages and disadvantages
Next TopicMatlab ksdensity
|
 For Videos Join Our Youtube Channel: Join Now
Feedback
- Send your Feedback to [email protected]
Help Others, Please Share


