| |

Matlab gcaIntroduction:The gca function plays a crucial role in MATLAB when plotting and manipulating graphical objects. GCA stands for "get current axes," and it is used to retrieve the handle to the current axes in a MATLAB figure. Axes are the bounding boxes with ticks and labels that contain the plotted data in MATLAB figures. Basic Usage:The basic syntax of the gca function is simple: ax = gca; This line of code retrieves the handle to the current axes and stores it in the variable ax. Once you have the handle to the current axes, you can use it to modify various properties of the axes, such as changing axis limits, adding labels, titles, or annotations, setting plot appearance, and much more. Practical Examples:Let's look at some practical examples to understand how GCA can be used: Changing Axis PropertiesOutput: 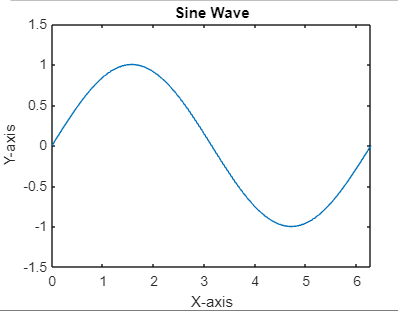
In this example, we plot a sine wave and then use gca to retrieve the handle to the current axes. We then set the limits for the x and y axes, add labels to the axes, and set a title for the plot. Example: Output: 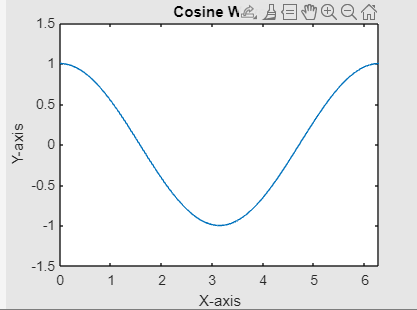
Customizing Plot AppearanceOutput: 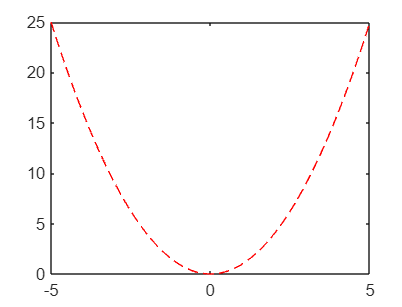
Here, we plot a simple quadratic function and customize the appearance of the plot. We use gca to access the current axes and then modify the font size of the axes ticks and the title font weight. Additional Functions:Alongside gca, MATLAB provides several related functions for working with axes: gcf: Get a handle on the current figure. Cla: Clear current axes. clf: Clear current figure. axis: Set or query axis limits. xlabel, ylabel, zlabel: Add labels to the x, y, and z axes, respectively. title: Set a title for the plot. Example:Output:
Explanation: Sine Wave Plot:
Quadratic Function Plot:
The GCA function in MATLAB is a powerful tool for accessing and manipulating axes properties in figures. By understanding how to use gca effectively, you can customize your plots, adjust axis limits, and add labels and titles, ultimately enhancing the clarity and visual appeal of your graphical representations in MATLAB. Whether you're a beginner or an experienced MATLAB user, mastering gca can significantly improve your data visualization skills.
Next TopicMatlab Secant
|
 For Videos Join Our Youtube Channel: Join Now
Feedback
- Send your Feedback to [email protected]
Help Others, Please Share


