MATLAB - Butterworth Lowpass Filter in Image Processing
A Butterworth lowpass filter is frequently used in image processing to remove high-frequency noise while maintaining the low-frequency components to smooth an image.
Due to its gentle transition between the pass and stop bands, which aids in eliminating unwanted artifacts like ringing, this frequency-domain filter is especially helpful. In this context, we'll examine the MATLAB steps required to create a Butterworth.
Lowpass Filter, emphasizing the importance of each step.
Step 1: First, enter the image by reading and comprehending it.
- The first step entails utilizing MATLAB's imread function to read an input image. Further computations need to comprehend the image's dimensions.
Step 2: Saving Image Dimensions.
- The image's dimensions (M x N), where M stands for the number of rows (image height) and N for the number of columns (image width), are recorded. Different filter calculations make use of these dimensions.
Step 3: The third step is the input image's Fourier transformation.
- The input image is subjected to a 2D Fast Fourier Transform (FFT) using MATLAB's fft2 function.
- By shifting the image data from the spatial to the frequency domain, this transformation makes it simpler to work with the frequency components.
Step 4: Setting the Order and Cut-off Frequency in Step Four.
- The Butterworth filter's order (n) and cut-off frequency (D0) are given. These factors greatly influence the behavior of the filter.
- A greater order increases the transition's incline,
Step 5: Designing the Butterworth Filter.
- The Butterworth lowpass filter uses a mesh grid of frequency coordinates (u, v).
- This grid makes it easier to determine each frequency point's Euclidean Distance (D) from the origin.
- The transfer function of the filter is then calculated using the provided formula.
Step 6: Convolution using the Filtering Mask.
- The filtering mask (H) and the Fourier converted input image (FT_img) are combined using element-wise multiplication.
- The frequency domain filtering technique efficiently reduces high-frequency noise and preserves low-frequency data.
Step 7: Inverse Fourier Transform.
- The inverse FFT converts the convoluted image from the frequency domain (G) back to the spatial domain.
- This conversion is made easier by the ifft2 function, producing a picture that displays the
Step 8: Presenting the Outcome.
- Using MATLAB's subplot and imshow functions, the original input image and the processed result image are displayed side by side.
- This makes it possible to compare the Butterworth lowpass filtering technique results visually.
Butterworth Lowpass Filter implementation in MATLAB entails actions that use frequency domain processes to improve images.
- The Butterworth filter stands out from its competitors due to the gentle transition between the pass and stop bands, which makes it a good option for noise reduction while minimizing undesired artifacts.
- Users can fine-tune the filter's behavior to get the best results for a particular image by changing the order and cut-off frequency.
Implementation:
Output:
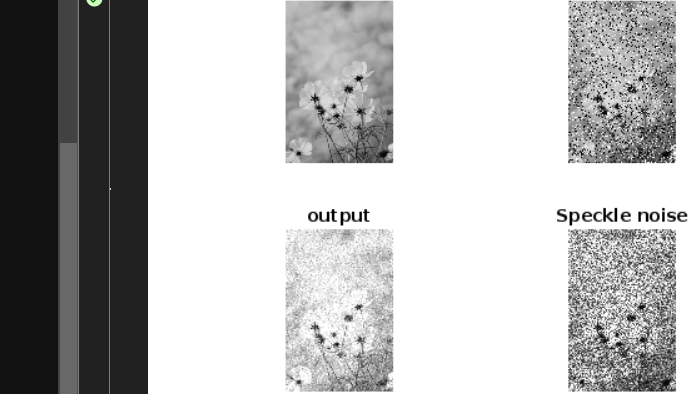
AFTER READING AN INPUT IMAGE, this MATLAB program applies a Butterworth Low Pass Filter. The filter's order and cut-off frequency can be changed to achieve the required level of smoothing and noise reduction.
- The crucial procedures involve calculating the filter's transfer function, convolution in the frequency domain, and inverse Fourier transformation to generate the filtered image.
- The original input image and the output are then shown side by side for comparison.
| 
 For Videos Join Our Youtube Channel: Join Now


