MATLAB 3D Plots
MATLAB also includes a wide variety of three-dimensional plots that can be useful for displaying certain types of data. In general, three-dimensional plots are helpful for displaying two types of data:
- Two variables that are functions of the same independent variable, when you wish to emphasize the importance of the independent variable.
- A single variable that is a function of two independent variables, z = f (x, y).
To get the z, first, we have to create a set of (x, y) points using the function meshgrid.
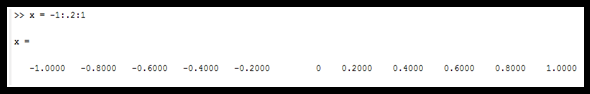
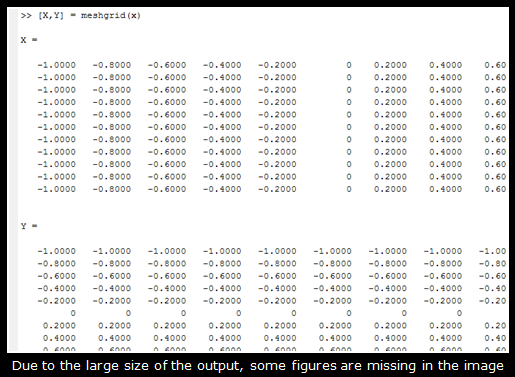
[X,Y] = meshgrid(-1:.2:1);
Here the argument in the function meshgrid is a vector, created using colon operator (start: step: end)
The meshgrid function can take up to three vector arguments and returns 2-D coordinates based on the coordinates of vectors in the argument.
Meshgrid Function
| Grid coordinates set (matrix) |
Function |
Vector coordinates |
Grid length |
[X,Y],
X & Y are matrices, where each row is a copy of x, and each column is a copy of y respectively. |
=meshgrid(x,y), returns 2-D grid coordinates based on x & y |
Coordinates of Vector x and y |
No. of rows in X & Y = length(y),
No. of columns in X & Y = length(x) |
[X,Y],
X & Y are matrices, where each row and column is a copy of x. |
=meshgrid(x), equivalent to meshgrid(x,x), and returns square 2-D grid coordinates based on x |
Coordinates of Vector x |
Grid size = length(x) by length(x) |
| [X, Y, Z], X have coordinates of x, Y have coordinates of y, and Z have coordinates of z |
=meshgrid(x,y,z), returns 3-D grid coordinates based on vectors x, y, & z |
Coordinates of Vectors x, y, and z. |
Grid size = length(y) by length(x) by length(z) |
[X,Y,Z],
All have same coordinates of x |
=meshgrid(x), is same as meshgrid(x,y,z) in the form of meshgrid(x,x,x) |
Coordinates of Vector x |
3-D grid size = lenght(x) by length(x) by length(x) |
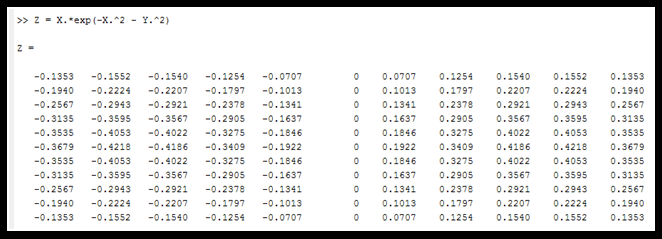
Now evaluate Z to create 3-D plot:
Z = X.*exp(-X.^2 - Y.^2); % dot. Operator is used to performing the element-wise calculation.
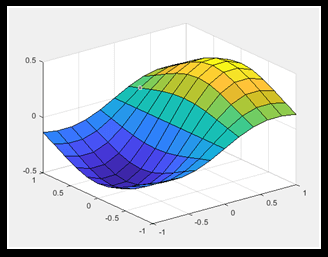
Now we will create a 3-D surface plot by using function surf(X, Y, Z).
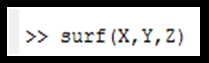
By entering the surf function, it will generate a 3-D surface plot.
- surf(X,Y,Z) function creates a 3-D surface plot.
- The values of the matrix Z is used as heights above a grid in the x-y plane.
- The function also uses Z for the color data in proportion to height.
- There is one more function, mesh, and that also displays surfaces in three-dimensions.
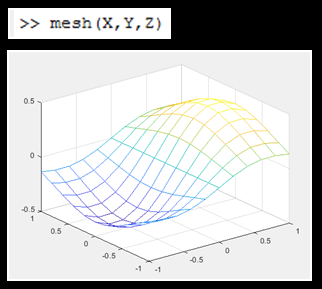
- The main difference between surf and mesh functions is that surf shows both the connecting lines and the faces of the surface in color, while mesh function produces wireframe surfaces. The mesh function doesn't color the entire surface; it colors only the lines connecting the defining points.
|

 For Videos Join Our Youtube Channel: Join Now


