| |

Matlab find peaksIntroductionIn the realm of data analysis and signal processing, the ability to identify peaks within datasets is a crucial task. MATLAB, a prominent numerical computing environment, offers a powerful tool for this purpose: the findpeaks function. This function goes beyond simple data examination, providing a sophisticated mechanism to pinpoint local maxima and allowing researchers, engineers, and data scientists to extract meaningful insights from their data. Understanding the BasicsThe fundamental purpose of the findpeaks function is to locate peaks in a given dataset. The syntax is relatively straightforward: Here, data represents the input vector, pks holds the amplitude values of the identified peaks and locs contains the indices of these peaks in the original data. Parameters for PrecisionWhile the basic usage of findpeaks is powerful, its flexibility is further enhanced by additional parameters that allow users to fine-tune the identification process. Threshold The Threshold parameter lets users set a minimum amplitude for peaks to be considered. This is particularly useful in filtering out small fluctuations in the data, ensuring that only significant peaks are identified. MinPeakDistance: The MinPeakDistance parameter specifies the minimum separation between identified peaks. By setting this parameter, users can prevent the algorithm from recognizing closely spaced peaks as distinct entities, thus enhancing precision. MinPeakHeight Setting a MinPeakHeight establishes a threshold for the prominence of identified peaks. This is particularly useful in noisy datasets, where small peaks may not be indicative of significant features. Practical ApplicationTo illustrate the practical application of findpeaks, consider a scenario where you have a dataset representing a signal with added noise. Let's generate an example: Output: 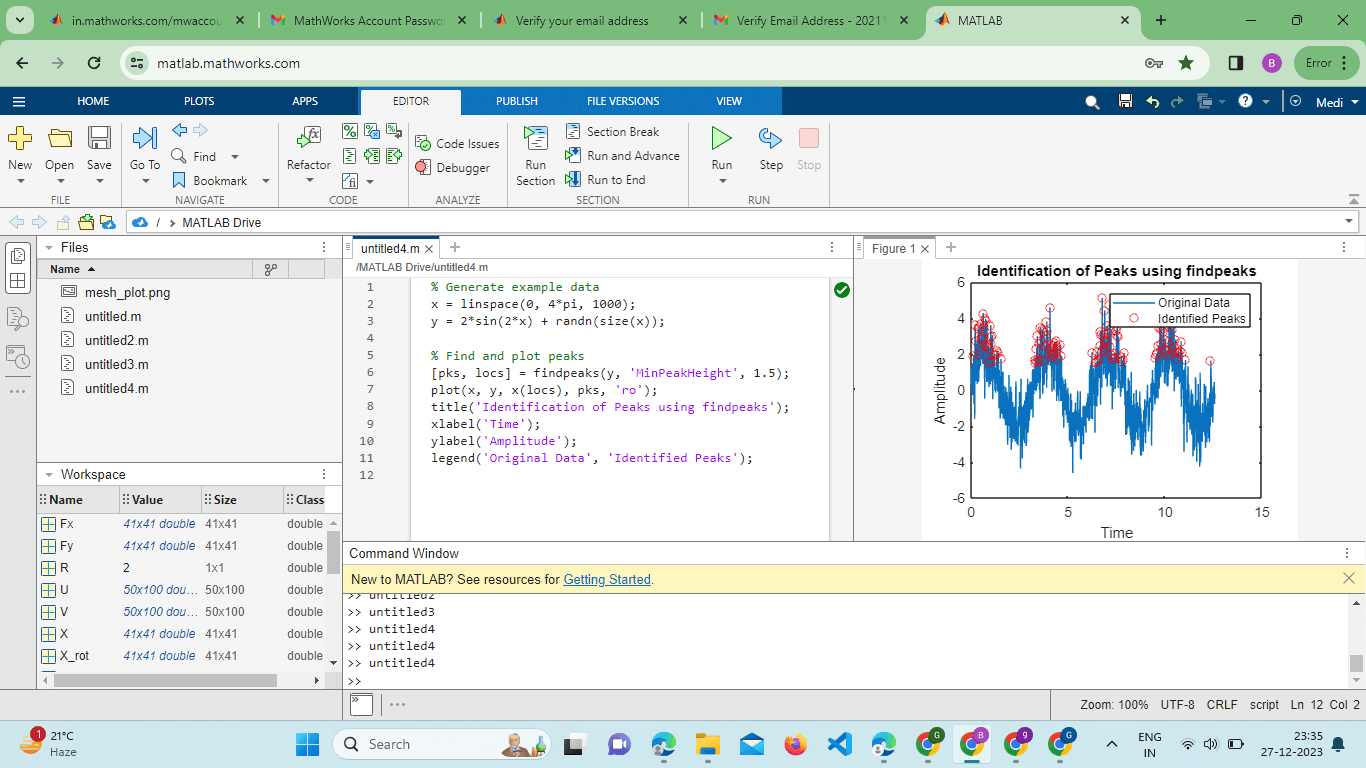
In this example, a sinusoidal signal with added noise is created. The findpeaks function is then applied, with a minimum peak height set to 1.5. The identified peaks are plotted alongside the original data. Advanced FeaturesMultiple Output Arguments The findpeaks function supports multiple output arguments, providing users with comprehensive information about the identified peaks. In addition to parks and locs, it can also return the width and prominence of each peak: Here, widths contain the widths of the identified peaks, and proms hold the prominence values. Plotting Peak Characteristics To gain a visual understanding of the identified peaks, users can plot the characteristics of each peak using the plot function: This overlays the identified peaks on the original data, providing a graphical representation of the peak locations and extents. Implementation:Output: 
Explanation: y is the data for which we want to find peaks.x is the corresponding x-axis value. Find peaks (y, x) returns two outputs: peaks containing the values of the peaks and peak_locs containing the corresponding indices of the peaks. The scatter function is then used to mark the identified peaks on the plot. Real-world ApplicationsThe findpeaks function finds application in various domains, each benefiting from its unique capabilities. Signal Processing In signal processing, identifying peaks is essential for feature extraction. Whether analyzing biomedical signals or detecting anomalies in sensor data, findpeaks aids in isolating critical points within the signal. Environmental Monitoring In environmental monitoring, datasets often exhibit peaks that correspond to significant events. This could include spikes in pollution levels, abnormal weather patterns, or irregularities in ecological data. findpeaks becomes a valuable tool in uncovering these noteworthy occurrences. Finance and Economics Financial time series data often contains peaks that signify market trends, volatility, or specific events. Traders and analysts can leverage find peaks to identify critical points in the data, aiding in decision-making processes. Audio Signal Processing In audio analysis, identifying peaks can help recognize musical notes, speech patterns, or anomalies in sound recordings. findpeaks proves invaluable in extracting meaningful information from complex audio datasets. Optimization Strategies For large datasets or computationally intensive applications, optimizing the performance of findpeaks is crucial. Employing parallel computing capabilities or utilizing the Signal Processing Toolbox can significantly enhance the speed of peak identification. Signal Processing Toolbox For advanced signal processing tasks, the Signal Processing Toolbox offers additional functions that complement findpeaks. Combining these tools enhances the analytical capabilities, allowing for more intricate analysis of complex datasets.
By understanding the intricacies of finding peaks and their optimization strategies, users can unlock their full potential, gaining valuable insights from their data and pushing the boundaries of what is possible in the realm of numerical computing.
Next TopicMatlab mesh()
|
 For Videos Join Our Youtube Channel: Join Now
Feedback
- Send your Feedback to [email protected]
Help Others, Please Share


