| |

Matlab PatchIntroductionMATLAB stands tall as one of the most powerful and versatile tools available. It offers a vast array of functions and capabilities for engineers, scientists, and researchers to analyze data, create simulations, and visualize results. Among its many functions, the patch function holds a special place, allowing users to create and manipulate patches in 2D and 3D space. This comprehensive guide aims to explore the intricacies of the MATLAB patch function, from its basic syntax to its advanced applications. What is a Patch in MATLAB?In MATLAB, a patch is a graphical object that represents a 2D or 3D shape consisting of vertices and faces. It is a fundamental building block for creating complex visualizations, such as plots, surfaces, and custom graphical elements. A patch is a generalization of basic shapes like rectangles, circles, and polygons, allowing for more flexibility and creativity in design.
Syntax:The basic syntax of the patch function in MATLAB is relatively straightforward. It follows this general format: Where:
Creating a Simple PatchLet's start with a simple example to illustrate the basic usage of the patch function. Suppose we want to create a square patch with vertices at (0, 0), (1, 0), (1, 1), and (0, 1), and we want it to be filled with a solid color. We can achieve this as follows: In this example:
Running this code will create a red square patch in the current axes. Specifying Face ColorThe patch function allows for various ways to specify the face color of the patch. You can use color names (like 'r' for red, 'g' for green, 'b' for blue, etc.), RGB triplets, or hexadecimal color codes. For example, to create a blue square patch, you can use either of the following: Additional Parameters Besides specifying the vertices and face color, the patch function offers additional parameters to customize the appearance of the patch. Some common parameters include:
Implementation: Customizing Patch Properties Output: 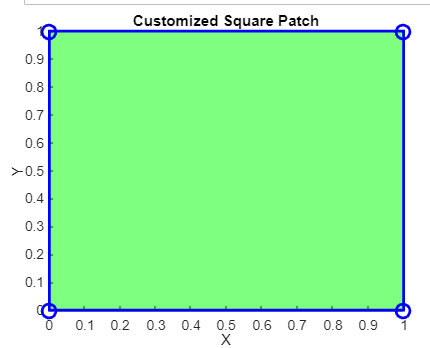
Explanation: Here, we create a square patch with customized properties:
Implementation: Creating an Approximate Circle Output: 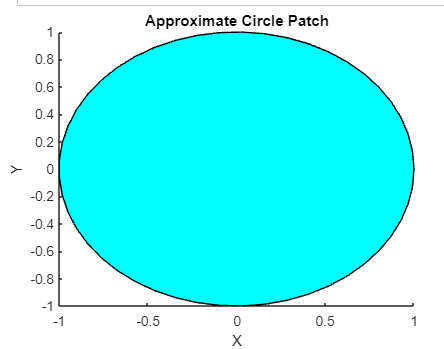
Explanation:
Creating Complex Shapes with MATLAB PatchWhile simple squares and rectangles are useful, the real power of the patch function lies in its ability to create complex shapes and polygons. By defining the coordinates of multiple vertices and arranging them in the desired order, you can create almost any shape imaginable. Creating a Triangle Let's create a triangle patch with vertices at (0, 0), (1, 0), and (0.5, 1), filled with a yellow color: Creating a Circle While MATLAB doesn't have a built-in function to create circles directly with a patch, we can approximate a circle by creating a regular polygon with a large number of sides. Here's an example of creating an approximate circle with 50 sides: Customizing Patch Properties To further customize the appearance of patches, you can use additional properties of the patch function. For instance, you can adjust the edge color and line style, add markers at vertices, and control the transparency of the patch. In this example:
Advanced Applications of MATLAB Patch FunctionVisualizing Data with Patch The patch function is invaluable for visualizing data in MATLAB. For example, you can use it to create filled contour plots where different colors represent different data ranges. This is especially useful for displaying geographical data, heat maps, and other types of continuous data. Creating 3D Surfaces In addition to 2D patches, the patch function can also create 3D surfaces by specifying the Z coordinates of the vertices. This allows for the creation of complex 3D shapes and models. Animations and Simulations For dynamic visualizations and simulations, the patch function can be used to create moving or changing shapes. Output: 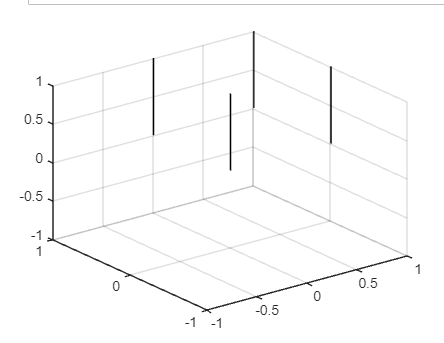
Engineering and Scientific Applications In engineering and scientific fields, the patch function finds wide applications. It can be used to visualize finite element analysis (FEA) results, represent complex geometries in simulations, create custom plotting styles for research papers, and more.
Whether you are just starting with MATLAB or looking to enhance your skills, experimenting with the patch function provides an excellent opportunity to explore the richness and depth of MATLAB's graphical capabilities. So, dive in, create, and discover the power of patches in MATLAB.
Next TopicMATLAB Reshaping
|
 For Videos Join Our Youtube Channel: Join Now
Feedback
- Send your Feedback to [email protected]
Help Others, Please Share


