| |

Draw Countries Flags Using MATLABMATLAB makes the creation of flags with precise proportions and colors possible by utilizing its graphic tools and image-processing capabilities. Flags from different nations can be represented visually using MATLAB, an efficient programming language. Here, we'll look at how to draw several flags while showing their distinctive patterns and symbolism. Drawing the Indian Flag Using MATLABThe tricolor Tiranga, also known as the national flag of India, has a navy blue Ashoka Chakra in the middle of three horizontal stripes of saffron, white, and green. To depict the nation's rich cultural and historical significance, it is necessary to faithfully reproduce these colors and proportions when drawing the Indian flag in MATLAB. Approach:
Implementation: Output: 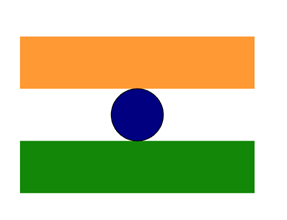
Saffron: The top band of the flag stands for bravery and selflessness. It is a rich, vivid orange color in the flag. White: The center band represents purity, truth, and peace. To preserve the integrity of the flag, it is crucial to depict this white band precisely. Green: The bottom band represents fertility, faith, and wealth. The flag has a deep, rich green color. Ashoka Chakra: The navy blue Ashoka Chakra The Ashoka Chakra, located in the center of the white band, stands for the "wheel of the law" and denotes the nation's ongoing development. Each of its 24 spokes represents a different aspect of movement and life. It is feasible to accurately display the object's intricate design and symbolism with MATLAB's image generation functions and precise color representation. Draw the Austria flag in Matlab.Three horizontal stripes make up the "Bundesflagge," the name given to Austria's national flag. The center stripe is white, and the top and bottom stripes are red. Since the 18th century, Austria has been identified with this tricolor pattern, which is a well-known representation of the history and identity of the nation. The historical importance of red and white is that they stand for bravery and the nation's ongoing fight for freedom and independence. Approach: For drawing the Austrian flag in MATLAB:
Implementation: Output: 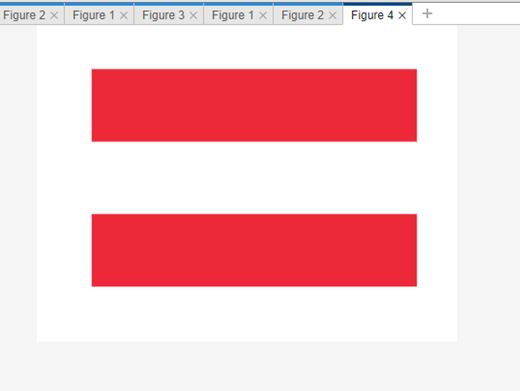
Drawing Bangladesh flag:Follow these instructions to draw the Bangladeshi flag in MATLAB:
Check whether each pixel is contained within the circle using nested loops. If it does, make that pixel's color bright red. Implementation: Output: 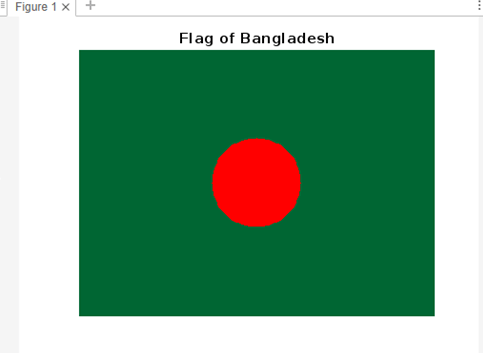
Explanation: Making the Image Matrix: A 3D zero matrix with dimensions 300x400x3 is made to represent the image. In this case, 300 denotes the number of pixels for the rows, 400 denotes the number of pixels for the columns, and 3 denotes the RGB format's three color channels. Background Color: By providing the right values for the red, green, and blue color components, a bottle green background is added to the image matrix. Setting Circle Parameters: The radius and center coordinates of the circle are set. The radius is 50, and the center is at (200, 150). The circle is drawn by iterating through each pixel in the image using nested loops. If the pixel is contained within, the red, green, and blue components are adjusted to make the area inside the circle a vivid red color. Drawing Japanese FlagThe steps to draw the Japanese flag in MATLAB are as follows: Make an image matrix: Produce a 300x400x3-dimensional (3-dimensional) matrix of zeros to represent the image.
Draw the Circle: Iterate through each pixel in the image using nested loops. Using the circle equation, determine whether the pixel is inside the circle's perimeter, and if it is, change its color to a bright red one. Implementation: Output: 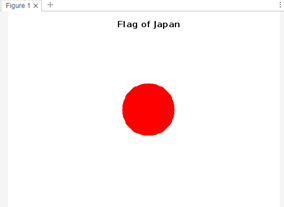
Defining Circle Parameters: The circle's radius is 50, and its center coordinates are (200, 150). Drawing the Circle: The code iterates through every pixel in the 300x400 picture matrix using nested loops. The code sets the RGB values to generate a brilliant red circle by determining whether the pixel is within the limits of the circle using the equation of a circle. Displaying the Flag: The imshow() function displays the final image matrix, which now includes the red circle. The exhibited image has the addition of the title "Flag of Japan" for clarification. Drawing the Sweden Flag using MatlabA colored image is represented as a 3D matrix in MATLAB. The first dimension of an image corresponds to its rows, the second to its columns, and the third to the color information included in each pixel. The third dimension for the RGB color format specifically consists of three numbers that, when combined, represent the relative intensities of the Red, Green, and Blue hues. Approach:Each element in this 3D matrix can be recognized by its row, column, and three color values. The construction, alteration, and viewing of diverse colored images are made possible by manipulating these parameters. The image's dimensions dictate the matrix's size, with the scale and resolution of the image being reflected in the number of rows and columns. Making a Zero Matrix: Make a 300x600x3-dimensional (3-dimensional) zero matrix. In this case, 300 stands for the number of pixels in the rows, 600 for the number of pixels in the columns, and 3 for the RGB color coding scheme. Painting the Background Blue: Change the image's values to blue to represent the color. Blue is denoted by the values (0, 0, 255), where the first two values signify the lack of red and green, and the last value indicates full-intensity blue in the RGB format. Making the Horizontal Yellow Bar: Draw a yellow line across the picture. Yellow's RGB representation is (255, 255, 0), which indicates that red, green, and blue are all present in their full strength. Making the Vertical Yellow Bar: Draw a vertical yellow bar on the image using yellow's RGB color code. Implementation: Output: 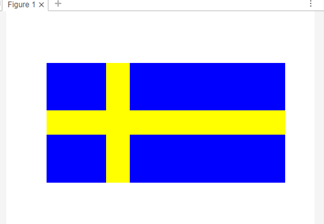
Drawing Seychelles Flag.A colored image can be modeled as a 3D matrix in MATLAB. The first dimension of an image corresponds to its rows, the second to its columns, and the third to the color information included in each pixel. The third dimension for the RGB color format specifically consists of three numbers that, when combined, represent the relative intensities of the Red, Green, and Blue hues.
Making the Matrix: Make a 300x600x3-dimensional (3-dimensional) zeros matrix. In this case, 300 stands for the number of pixels in the rows, 600 for the number of pixels in the columns, and 3 for the RGB color coding.
Implementation: Output: 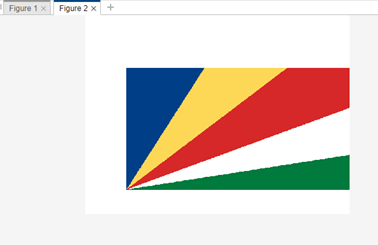
It sets the background to blue, draws diagonal stripes in yellow and white, and then generates a 3D matrix of zeros to represent the image. The Seychelles flag is displayed using the 'imshow' function, and the plot is given a title using the 'title' function. Drawing Switzerland flagApproach: Create a 3D matrix with the initial values of 30x50x3. Each pixel's RGB values are represented by the three dimensions, where 30 specifies the number of rows, 50 denotes the number of columns, and 3 identifies the red, green, and blue color channels.
Explanation: The process entails building a matrix depicting the flag with specific dimensions corresponding to the flag's size. The matrix appropriately depicts the colors of the Swiss flag by allocating the correct RGB values. The distinctive cross emblem, a distinguishing feature of the Swiss national flag, is created by the insertion of the white bars, both horizontally and vertically. The 3D matrix representation accurately depicts the flag's design and layout by carefully controlling and modifying individual pixel colors. Implementation: Output: 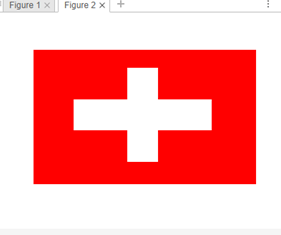
This line transforms the array into an unsigned 8-bit integer type, I = uint8(I);. The 'uint8' class in MATLAB limits each color channel's value range to be between 0 and 255, which is the typical range for pixel values in images.
Drawing Kuwait FlagApproach: A colorful image may be represented in MATLAB as a three-dimensional matrix, where the first dimension corresponds to the rows, the second to the columns, and the third to the color of the corresponding pixel. Red, Green, and Blue each have three values in the third dimension for the RGB color system. The intended size of the image determines the values of the rows and columns.
Explanation:
Implementation: Output: 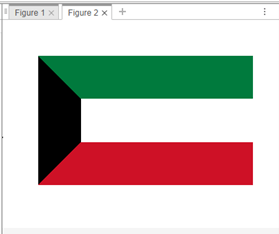
I = uint8(zeros(300, 500, 3)); initializes a 3D matrix I with dimensions 300x500x3, and all entries are set to zero. Green Horizontal Bar: The following set of lines sets the values of the pixels in the (1:100, 101:500) range to represent the green hue found in the Kuwaiti flag. White Bar: The lines after the white horizontal bar define the values of the pixels in the (101:200, 101:500) range as the white color of the flag. Red Bar: To depict the red hue of the flag, the lines then set the values of the pixels in the range (201:300, 101:500).
Next TopicMATLAB Indexing
|
 For Videos Join Our Youtube Channel: Join Now
Feedback
- Send your Feedback to [email protected]
Help Others, Please Share


