| |

MATLAB PlottingPlotting is a graphical representation of a data set that shows a relationship between two or more variables. MATLAB plots play an essential role in the field of mathematics, science, engineering, technology, and finance for statistics and data analysis. There are several functions available in MATLAB to create 2-dimensional and 3-dimensional plots. Creating PlottingMATLAB makes it easy to create plots. For example in 2D, is to take a vector of a- coordinates, a = (a1... an ), and a vector of b-coordinates, b = (b1...bn), locate the points (ai...bi), with i = 1, 2. . . n and then connect them by straight lines. The MATLAB commands to plot a graph is plot (a, b). The vectors a = (0, 1, 2, 3, 4, 5, 6, 7, 8, 9, 10) and b = (0, 1, -1, 1, 0) produce the picture shown in figure. Example: Plot the function sin (a) on the interval [0, 3π], we first create a vector of a values ranging from 0 to 3π, then compute the sine of these values, and finally plot the result: 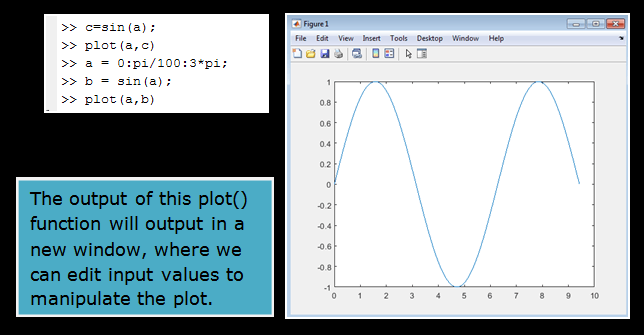
Note: 0:pi/100:3*pi yields a vector that
Adding titles, axis labels, and annotationsMATLAB allows us to add axis labels and titles. For example, using the graphs from the previous example, add and a and b labels. Now labels the axes and add a title. The character \pi generates the symbol π. An example of a 2D plot is shown in the figure. 
The color of a single curve are, by default, blue, but other colors are possible. The desired color is denoted by a third argument. For example, red is picked by plot (x, y,'r'). Note that the single quotes, ' ', around r. Creating Multiple PlotsA plot with more than one line can be created in several methods. The following example demonstrates the concept: Example: The output of multiple data sets in one graph plot is shown in the figure 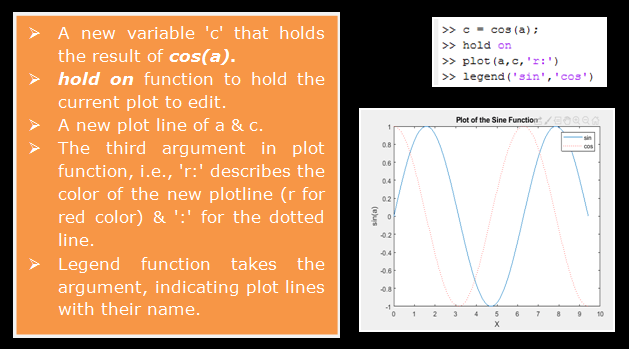
Line, Color, and Mark StyleThe style option in the plot command are a character string that consists of one, two, or three characters that specify the color and line style. There are several color, line, and marker-style options:
The following commands demonstrate the use of line, color, and mark styles: The resulting plot fig (a) consists of a dashed line, together with data points marked with circles. The line, the points, and the circles are drawn in black, as shown in fig (b). 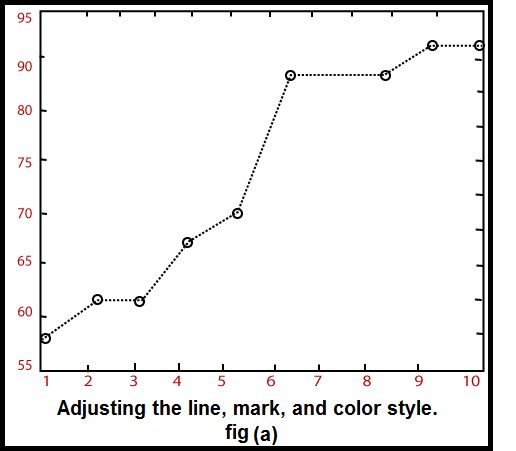

Setting Axis Scales and Annotation PlotsThe axis command allows us to set the axis scales. We can provide minimum and maximum values for x and y axes using the axis command in the following method Example There are also some predefined string arguments for the axis command:
Generating Sub-PlotsWe can use the subplot function to display multiple plots in different sub-regions of the same window. The subplot commands require three integer arguments: Splits the figure into an m x n matrix. The variable p identifies the part of the window where the next plot will be drawn. For example, if the command is used, the window is split into two rows and two columns, and the plot is drawn in the upper left-hand window. 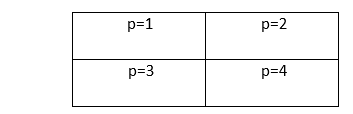
Fig: Subplots are used to subdivide the figure window into an m x n matrix. Example: 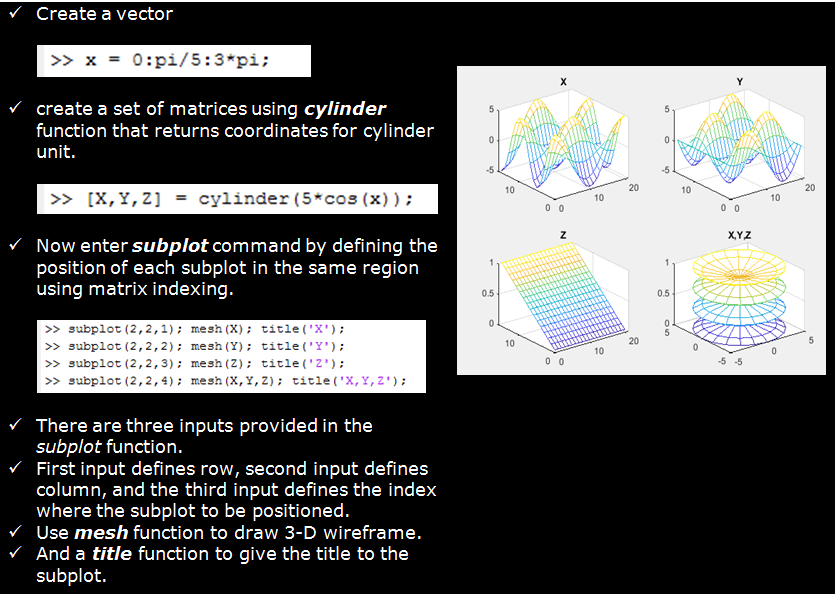
Next TopicMATLAB fplot()
|
 For Videos Join Our Youtube Channel: Join Now
Feedback
- Send your Feedback to [email protected]
Help Others, Please Share


