| |

Matlab mesh()Introduction:MATLAB, a powerful numerical computing environment, provides a rich set of functions for data visualization. One such Function, mesh(), plays a crucial role in creating three-dimensional visualizations of mathematical functions and datasets. This Function is especially valuable in fields like engineering, physics, and mathematics, where the representation of surfaces and functions in three-dimensional space is essential for Analysis and understanding. Overview of the mesh() Function:The mesh() function in MATLAB is primarily used for creating 3D surface plots. Its basic syntax is: Here, X and Y are matrices representing the grid coordinates, and Z is a matrix representing the height or function values at each grid point. Let's delve into the key aspects and capabilities of the mesh() Function. Basic 3D Surface Plot:The fundamental purpose of the mesh() function is to generate 3D surface plots. Consider the following example: Output: 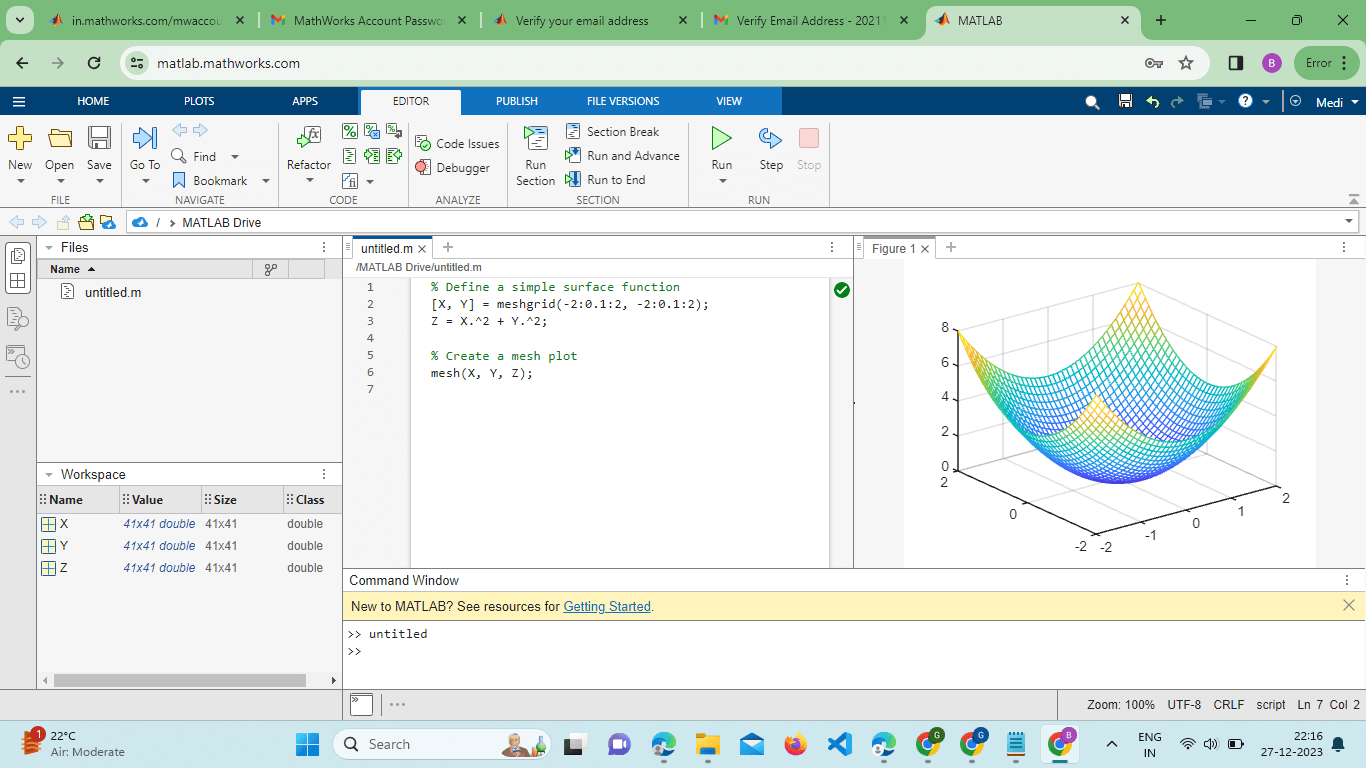
In this example, meshgrid() is used to create a grid of X and Y coordinates, and Z is computed based on a simple mathematical expression. The mesh() function then visualizes this surface. Customizing the Plot:MATLAB's mesh() function allows for extensive customization to enhance the visual representation of the surface plot. Users can modify aspects such as color, shading, and lighting to tailor the visualization to their specific needs. For instance: Output: 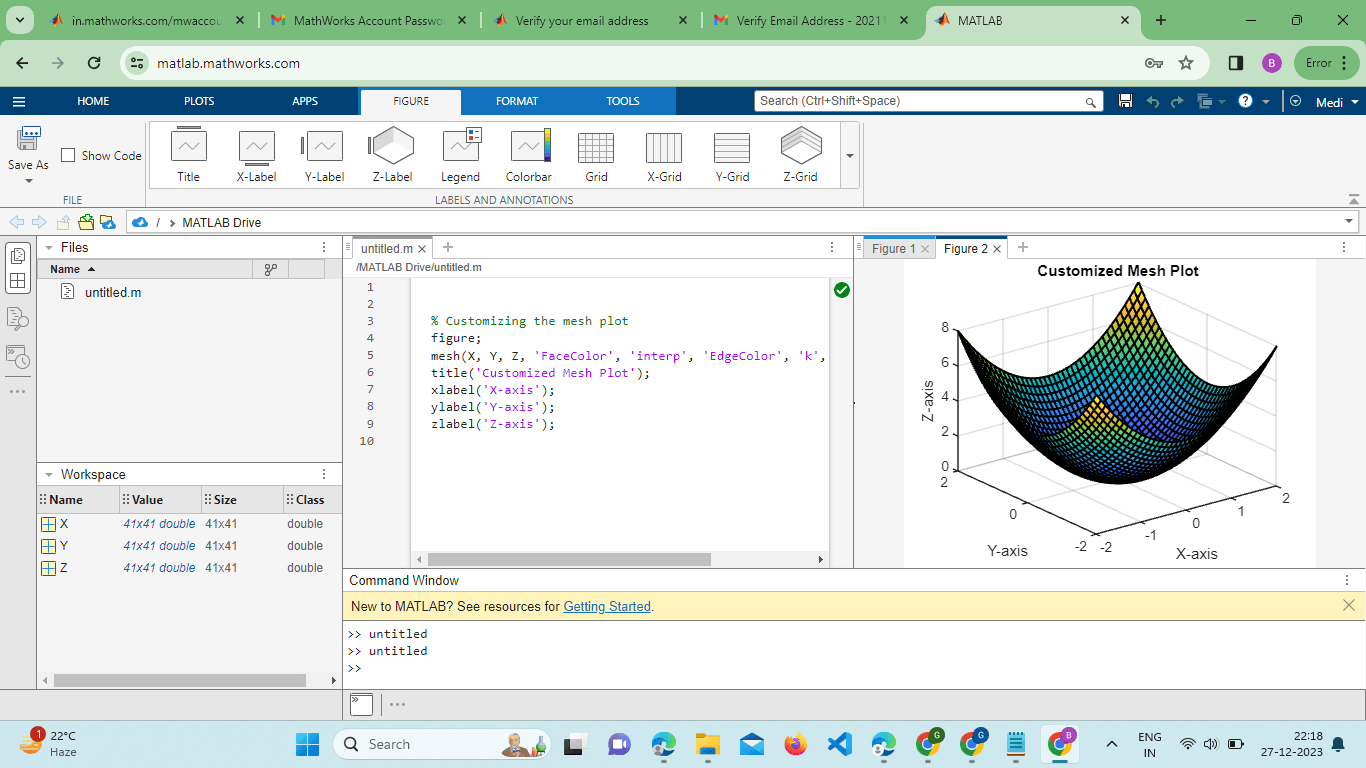
This example demonstrates how to set the face color to interpolate values, adjust the edge color, and specify line width, providing a more polished and informative visualization. Overlaying Multiple Surfaces:The mesh() function supports the overlay of multiple surfaces, enabling the comparison of different datasets or functions within the same plot. This is achieved by calling the Function multiple times with different data matrices or by using the hold-on and hold-off commands. Example: Output: 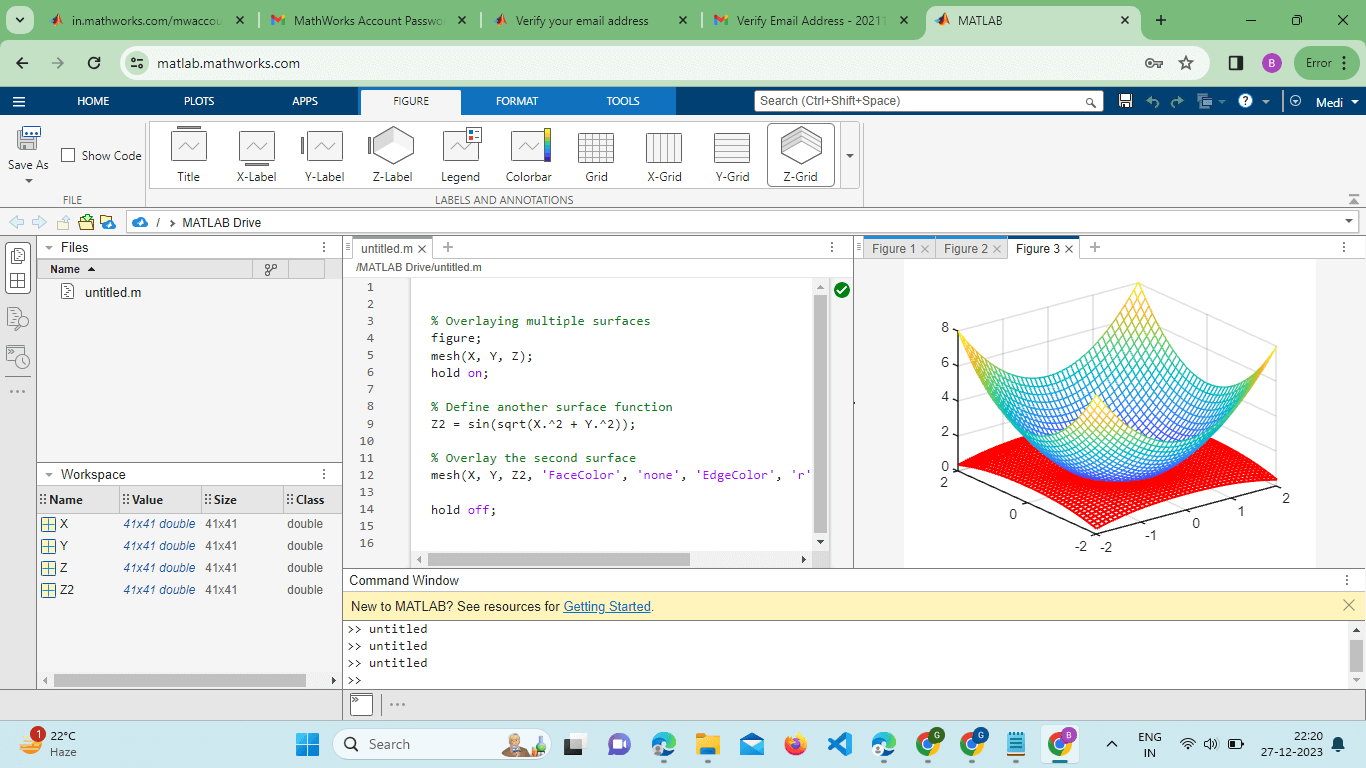
This code overlays two surfaces with different functions, providing a clear comparison between them. Contour Plotting with Mesh:The mesh() function can be combined with contour plots to create a hybrid visualization that displays both the surface and contour lines. This is useful for gaining insights into the structure of the data. Example: Output: 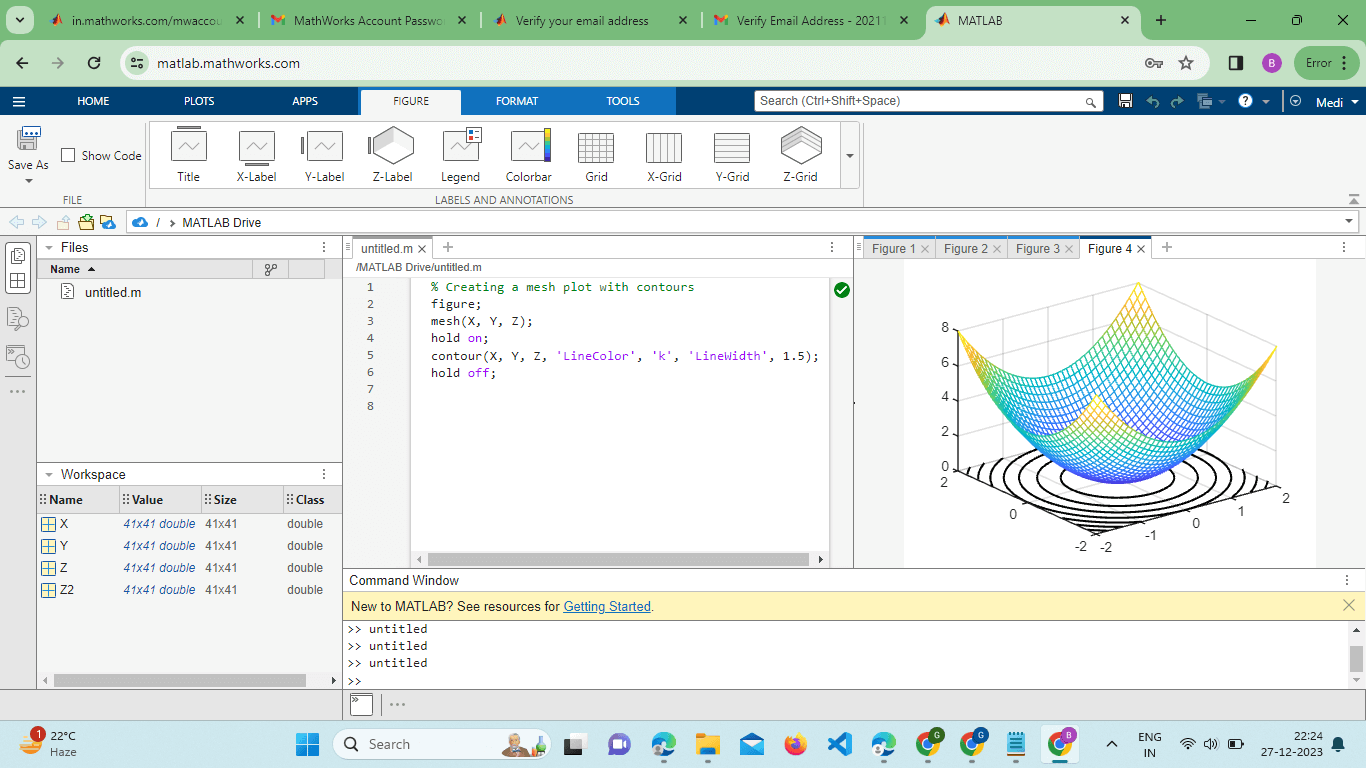
In this case, the contour() function is used in conjunction with mesh() to display contour lines over the 3D surface plot. Meshgrid and Coordinate Transformations:The use of meshgrid() in conjunction with the mesh() function is essential for creating the grid of coordinates necessary for 3D plotting. Understanding how to manipulate these grid coordinates is crucial for effective visualization. Example: Output: 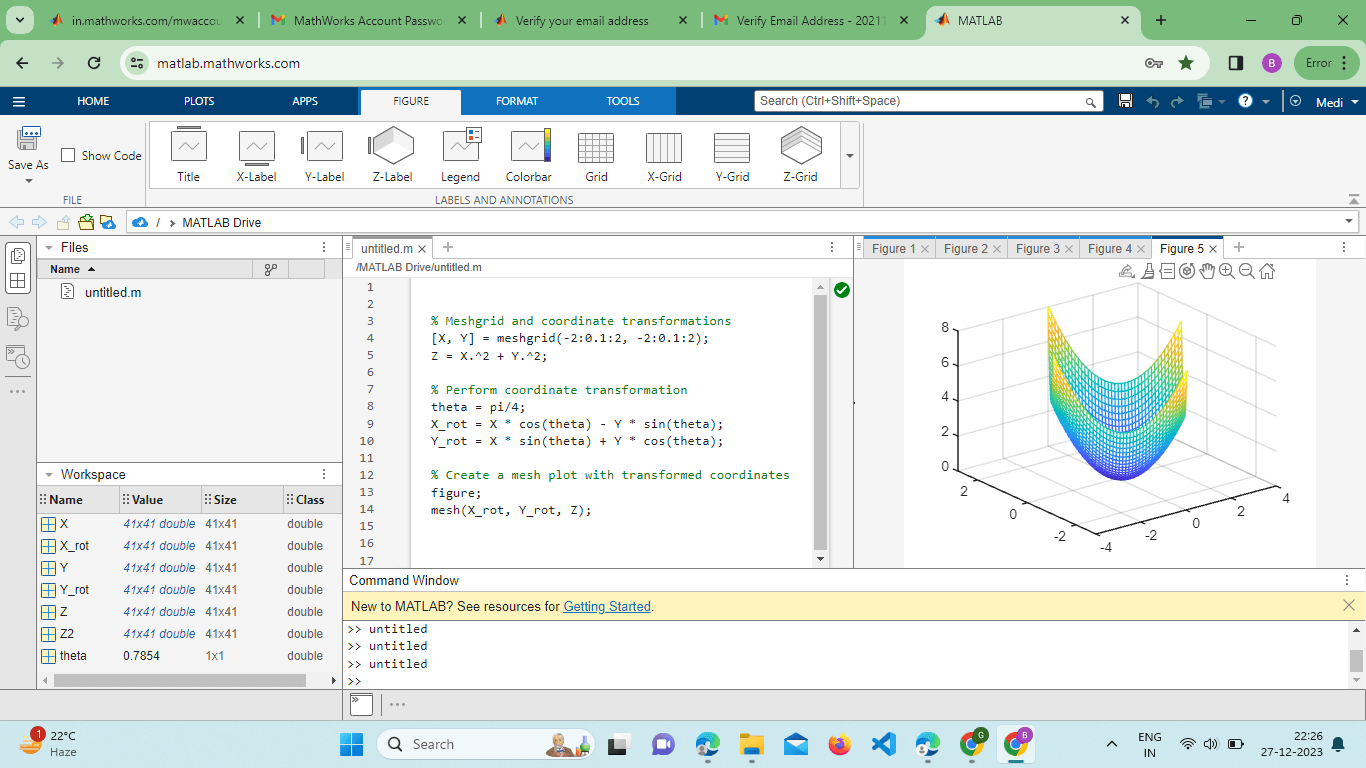
This example demonstrates how to perform a simple coordinate transformation and visualize the modified surface.
Transparency and Face Alpha:The mesh() Function allows users to incorporate transparency in their plots. This can be achieved by adjusting the FaceAlpha property. Example: Output: 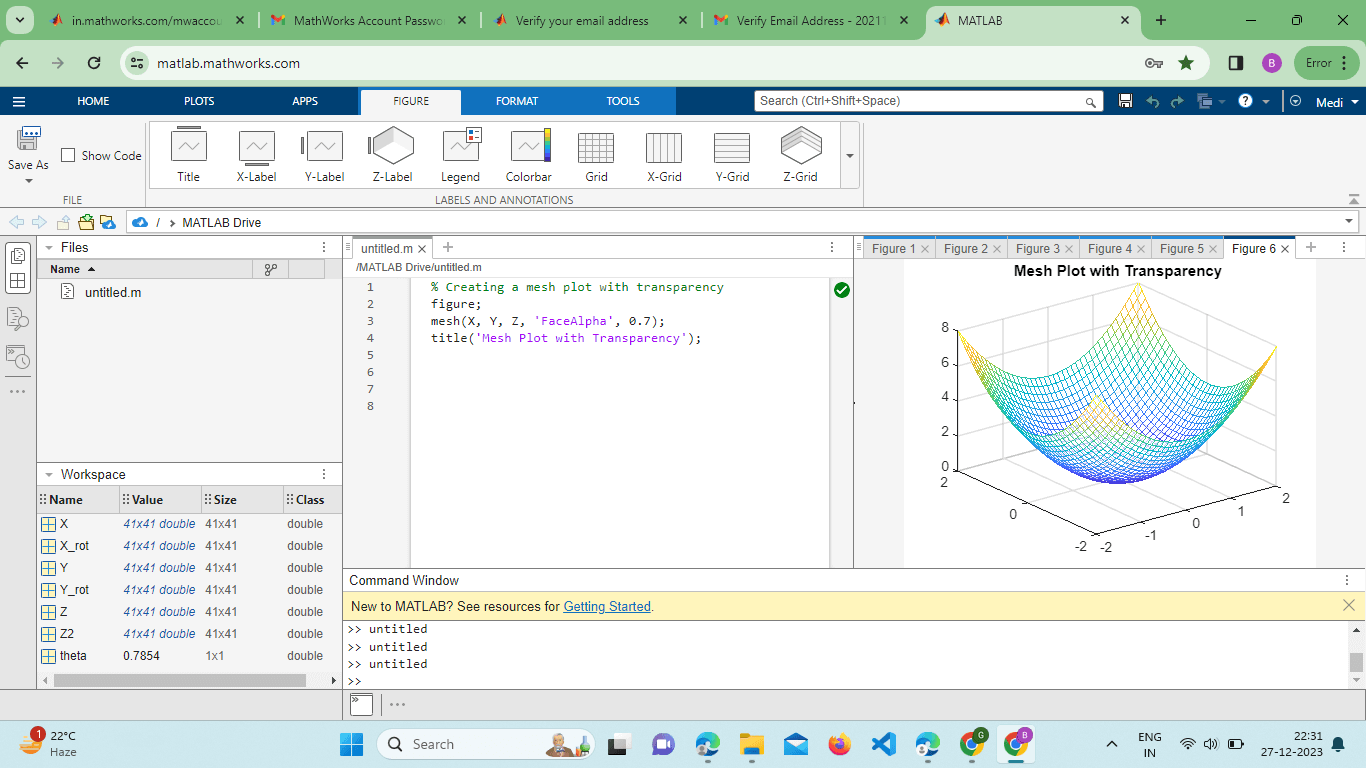
The FaceAlpha property ranges from 0 (completely transparent) to 1 (completely opaque), providing a way to reveal underlying structures or patterns. Visualizing Gradients with Quiver3:For datasets that include vector fields, the quiver3() Function can be combined with the mesh() Function to visualize gradients or flow directions. Example: Output: 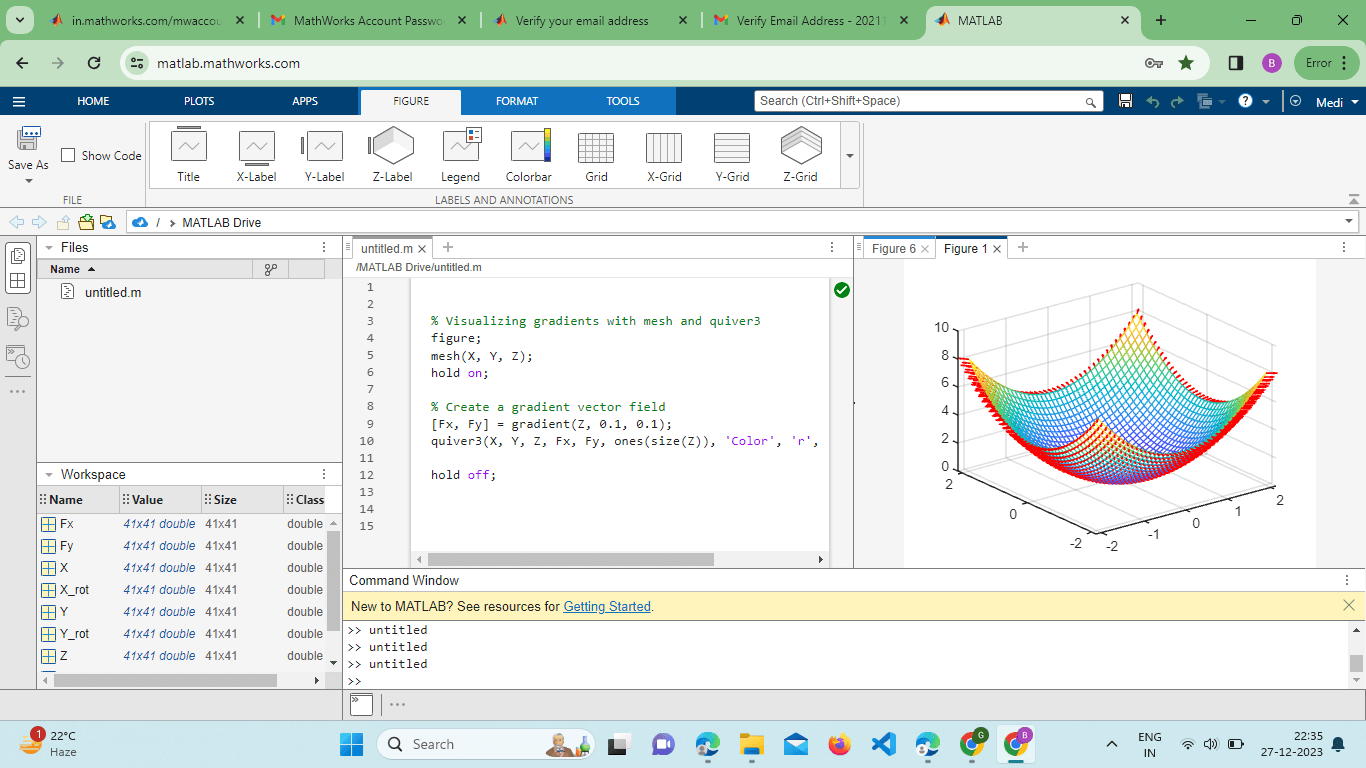
This code overlays a 3D surface plot with a quiver plot depicting the gradient directions at each point. Parametric Surfaces: The mesh() function can visualize parametric surfaces by defining explicit parametric equations for X, Y, and Z. Example: Output: 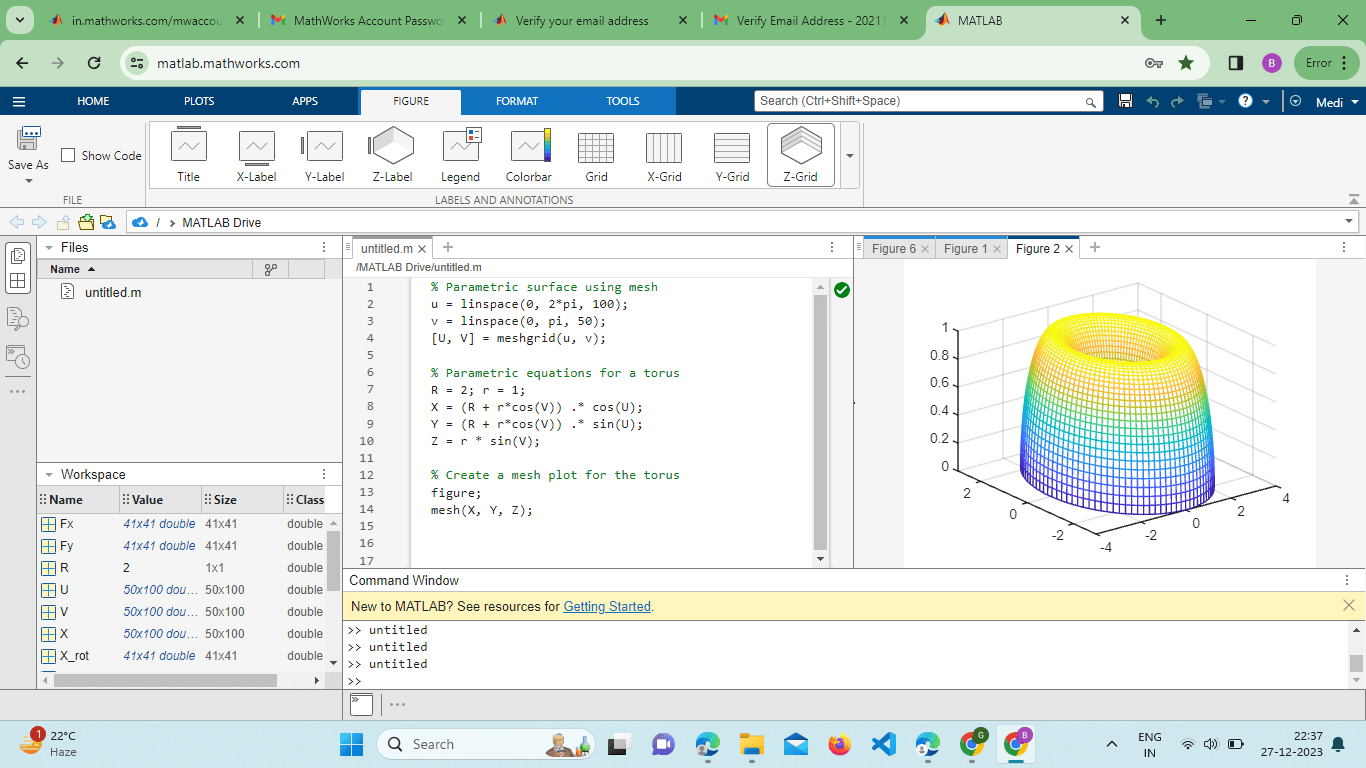
This example showcases how to use parametric equations to generate a torus and visualize it using the mesh() function. Interactive Exploration with Rotate3d:MATLAB provides interactive tools for exploring 3D plots. The rotate3d function enables users to interactively rotate and pan the plot for a more comprehensive understanding of the data: Example: Output: 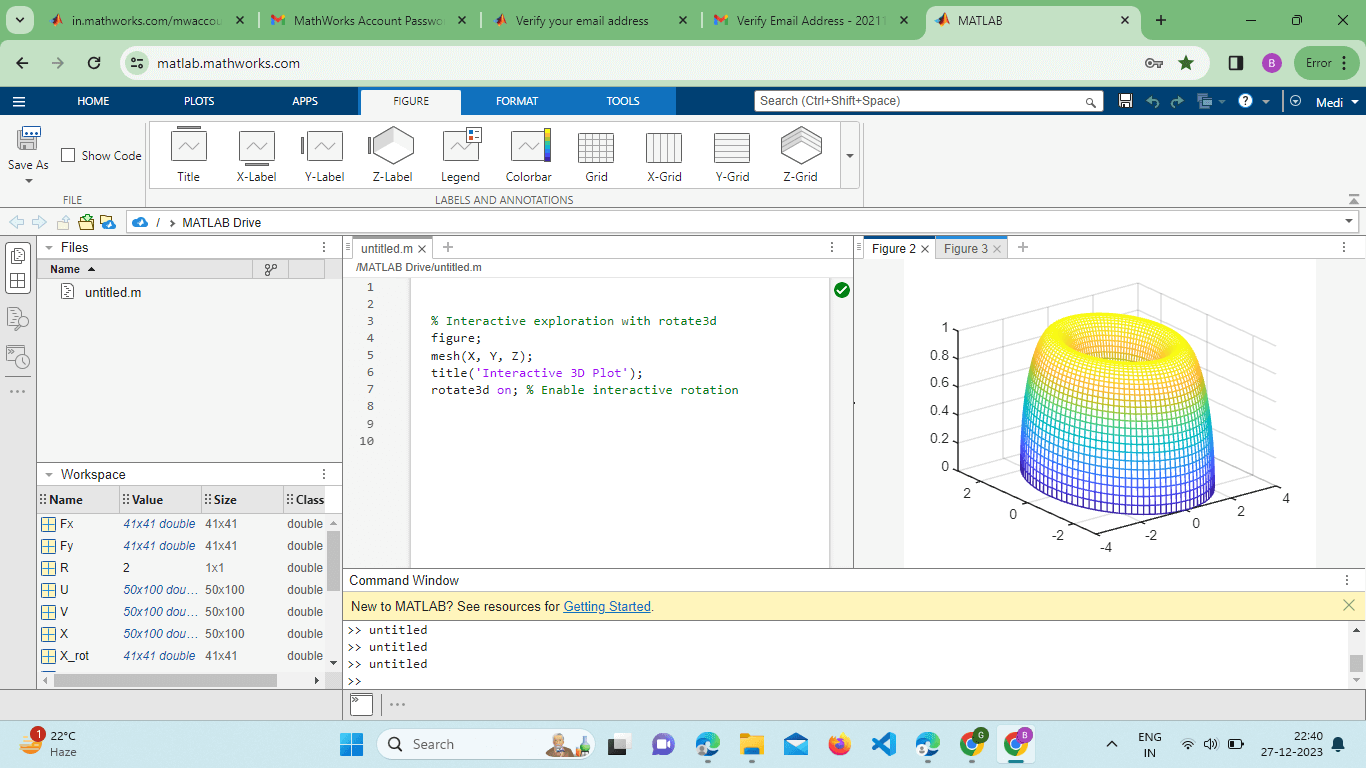
Activating the rotate3d tool allows users to rotate the plot freely, providing a dynamic perspective on the 3D surface. Exporting Figures:MATLAB's mesh() plots can be exported to various file formats for inclusion in reports or presentations. The saves Function is a handy tool for this purpose: Output: 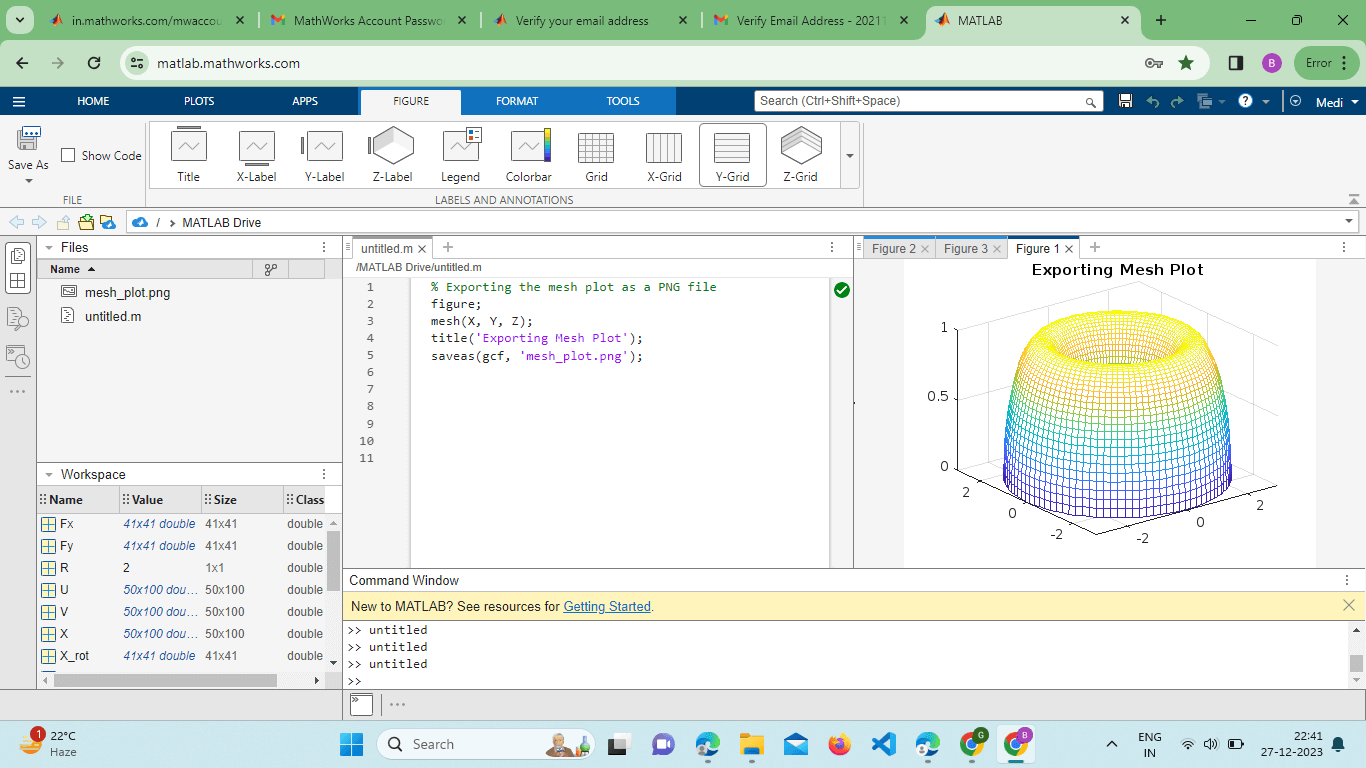
This example demonstrates how to use scattered interpolation to create a smoother representation of the surface. Surface Slicing and Section Analysis:MATLAB's mesh() function can be combined with slicing techniques to reveal internal structures or analyze cross-sections of 3D surfaces. The slice function is commonly used for this purpose: Output: 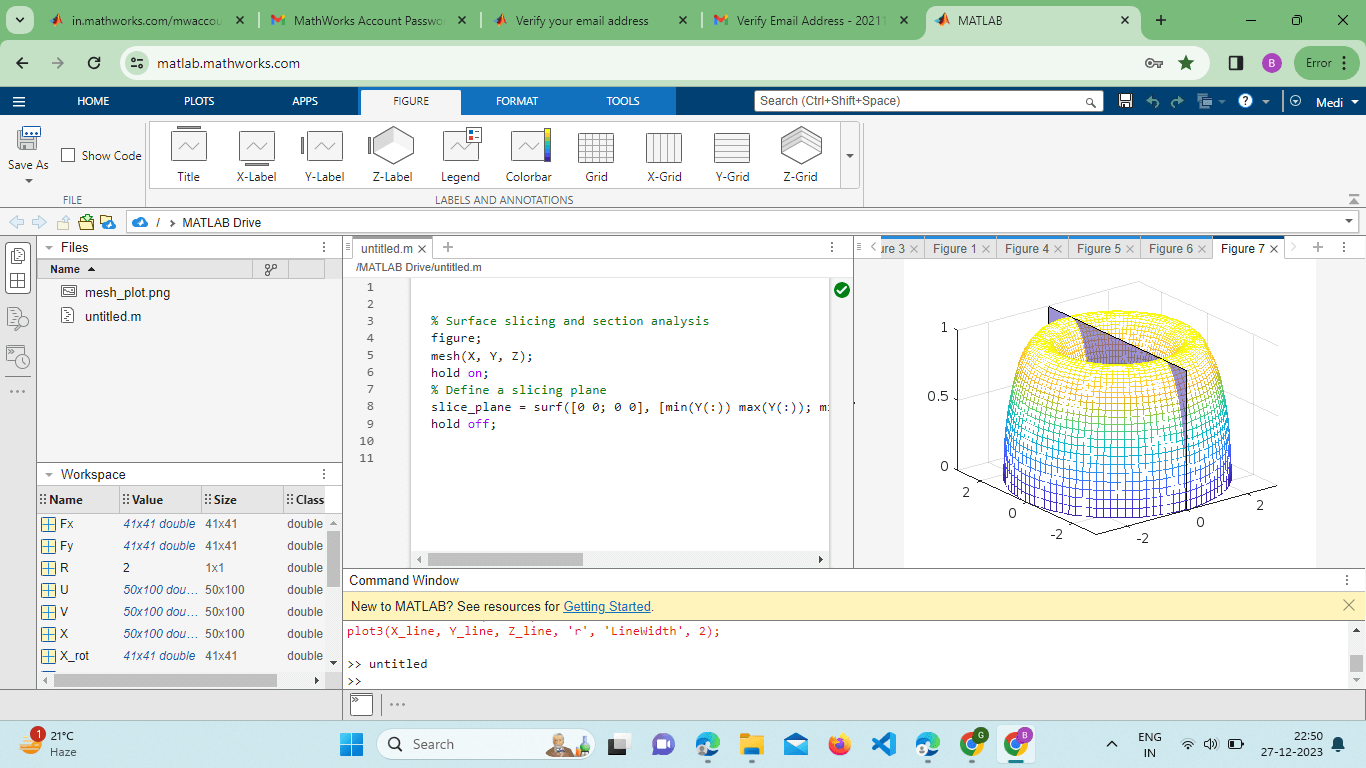
This example demonstrates how to use the slice function to create a slicing plane and analyze sections of the 3D surface. Integration with Other Plot Types:The mesh() function can be seamlessly integrated with other MATLAB plotting functions to create comprehensive visualizations. For instance, combining plot3 with mesh() allows users to overlay line plots on the 3D surface: Output: 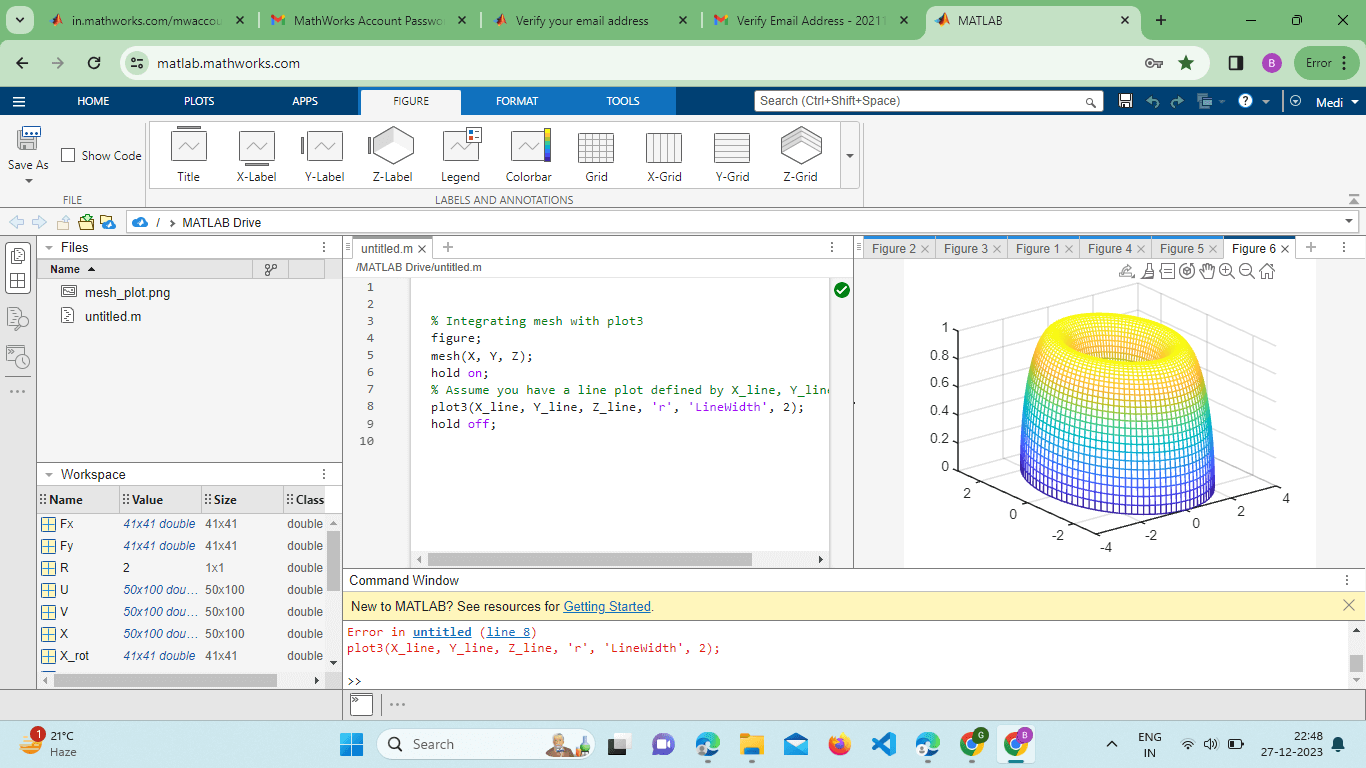
This example showcases the integration of line plots with a 3D surface plot for a more comprehensive visualization. Utilizing External Colormaps:MATLAB's mesh() Function supports the use of external colormaps to enhance the visual representation of surfaces. Colormaps can be applied to represent additional information such as temperature, stress, or concentration: Example: Output: 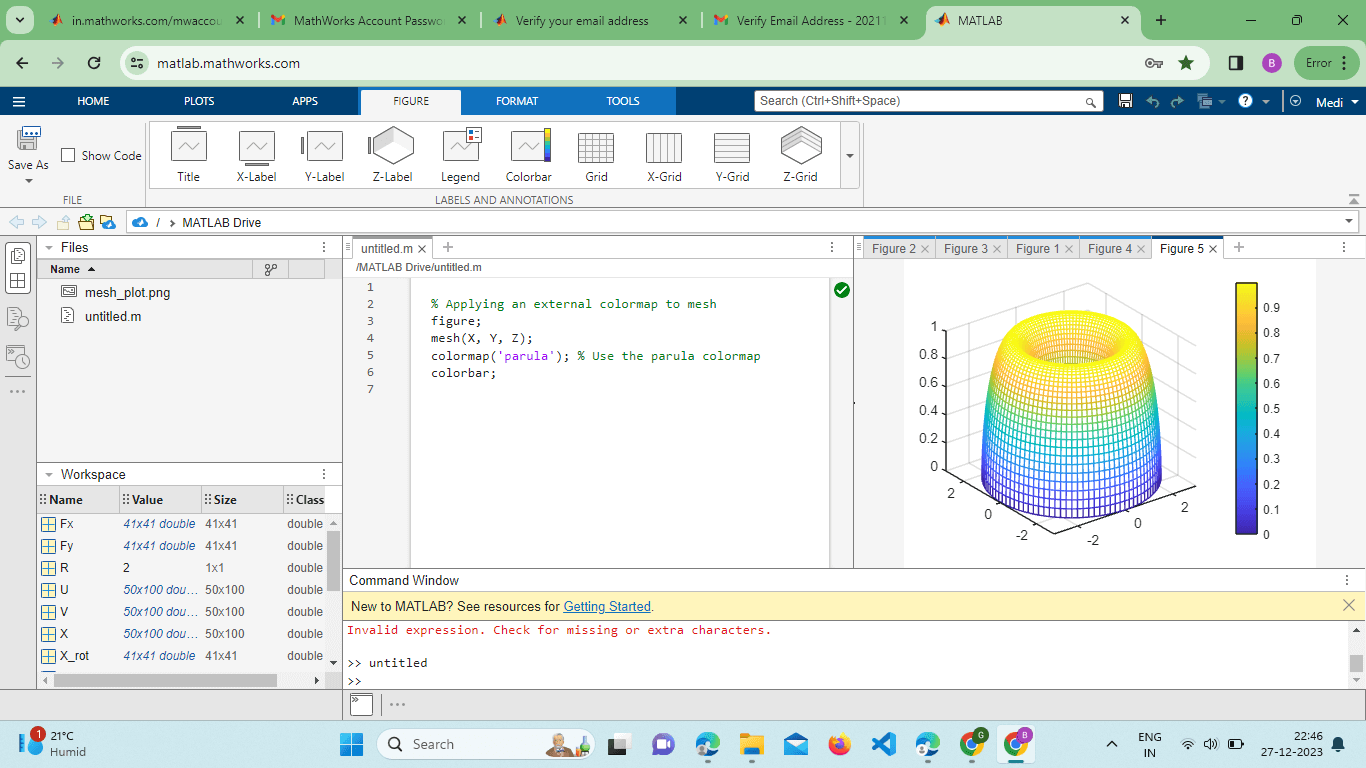
This example demonstrates how to apply the 'parula' colormap to the mesh plot, providing a color scale for the Z values. Overlaying Multiple Surfaces:The mesh() function supports the overlay of multiple surfaces, enabling the comparison of different datasets or functions within the same plot. This is achieved by calling the Function multiple times with different data matrices or by using the hold-on and hold-off commands. Example: 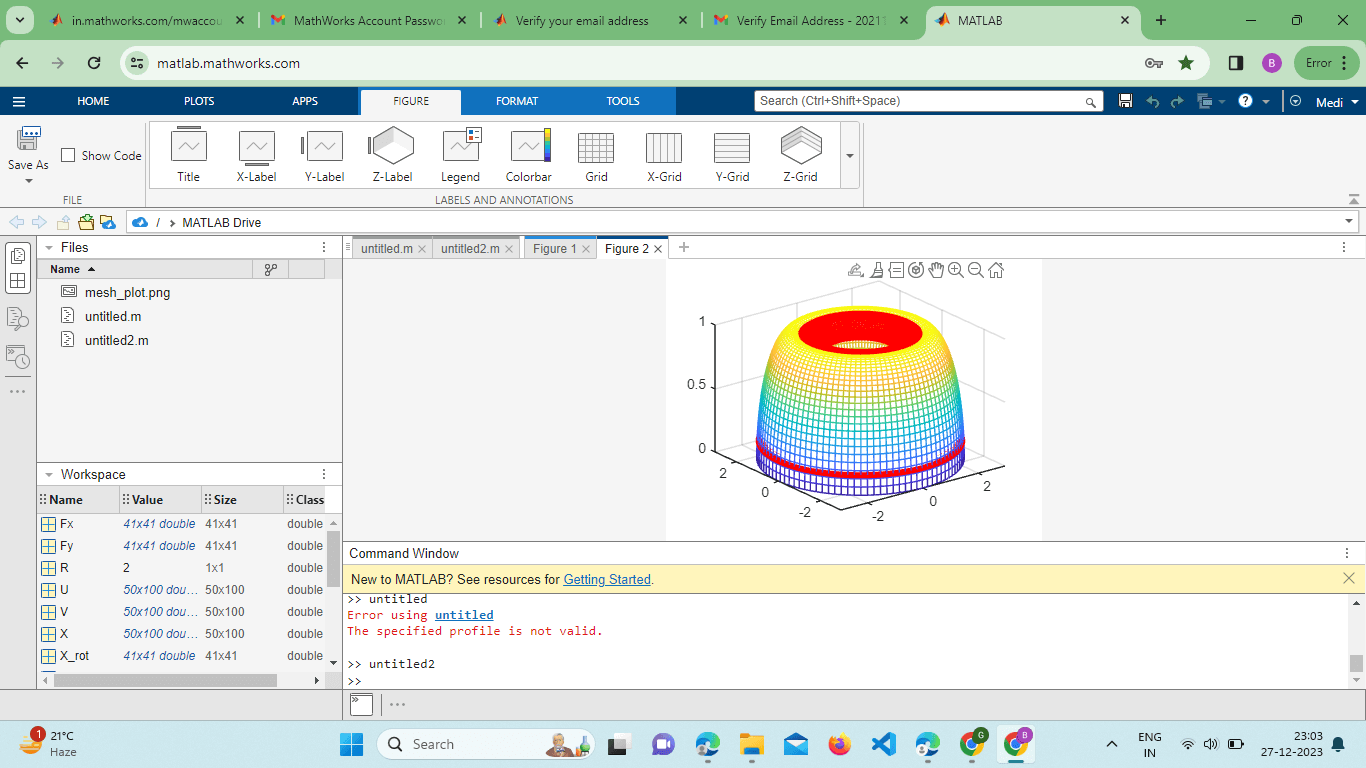
Overlaying multiple surfaces in MATLAB using the mesh() function is a powerful technique for comparing different datasets or functions within the same plot. Let's delve into this topic in more detail. Example: Output: 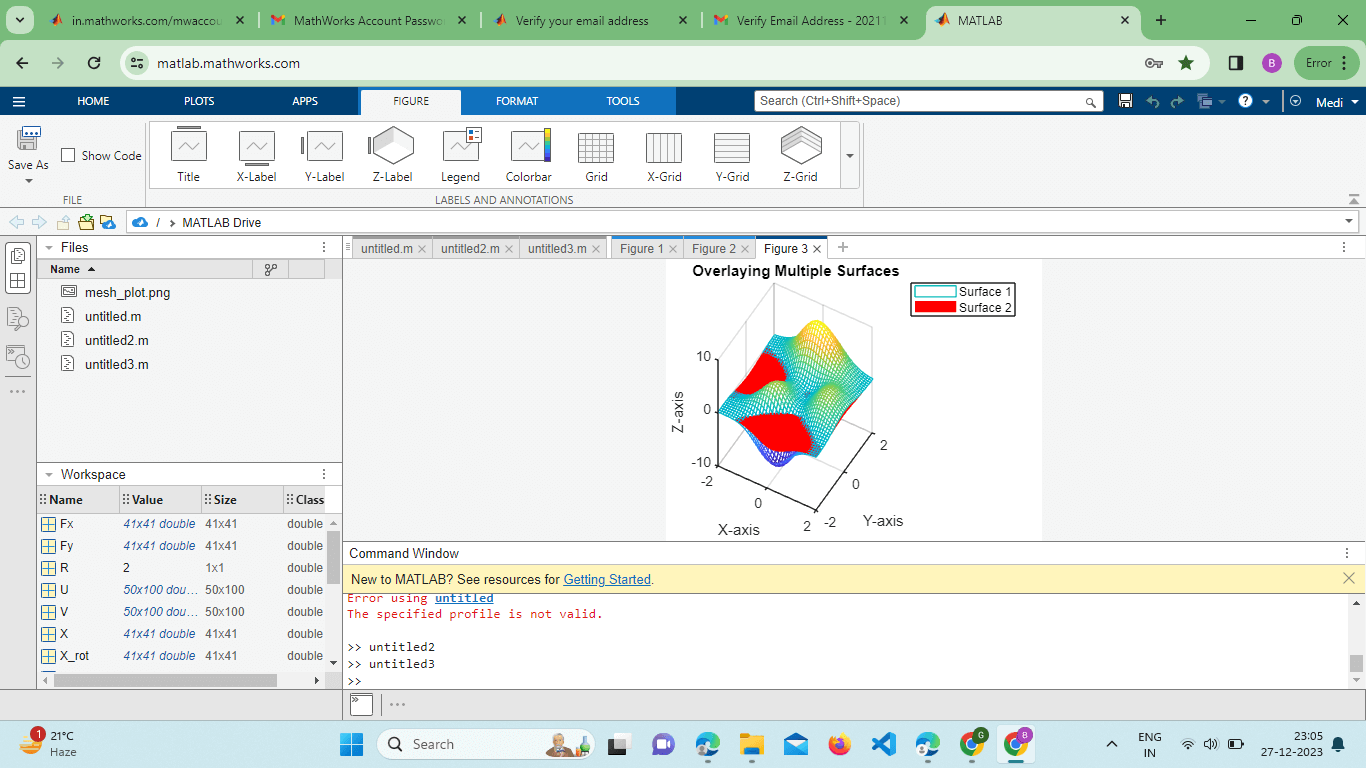
Explanation: We generate data for two surfaces (Z1 and Z2) using the peaks function. The first surface (Z1) is plotted using the mesh() function. We use hold-on to retain the current plot while adding the second surface (Z2) with a different color and no edge color. The legend function is employed to distinguish between the two surfaces. Finally, we adjust the view for better visibility using the view function. The mesh() function in MATLAB proves to be an incredibly versatile tool for 3D visualization, offering a multitude of advanced features and techniques.
Advantages of Using MATLAB's mesh() Function:Ease of Use: MATLAB's mesh() Function is part of the MATLAB plotting library, making it easily accessible and user-friendly. The syntax is straightforward, allowing users to create 3D surface plots with minimal code. Versatility: The mesh() function is versatile and can handle a wide range of mathematical functions and datasets. It accommodates parametric surfaces and scattered data and can be combined with other MATLAB functions for advanced visualizations. Customization: MATLAB provides extensive customization options for mesh() plots. Users can adjust colors, shading, line styles, and more, tailoring the visual representation to specific needs. This flexibility is crucial for conveying information effectively. Integration with Other MATLAB Functions: mesh() seamlessly integrates with other MATLAB plotting functions, such as quiver3(), contour(), and plot3(). This integration allows users to create complex visualizations that combine multiple types of information. Interactive Exploration: The mesh() Function can be combined with interactive tools like rotate3d and data cursor mode, enabling users to explore 3D plots dynamically. This interactive capability enhances the user's ability to understand complex data. Animation Support: MATLAB supports the animation of mesh() plots, allowing users to visualize changes in data over time. This is valuable for conveying dynamic processes and trends in scientific and engineering applications. Export Capabilities: MATLAB facilitates the export of mesh() plots to various file formats, such as PNG, JPEG, or even video files. This feature is essential for including visualizations in reports, presentations, or publications. Interpolation and Smoothing: The mesh() function can be combined with interpolation techniques, such as grid data (), to create smoother surfaces from sparse or noisy data. This is advantageous when working with real-world datasets. Cross-Sectional Analysis: mesh() can be combined with slicing techniques, like the slice() function, for cross-sectional Analysis. This feature is beneficial for examining internal structures of 3D surfaces. Disadvantages of Using MATLAB's mesh() Function:Limited 3D Plot Types: While mesh() is powerful for visualizing surfaces, it could be better for representing certain types of data, such as volumetric data. For more specialized visualizations, other functions like isosurface may be more suitable. Performance Considerations: Generating complex mesh() plots with large datasets or intricate parametric surfaces can be computationally intensive. This may lead to performance issues, especially when working with extensive or real-time data. Learning Curve for Advanced Features: While basic usage is straightforward, mastering advanced features like parametric surfaces, animations, and interactive exploration may require a learning curve. Users may need time and practice to leverage these capabilities effectively. Dependency on MATLAB: The mesh() Function is specific to MATLAB, which means that anyone viewing or reproducing the visualizations needs access to MATLAB or a MATLAB viewer. This could be a limitation if collaboration or sharing with individuals who don't have MATLAB is required. Complexity in Code for Certain Features: Implementing certain advanced features, such as dynamic slicing with a slider or intricate parametric surfaces, can lead to complex code structures. This complexity might be challenging for beginners or those unfamiliar with MATLAB's plotting capabilities. Limited 3D Interaction Controls: While rotate3d enables basic 3D interaction, more advanced features found in dedicated 3D visualization tools may be lacking. Users seeking highly interactive and immersive experiences may need help with MATLAB's built-in capabilities. Potential for Overlapping Information: Overlaying multiple surfaces or information types on a single mesh() plot might result in visual clutter or overlapping elements, potentially making the visualization less interpretable.
Next TopicColors in MATLAB
|
 For Videos Join Our Youtube Channel: Join Now
Feedback
- Send your Feedback to [email protected]
Help Others, Please Share


