| |

Xlabel in MatlabIntroduction:In MATLAB, the xlabel function is a fundamental tool for enhancing the interpretability and professional appearance of your plots. The primary purpose of a label is to add labels to the x-axis of a graph, providing crucial information about the data being visualized. This function is part of MATLAB's extensive plotting capabilities and is commonly used in conjunction with other plotting functions. Basic Syntax:The basic syntax of the xlabel function is as follows: Here, 'label_text' is a character vector or string that represents the label you want to assign to the x-axis. Key Features and Usage:Adding Text Labels: This example adds the label "Time (seconds)" to the x-axis, providing context to the plotted data. Formatting Options: You can customize the appearance of the x-axis label by specifying additional formatting options. For instance: This sets the font size to 14, makes the text bold, and changes the color to blue. Mathematical Expressions: MATLAB allows the use of LaTeX-style mathematical expressions in labels: This example displays a formatted mathematical expression on the x-axis. Variable Labels: You can use variables to generate labels dynamically: This is useful when you want to create labels based on the content of your data. Multiple Plots: When creating multiple plots, you can use xlabel for each subplot individually: Implementation:Output: 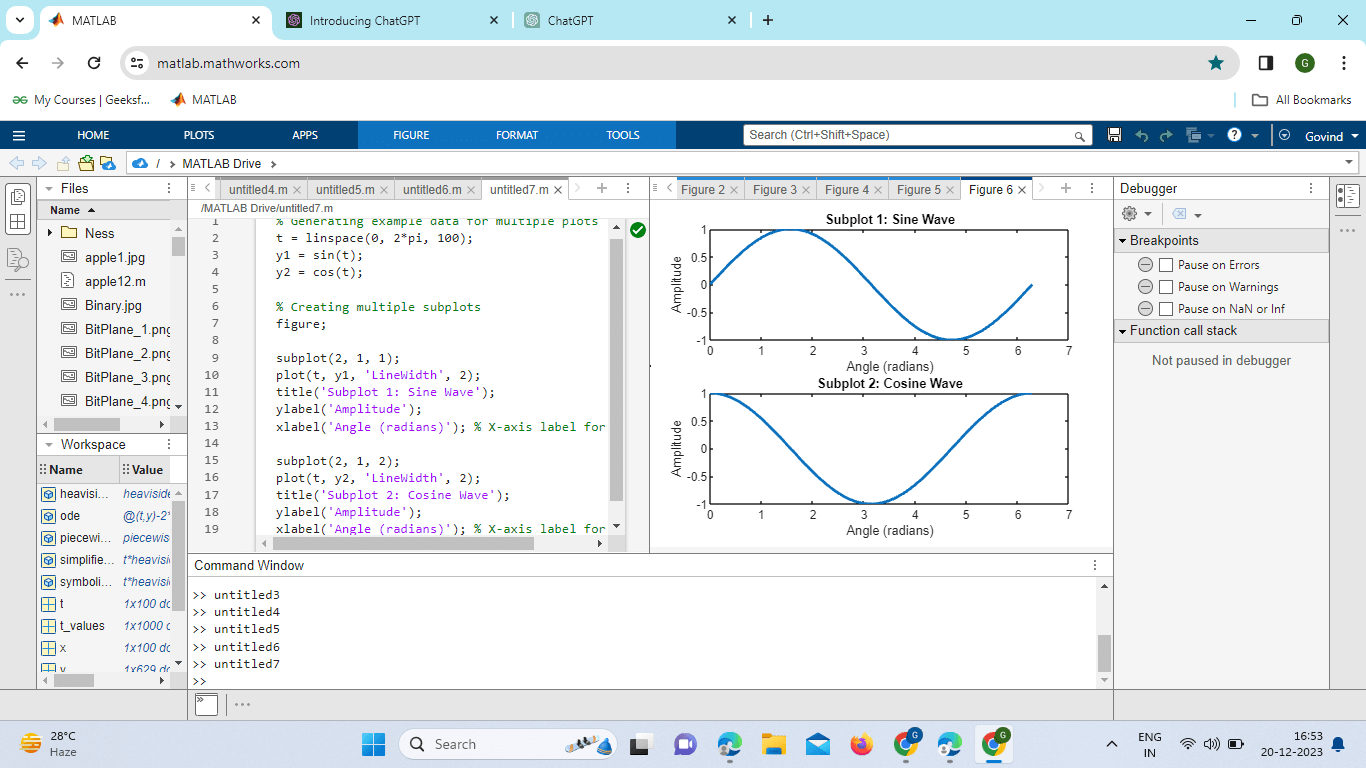
Explanation:
This program demonstrates the use of xlabel in the context of multiple subplots. Each subplot has a customized x-axis label, and the program dynamically generates labels based on the content of the data. The resulting figure shows two subplots with sine and cosine waves, each labeled appropriately on the x-axis. Example Usage: Output: 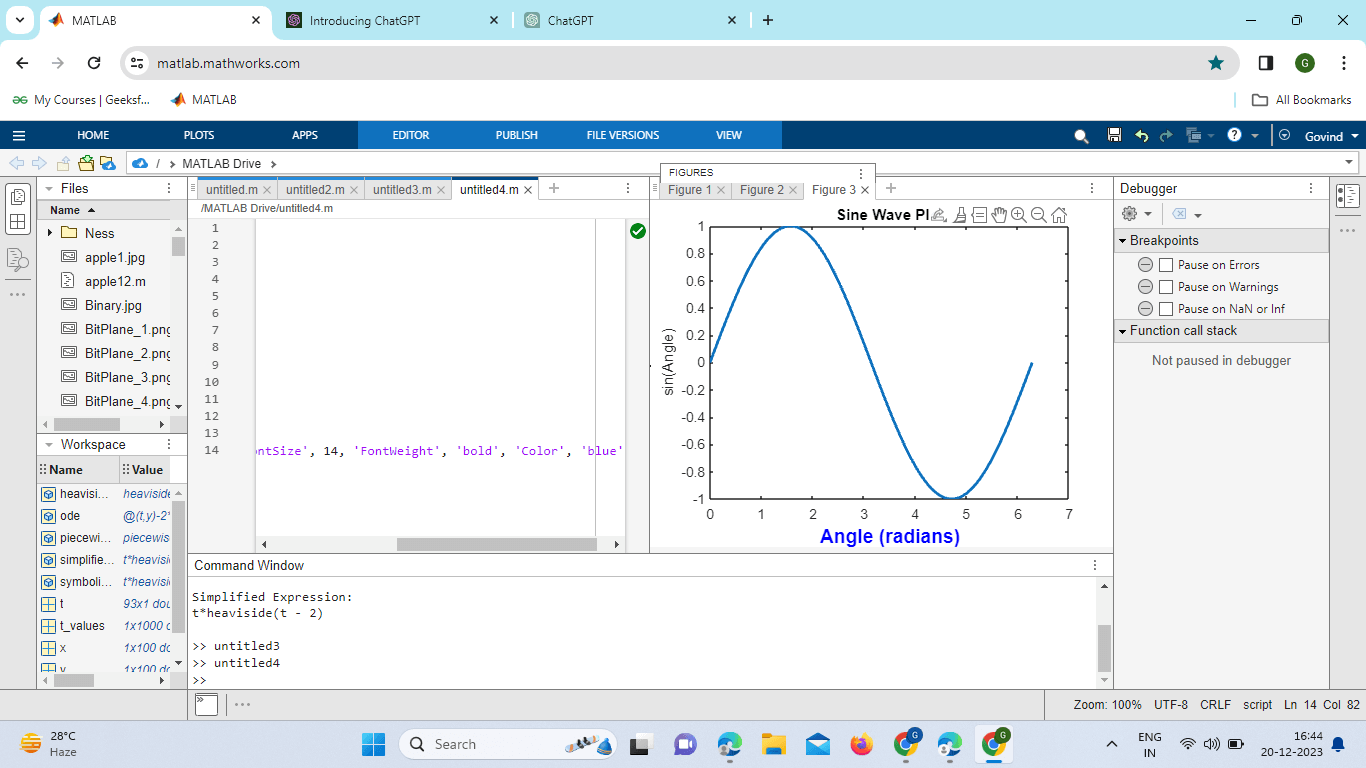
In this example, a sine wave is plotted, and labels are added to the x-axis and y-axis. The xlabel function is then used to customize the appearance of the x-axis label. Advanced Features of xlabel:Rotating Labels:You can rotate the x-axis label for better readability, especially when dealing with long text: This example rotates the x-axis label by 45 degrees. Example: Output: 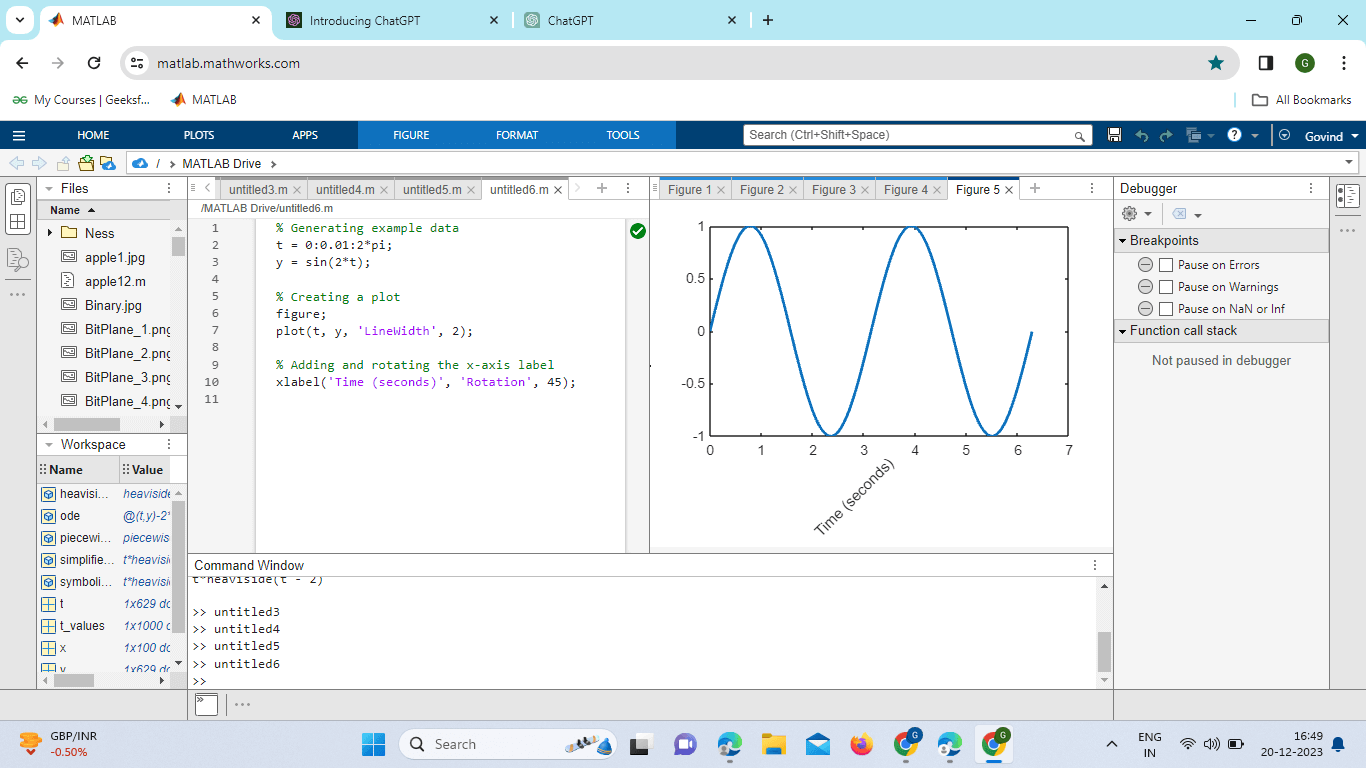
Explanation:
Linked Axes:When working with multiple linked axes, you can use xlabel to set a label for the entire set of linked axes: Interactive Labels: MATLAB supports interactive labels that respond to user actions. You can create callback functions triggered by events like mouse clicks or key presses to update labels dynamically. Date and Time Labels: When dealing with time-series data, you can use specialized formatting for date and time labels: Implementation: Output: 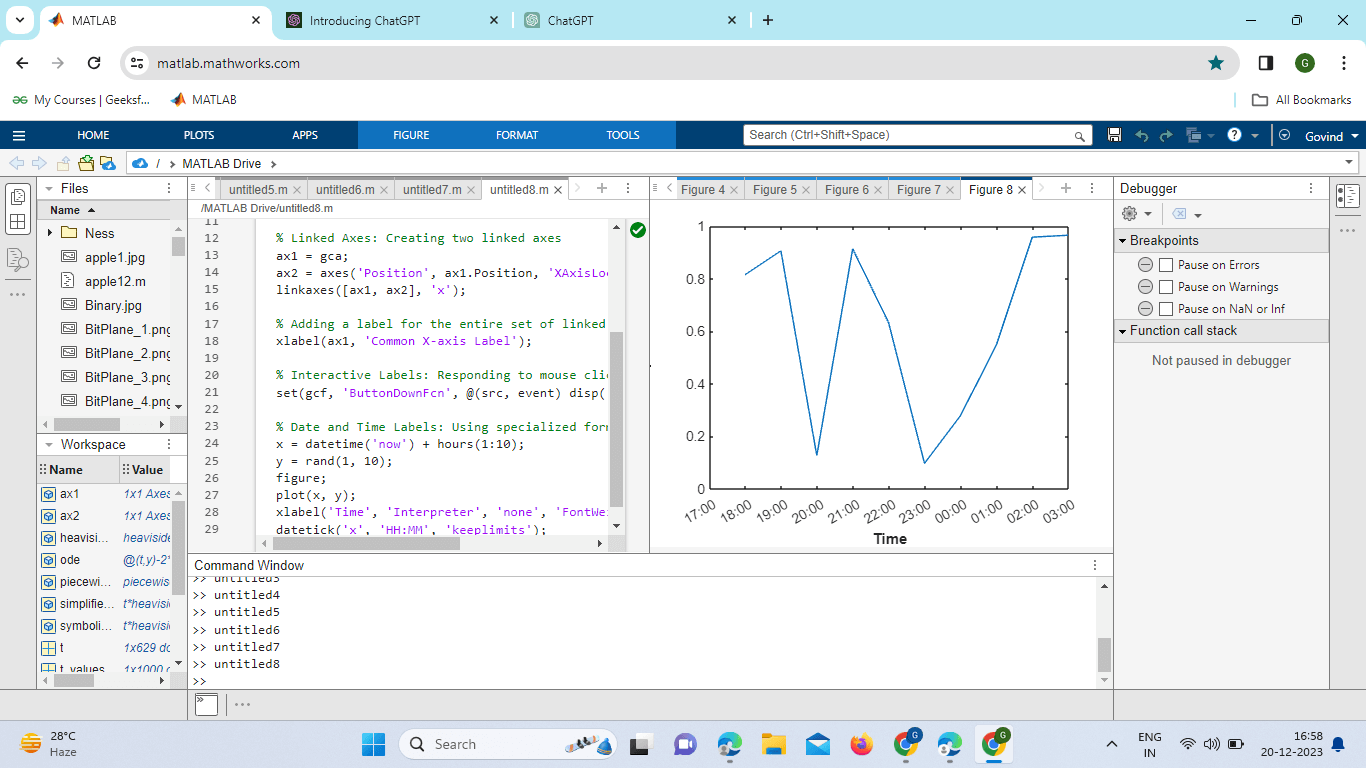
Explanation:
This program showcases the advanced features of labels in MATLAB, such as rotating labels, linked axes, interactive labels, and date and time labels. The resulting figures demonstrate the application of these features for enhanced visualization and interactivity. Effective Use:Clear and Concise Labels: Keep x-axis labels clear and concise. Avoid clutter and use appropriate units to convey information effectively. Consistent Formatting: Maintain a consistent style for labels across multiple plots for a polished and professional appearance. Font and Style Consistency: Ensure consistency in font size, weight, and color with other text elements in your plot for a visually cohesive presentation. Mathematical Symbols: Leverage MATLAB's support for LaTeX-style mathematical expressions to include complex symbols and equations in your labels. Accessibility: Consider accessibility by choosing legible fonts and colors that provide good contrast, making your plots accessible to a wide audience. Overlapping Labels: Be cautious of label overlap, especially when dealing with dense data. Adjust the rotation or use smaller font sizes to prevent overlap. Unreadable Text: Avoid excessively small font sizes that may result in unreadable labels. Adjust the font size based on the size of your plot. Inconsistent Labels: Inconsistent labels across different subplots or axes may confuse viewers. Ensure uniformity in labeling conventions. Incorrect Interpretation: Check that your labels accurately represent the data and are not misleading. Be mindful of the units and scales used.
Considerations for Working with xlabel:
Next TopicMatlab Gradient
|
 For Videos Join Our Youtube Channel: Join Now
Feedback
- Send your Feedback to [email protected]
Help Others, Please Share


