Credit Card Approval Using Machine Learning
Credit scorecards are widely used in the financial industry as a risk control measure. These cards utilize personal information and data provided by credit card applicants to assess the likelihood of potential defaults and credit card debts in the future. Based on this evaluation, the bank can make informed decisions regarding whether to approve the credit card application. Credit scores provide an objective way to measure and quantify the level of risk involved. Credit card approval is a crucial process in the banking industry. Traditionally, banks rely on manual evaluation of creditworthiness, which can be time-consuming and prone to errors. However, with the advent of Machine Learning (ML) algorithms, the credit card approval process has been significantly streamlined. Machine Learning algorithms have the ability to analyze large volumes of data and extract patterns, making them invaluable in credit card approval. By training ML models on historical data that includes information about applicants, their financial behavior, and credit history, banks can predict creditworthiness more accurately and efficiently. Benefits of Credit Card Approval Using Machine Learning
Challenges of Credit Card Approval Using Machine Learning
For better Understanding, we will try to implement it in code, here will try to find whether an applicant is a 'good' or 'bad' client. Data DefinitionThere are two .csv files, such as : 1. application_record.csv:
2. credit_record.csv:
Code: Importing LibrariesReading the DatasetFeature EngineeringHere we will aim to extract the most relevant information from the available data and represent it in a way that the machine learning algorithm can effectively learn from it. Here, we will combine the information from two DataFrames, data and begin_month, based on the 'ID' column. It adds a new column, 'begin_month', to the data DataFrame, indicating the minimum value of 'MONTHS_BALANCE' for each unique 'ID' from the record DataFrame. Target VariableTypically, the target risk users are expected to account for approximately 3% of all users. In this case, We have identified users who have overdue payments for more than 60 days as the target risk users. These specific samples are labeled as '1', while the remaining samples are labeled as '0'. Now we will create the target variable. 
"No" appears 45,318 times which accounts for approximately 98.55% of the total values. "Yes" appears 667 times which accounts for approximately 1.45% of the total values. FeaturesWe will now proceed with the exploratory data analysis of the features, where we will examine, analyze and do various operations on the features. The ivtable DataFrame will contain the remaining columns from the original DataFrame, excluding the ones specified in namelist Defining calc_iv function to calculate Information Value and WOE Value It converts a categorical feature into dummy variables in a DataFrame. It creates categorical bins based on a numerical column in a DataFrame. Binary FeaturesBinary features, also known as binary variables or binary indicators, are categorical variables that can take only two distinct values, typically represented as 0 and 1. These features are used to indicate the presence or absence of a particular characteristic or attribute within the dataset. We will look for the various binary features and their various properties. Gender Output: 
Having a Car or Not Output: 
Having a House Reality or Not Output: 
Having a Phone or Not Output: 
Having an Email or Not Output: 
Having a Work Phone or Not Output: 
Continuous VariablesContinuous variables, also known as quantitative or numerical variables, are measurements that can take any value within a specific range. Unlike binary features, which have only two possible values, continuous variables can have an infinite number of possible values within a given interval. Now we will look for the various continuous variables and their properties. Children Numbers Output: 
Output: 
Annual Income Output: 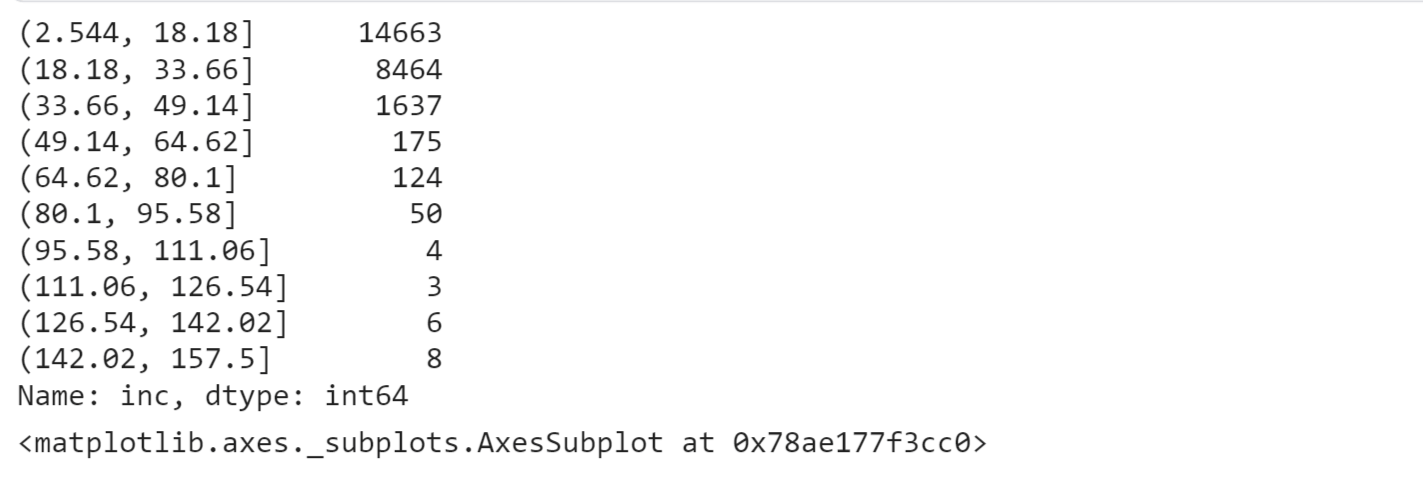
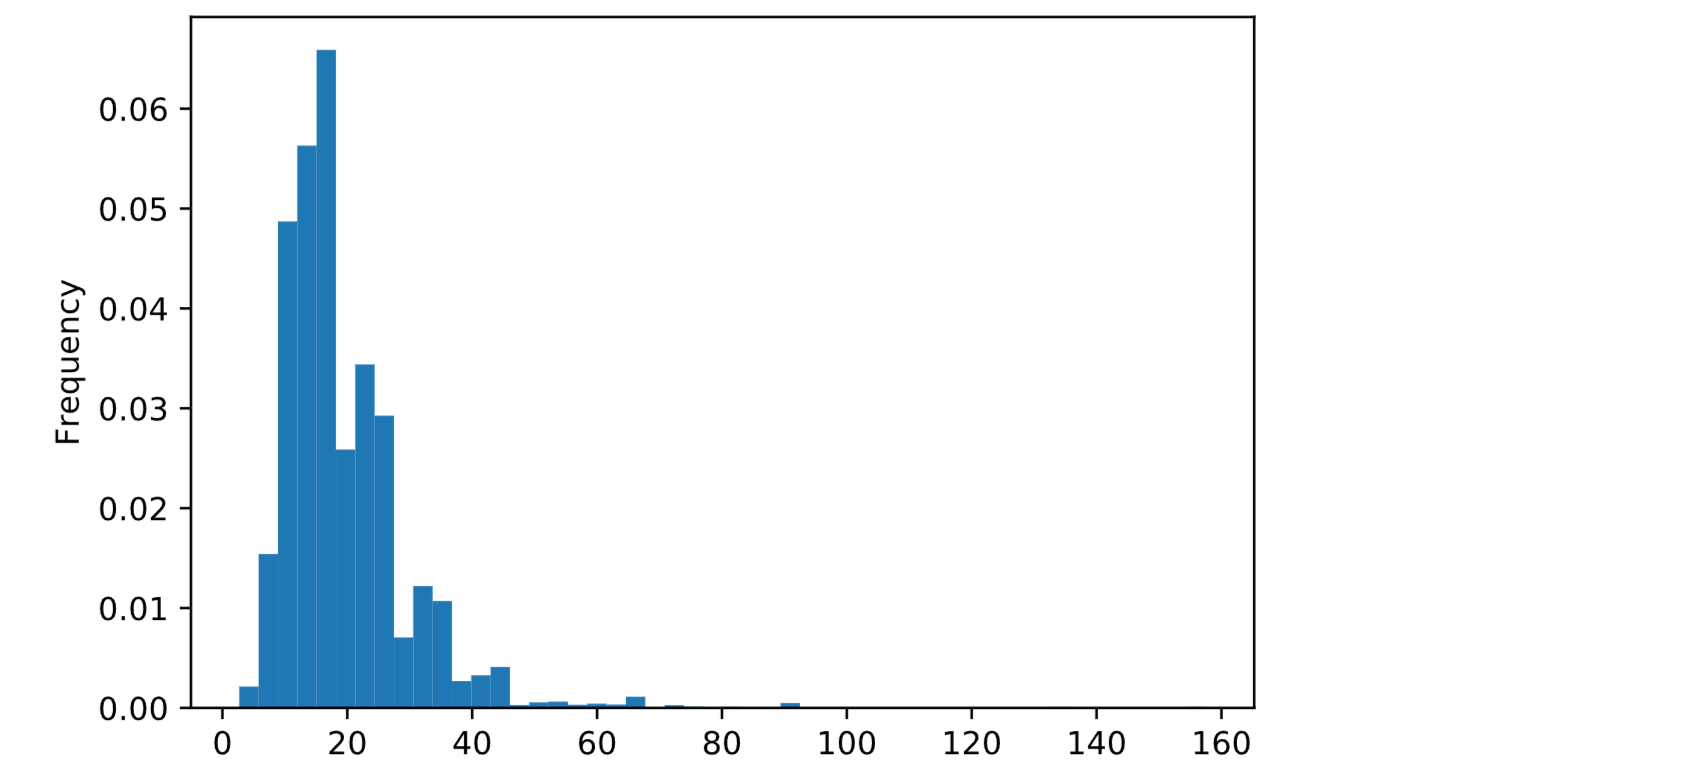
Output: 
Output: 
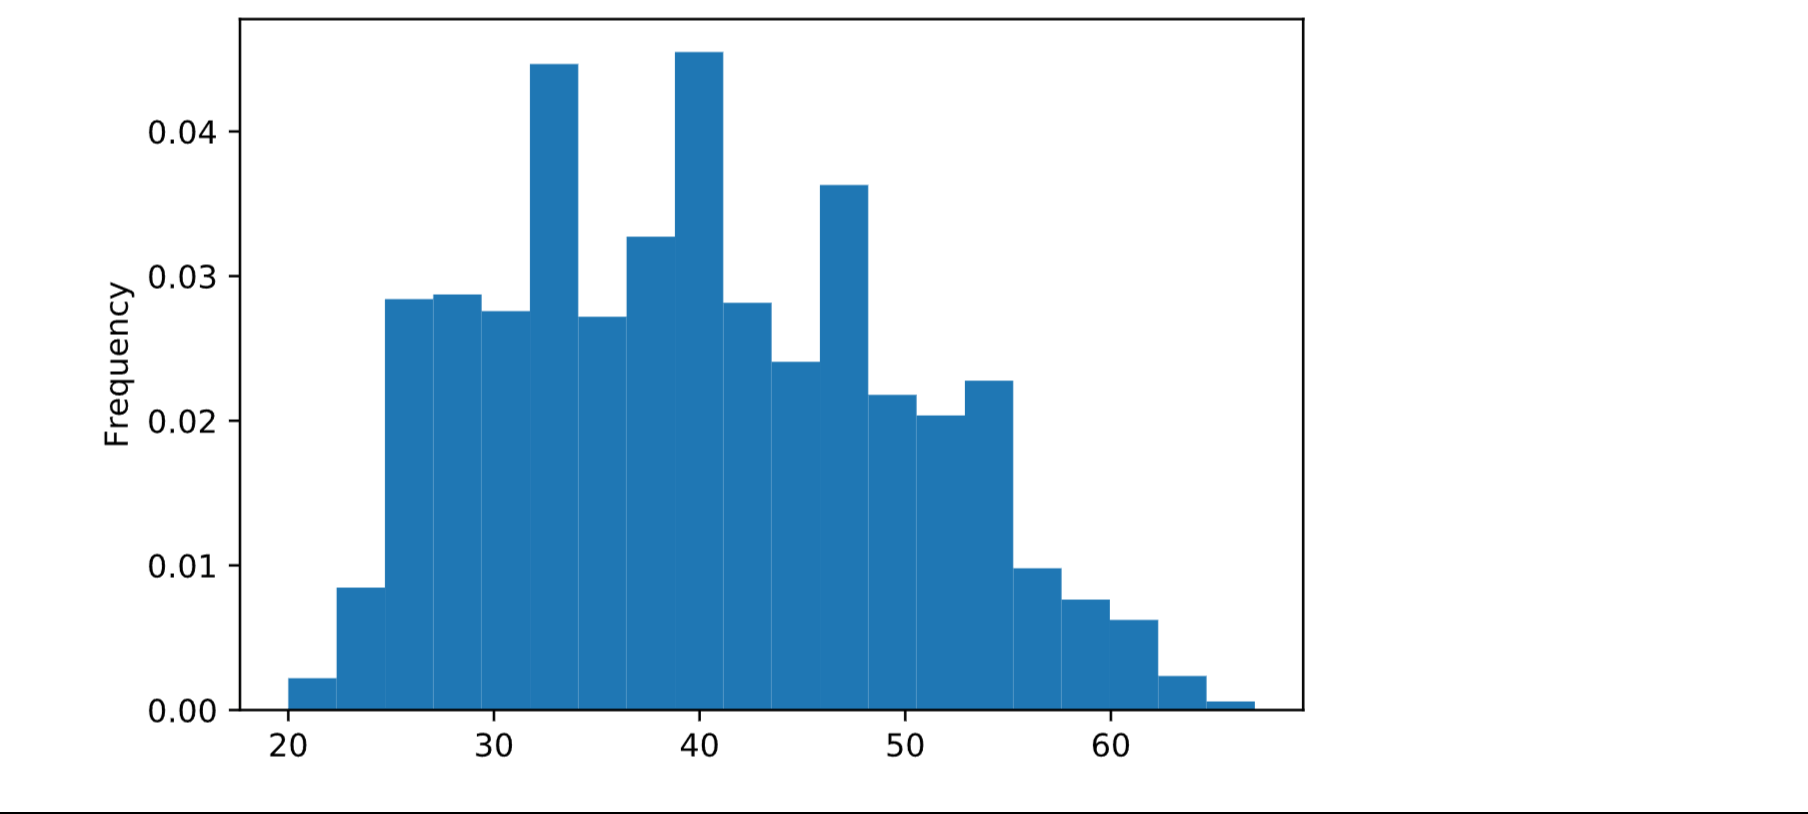
Output: 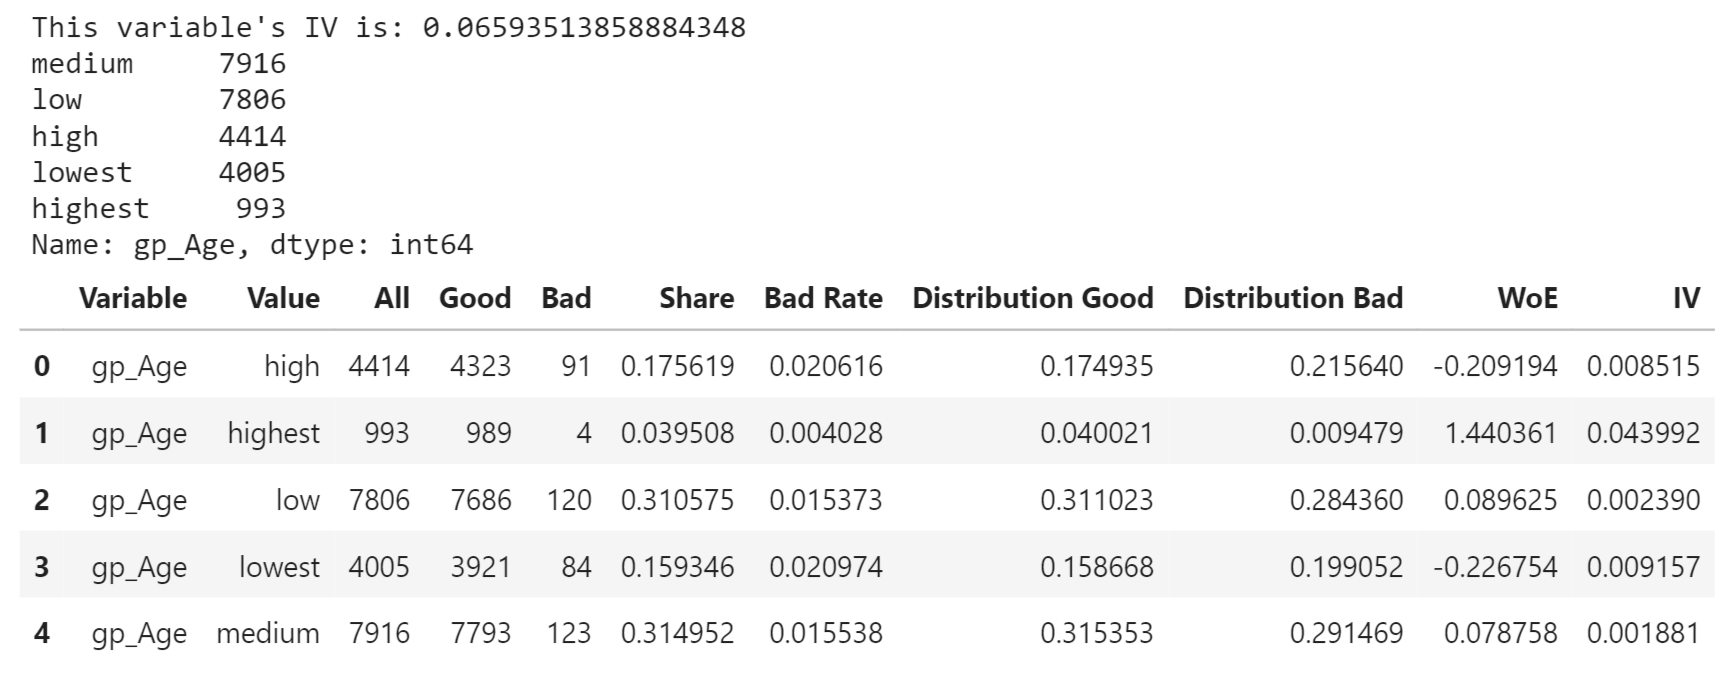
Working Years Output: 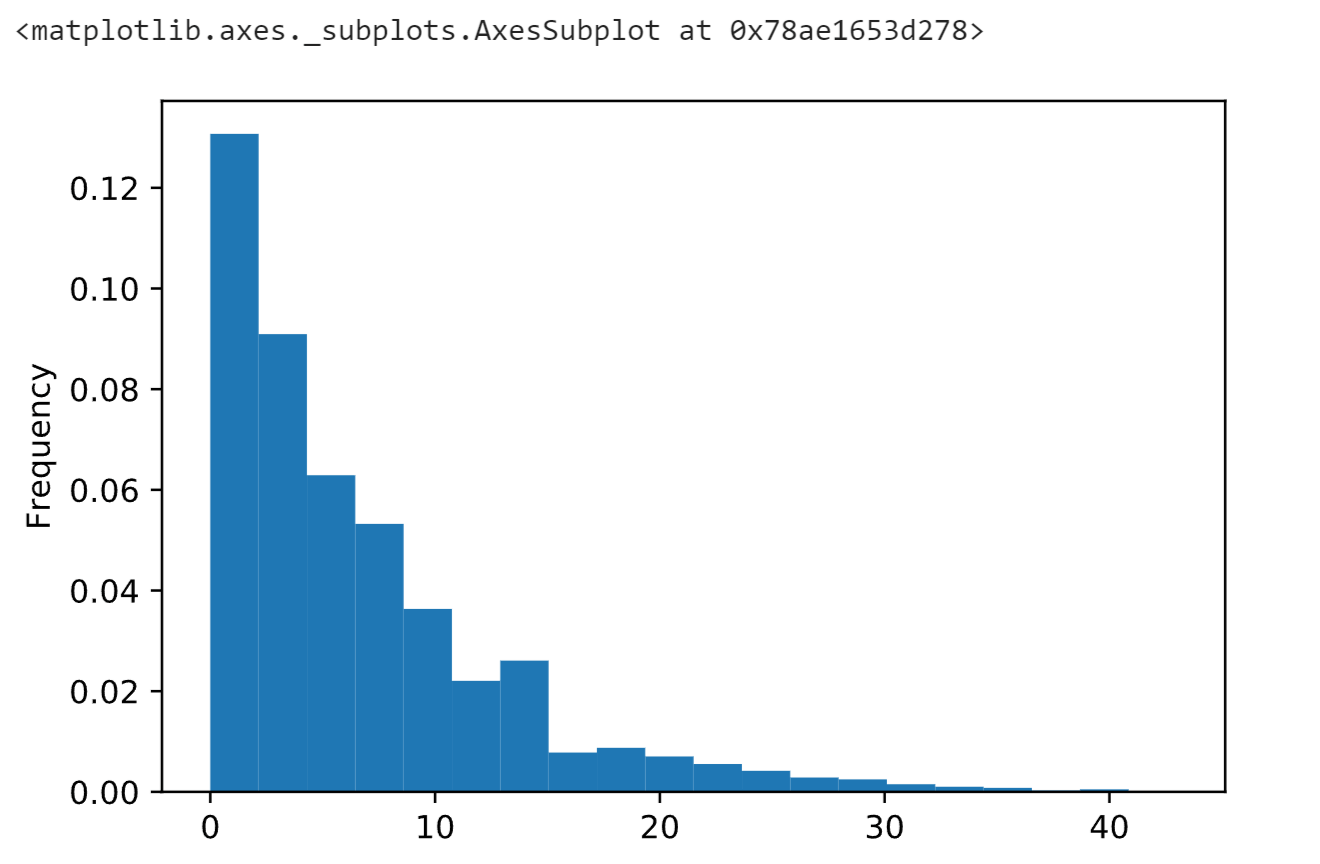
Output: 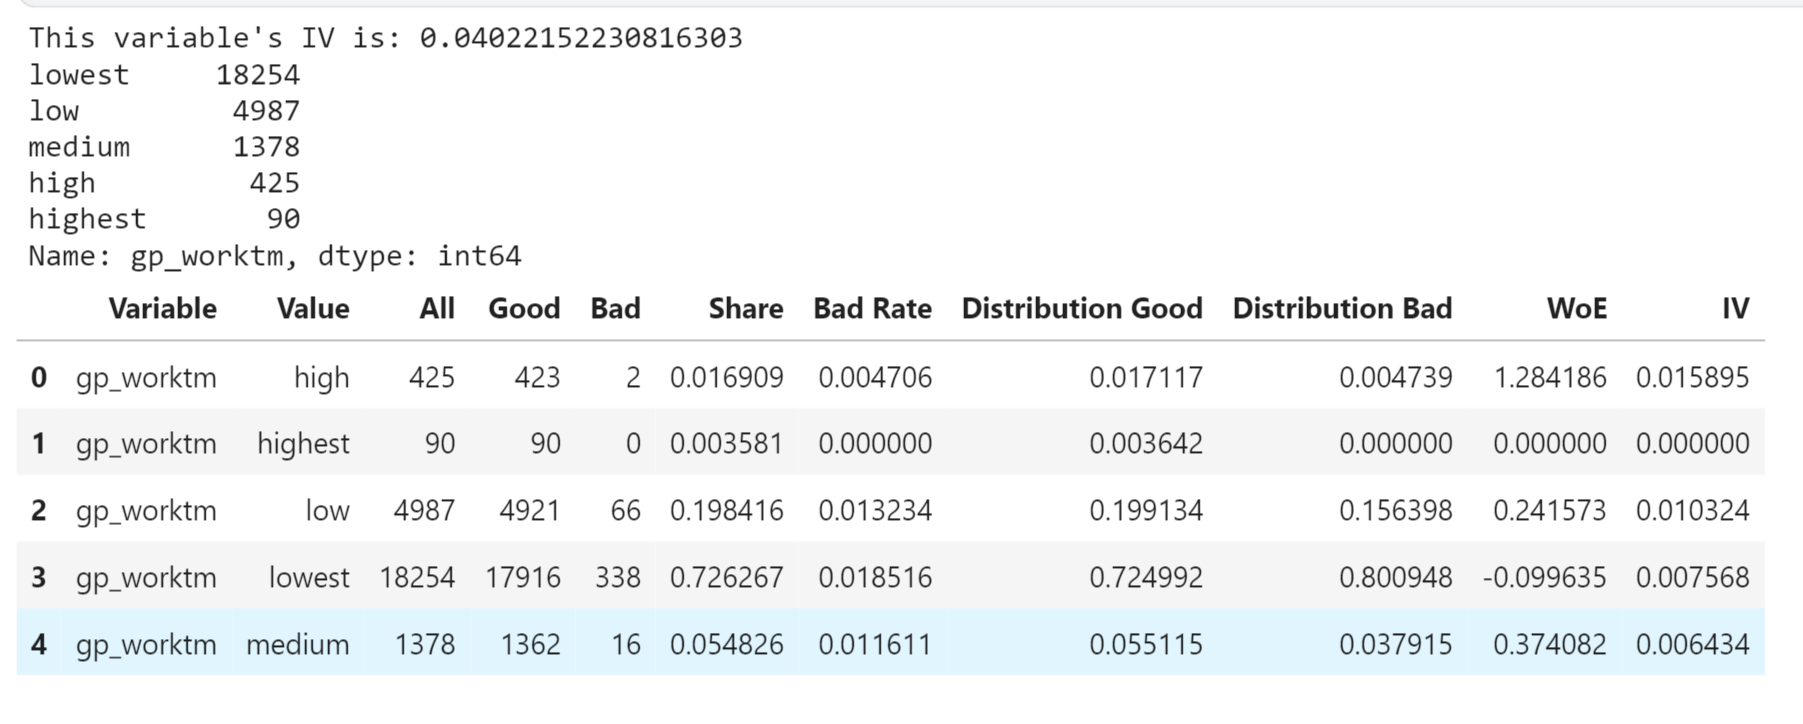
Family Size Output: 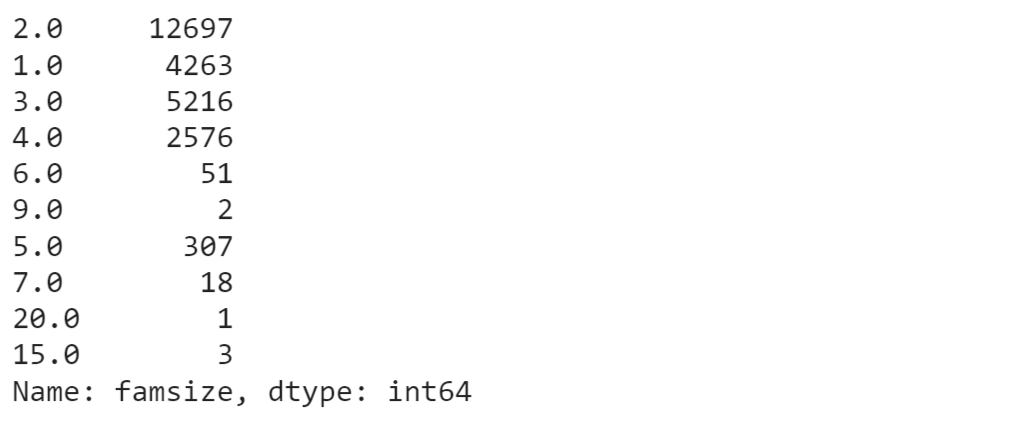
Output: 
Categorical FeaturesCategorical features, also known as qualitative or nominal variables, represent characteristics or attributes that fall into distinct categories or groups. Unlike continuous variables, which have a range of numerical values, categorical features have a finite number of discrete values or labels. Now we will look at the various categorical features and their properties. Income Types Output: 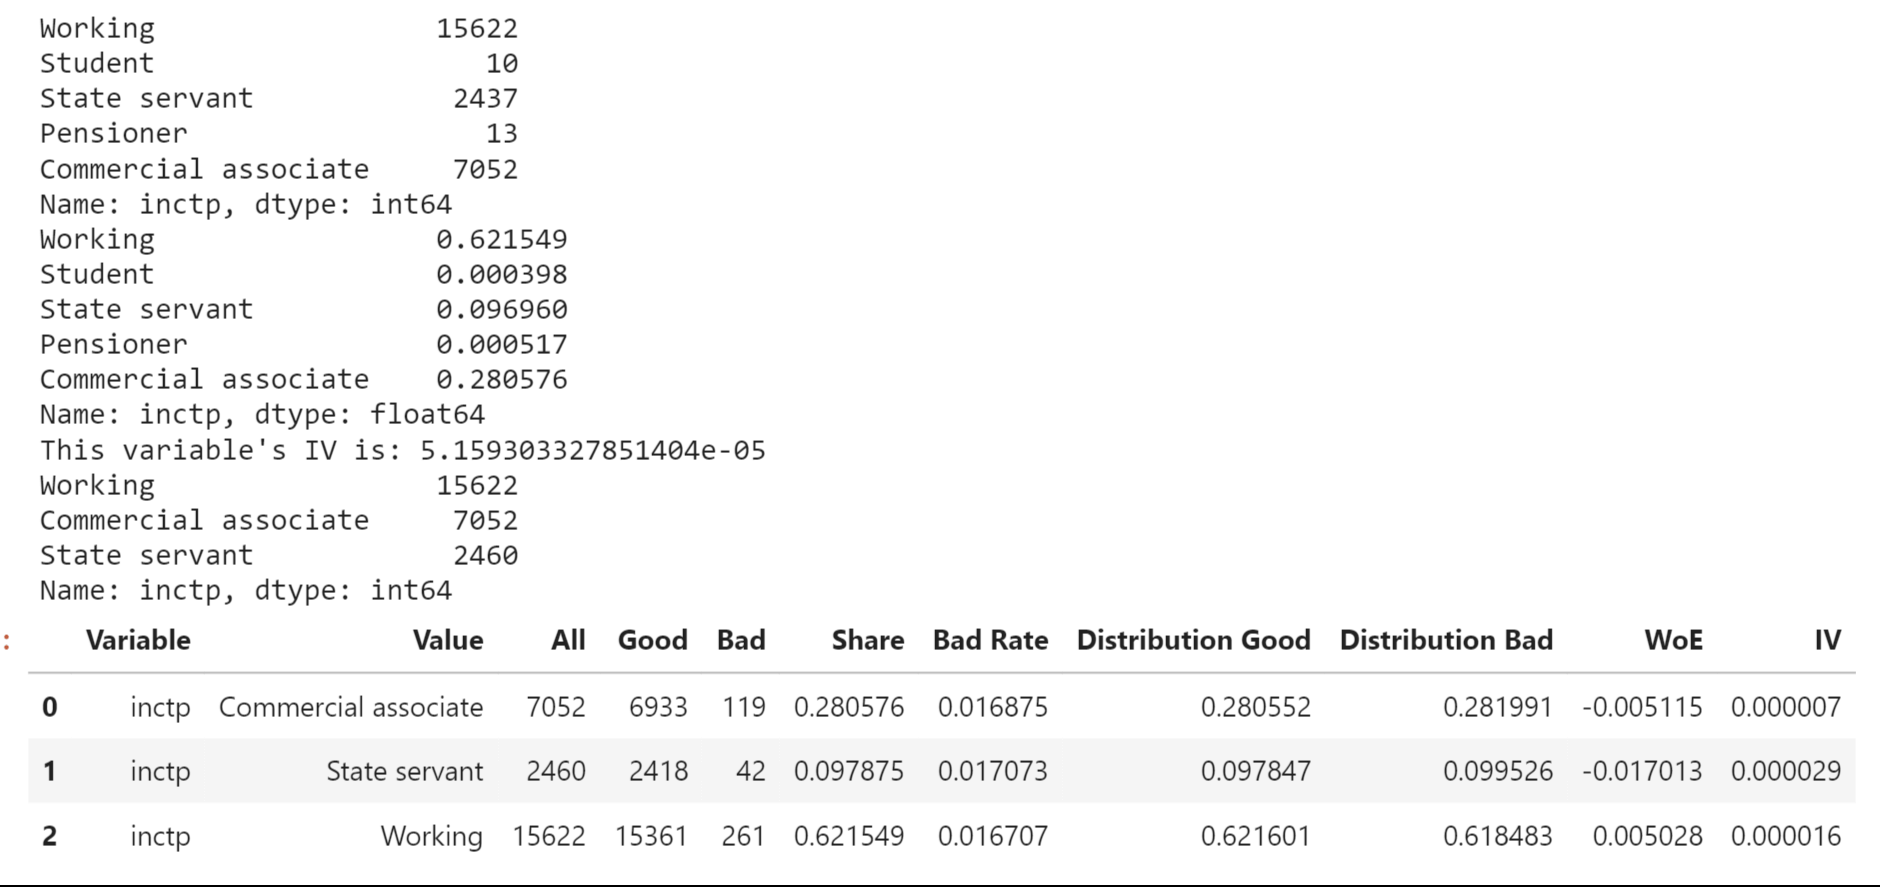
Output: 
House Type Output: 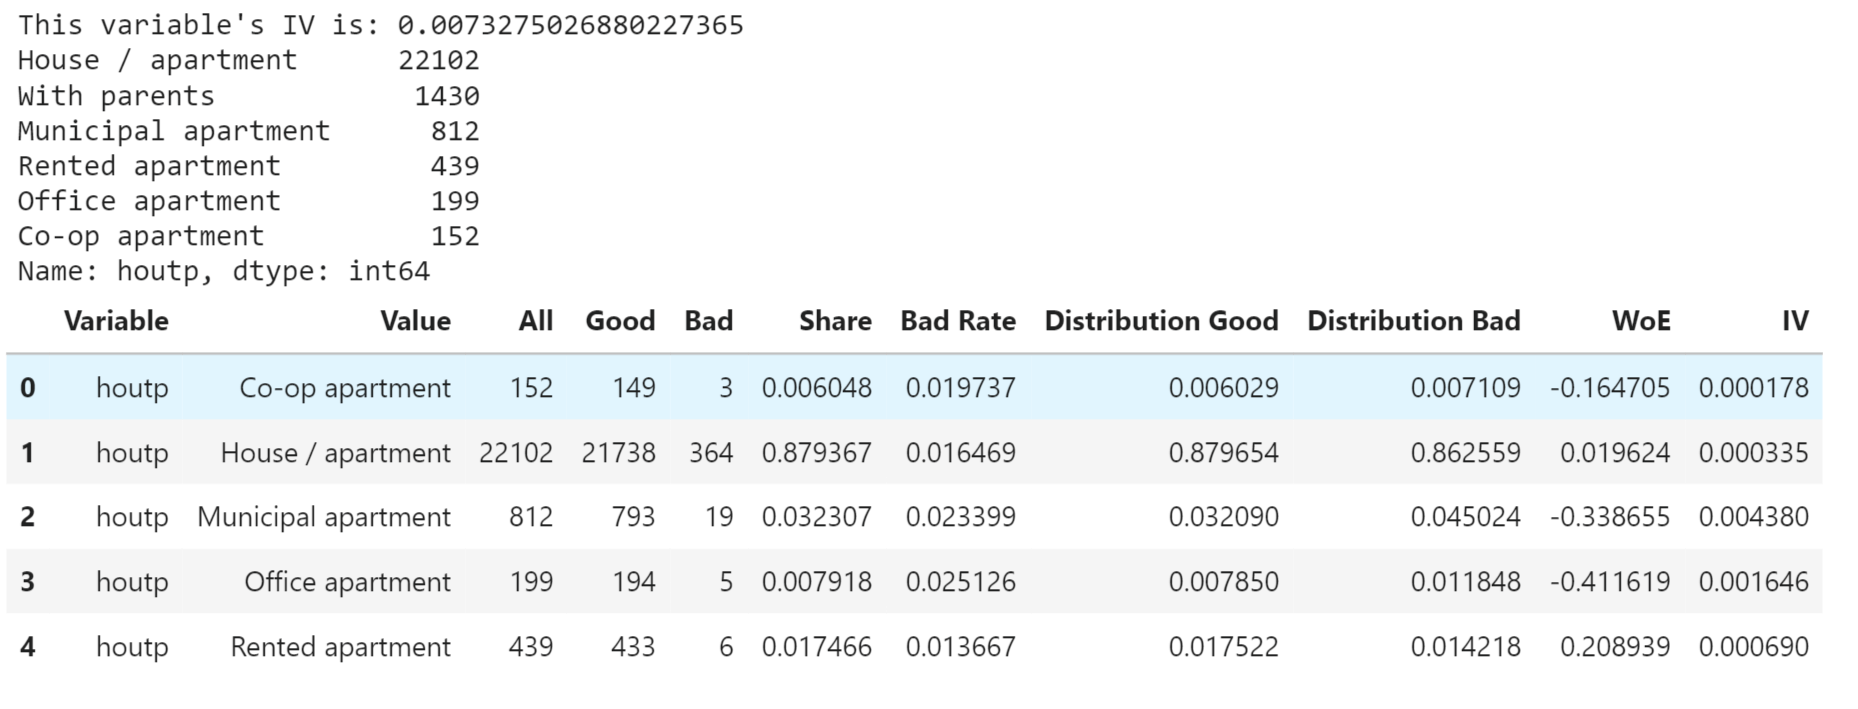
Education Output: 
Output: 
Output: 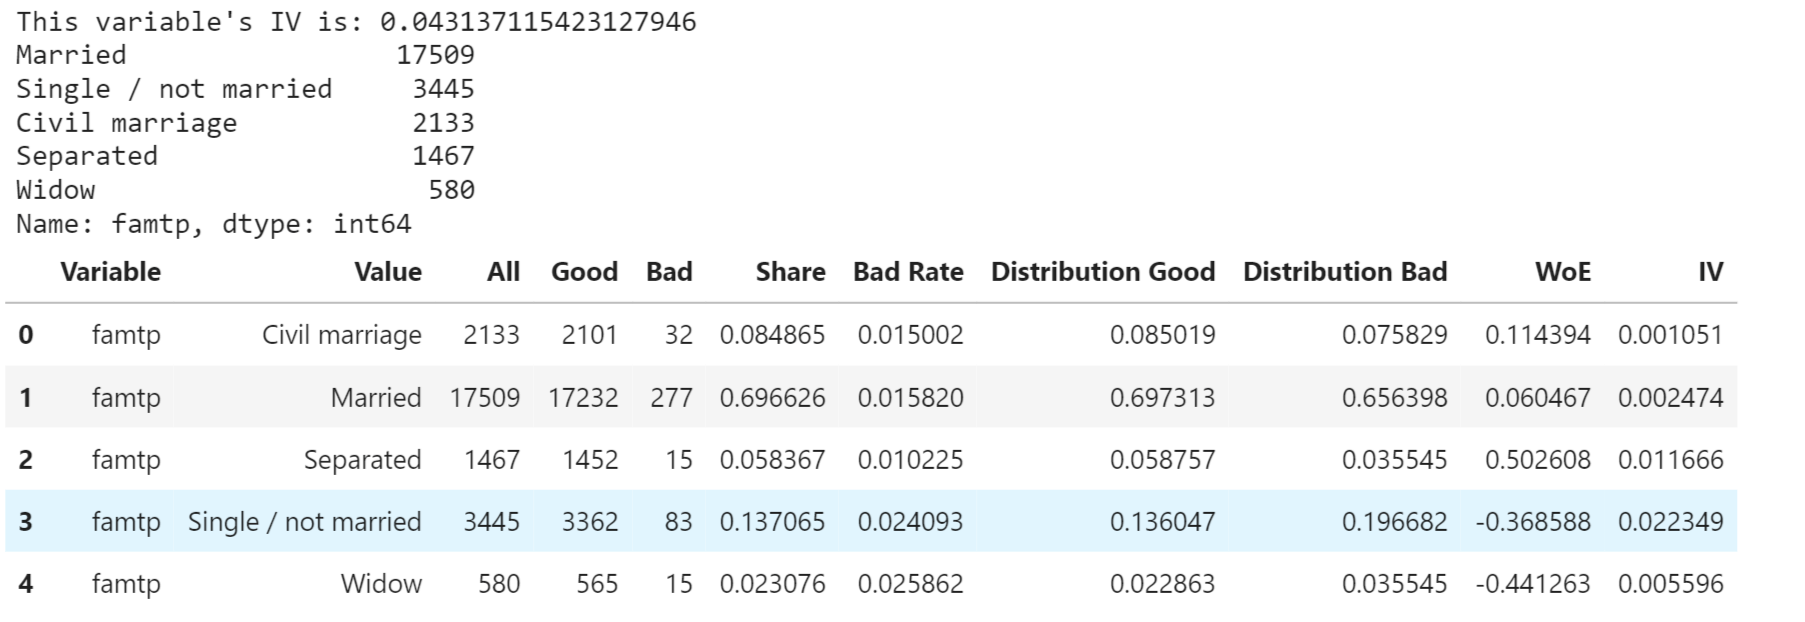
IV and WOEWeight of Evidence(WoE): woe_i = ln((P(yi) / P(ni)) = ln((yi / ys) / (ni / ns)) Where:
Information Value (IV): IV = Σ[(Pyi - Pni) * ln(Pyi / Pni)] Where:
The IV value measures the variable's ability to predict. Relationship between IV value and predictive power
Output: 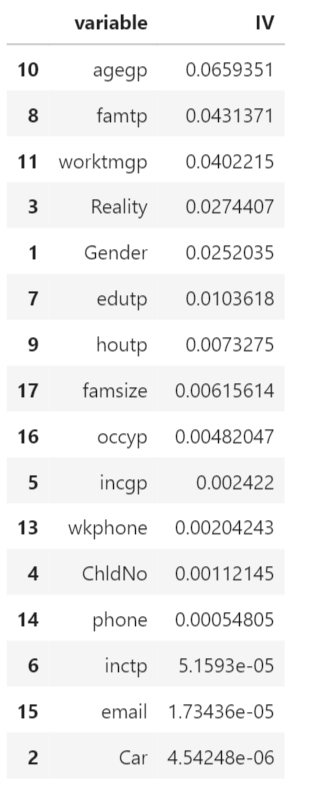
Age Group (agegp) has the highest IV of 0.0659351, indicating a relatively strong predictive power while other variables such as Work Phone (wkphone), Number of Children (ChldNo), Phone (phone), Income Type (inctp), Email (email), Car Ownership (Car), and Occupation Type (occyp) have very low IV values, suggesting they have little or no predictive power. Output: 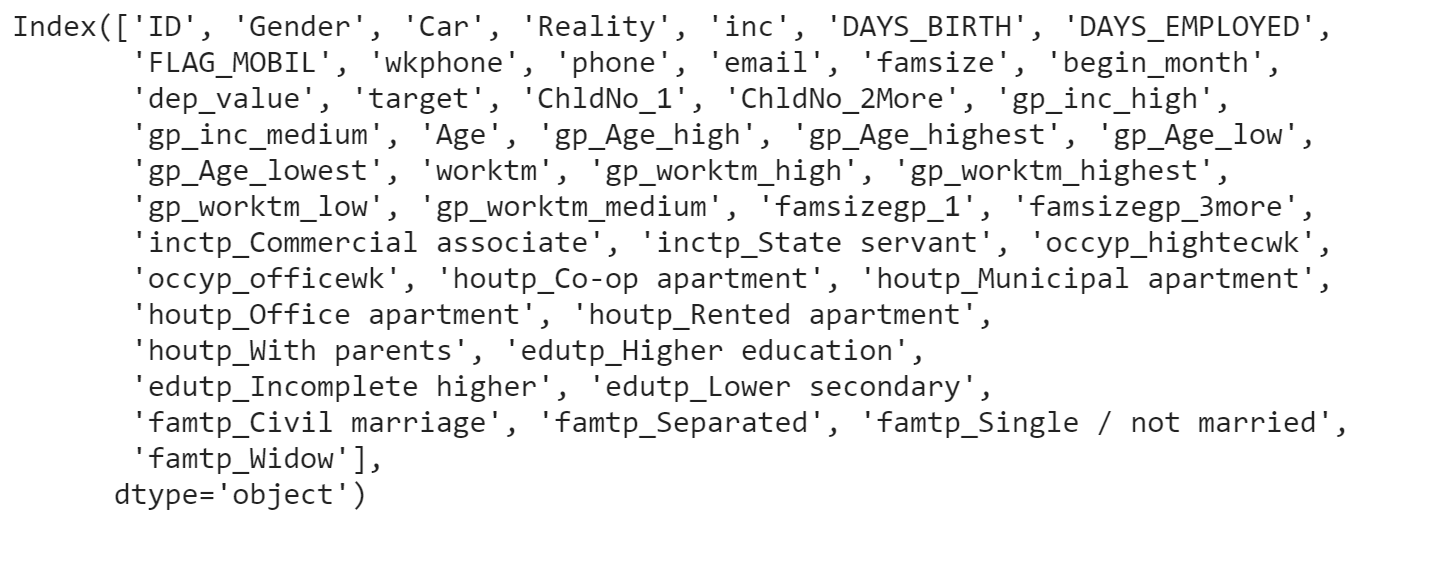
Splitting the DatasetNow we will split the dataset into a training and testing set. ModelingWe will then proceed to train and evaluate different machine learning algorithms, including logistic regression, decision trees, random forests, support vector machines (SVM), and gradient boosting methods. Each algorithm has its own strengths and characteristics, which makes it important to compare their performance and choose the one that best fits our credit card approval prediction task. 1. Logistic RegressionOutput: 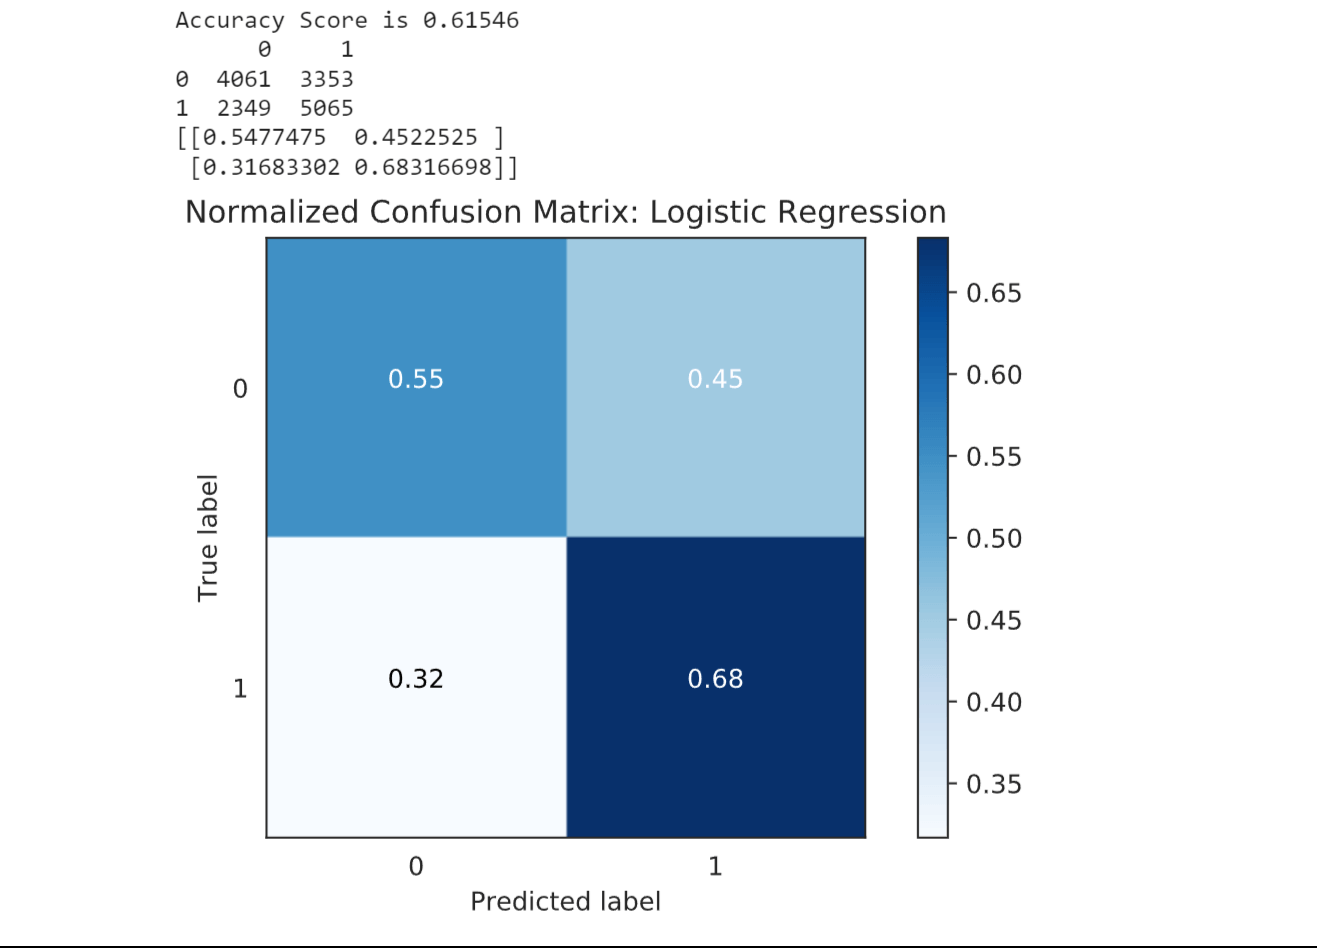
Logistic Regression (LR) achieved an accuracy score of 0.61215. This indicates that the model's ability to correctly predict credit card approval is moderate. 2. Decision TreeOutput: 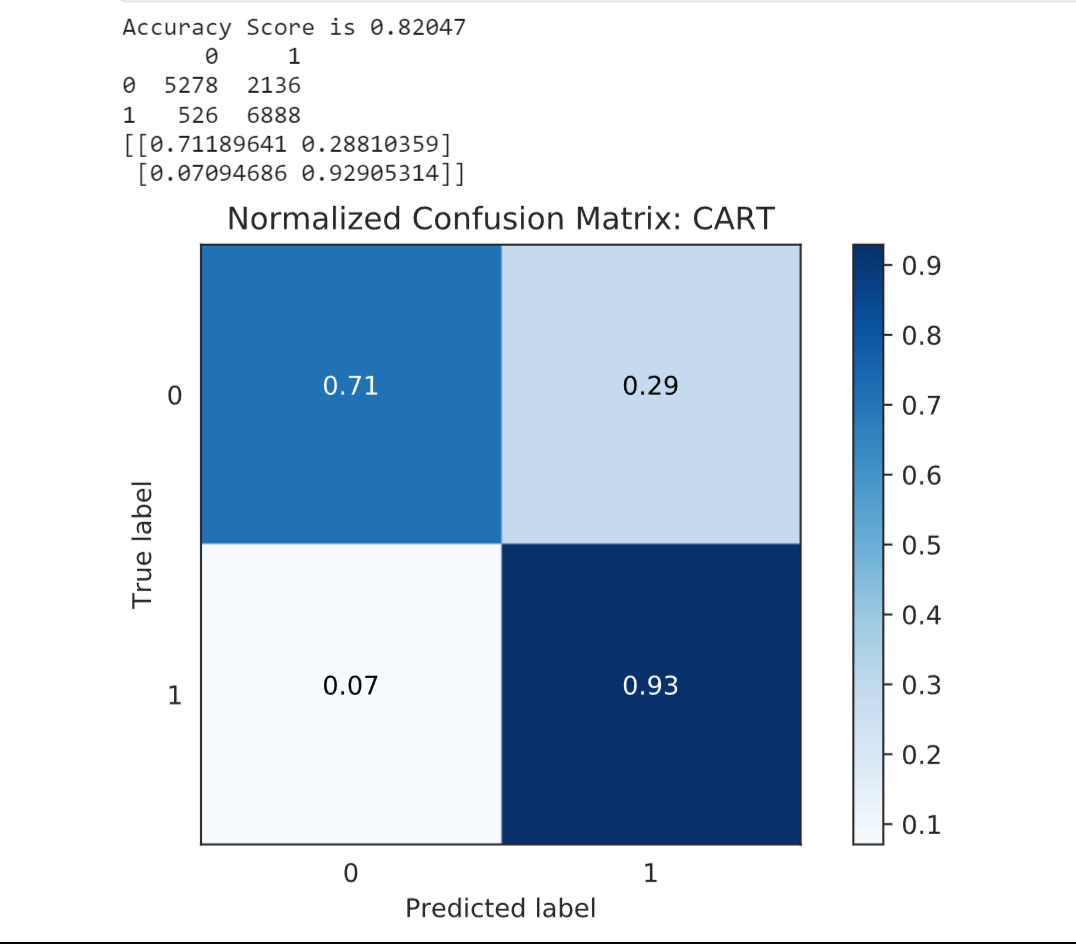
Decision Tree Classifier (DTC) performed better with an accuracy score of 0.82897. This suggests that the model is more effective in capturing the patterns and relationships in the data for credit card approval prediction. 3. Random ForestOutput: 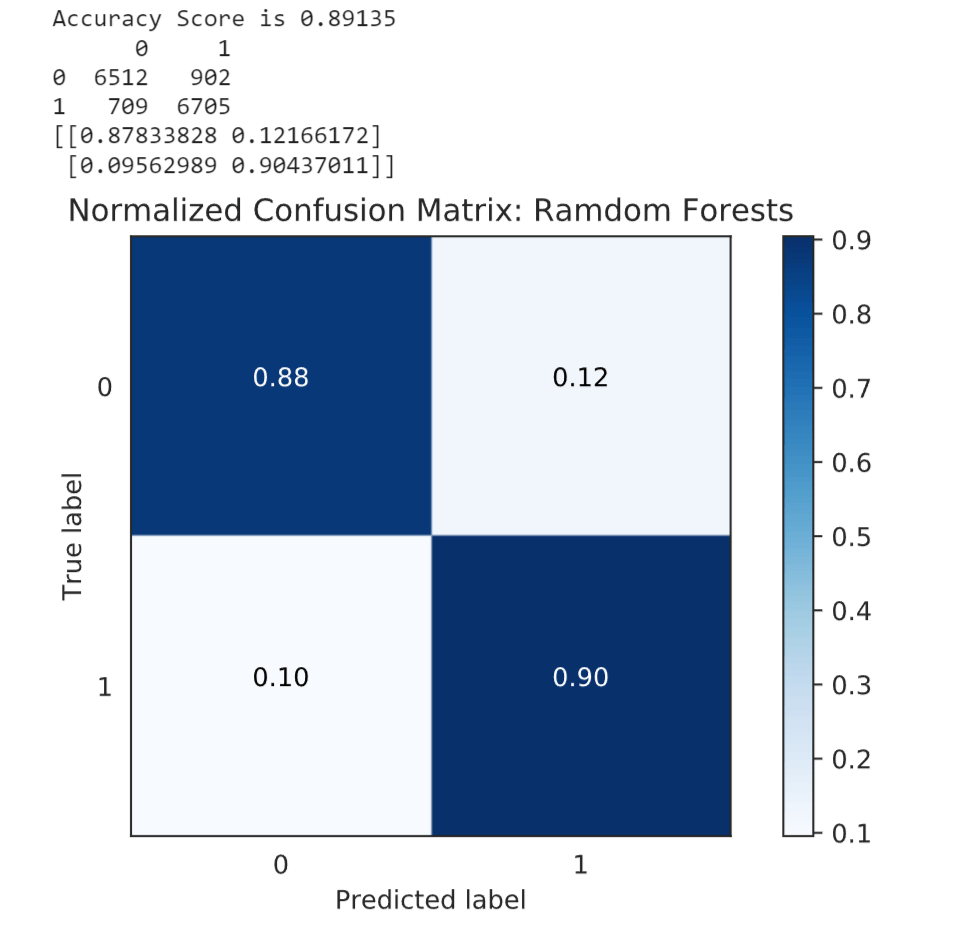
Random Forest Classifier (RFC) demonstrated a higher accuracy score of 0.89459. This indicates that the ensemble of decision trees in the random forest model improved the predictive performance compared to the single decision tree. 4. SVMOutput: 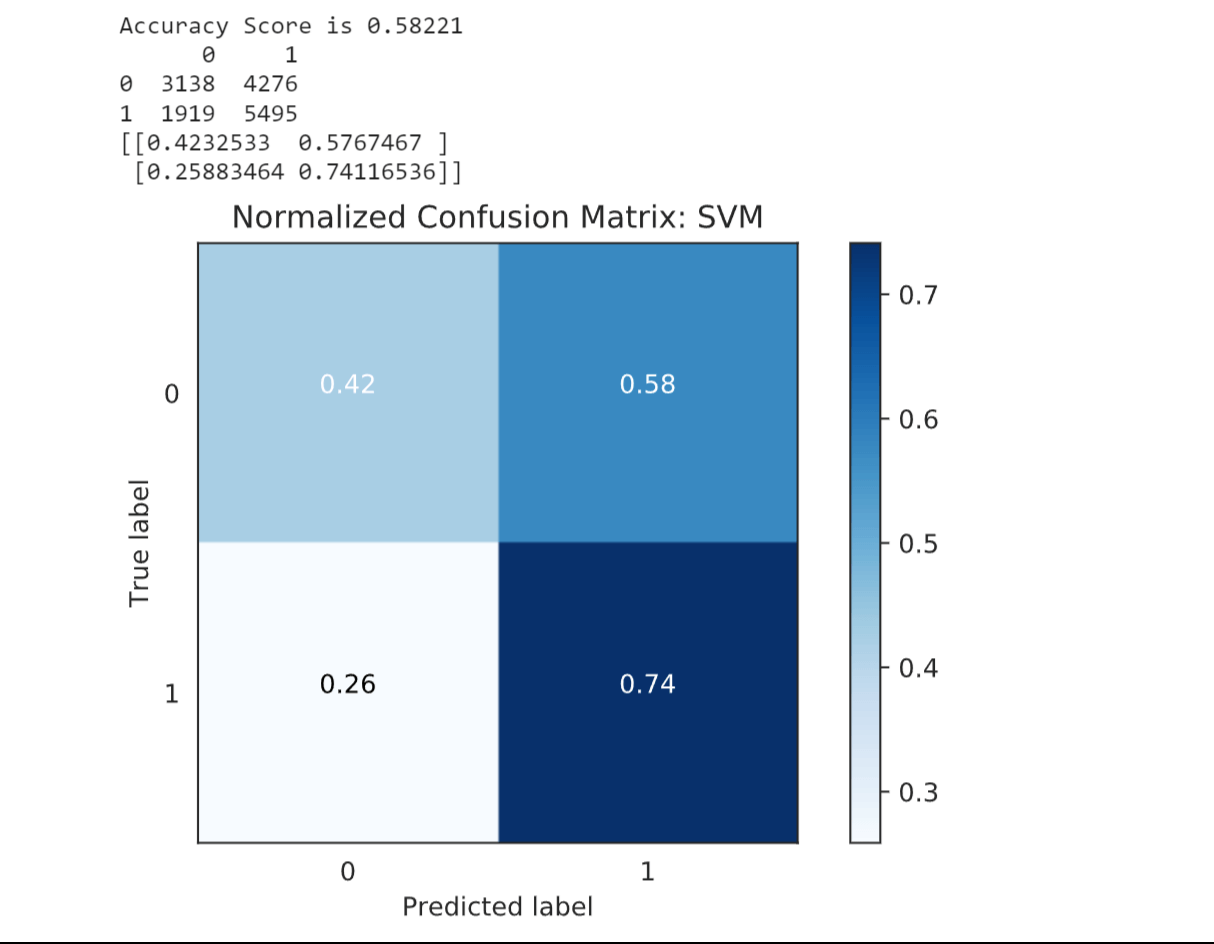
Support Vector Machines (SVM) had a lower accuracy score of 0.59367, indicating that they may not be as effective in capturing the complexities of the credit card approval prediction task in this case. 5. LightGBMOutput: 
Light GBM achieved a high accuracy score of 0.90356, suggesting that the gradient boosting algorithm used in this model effectively improved the prediction accuracy compared to the other models. Output: 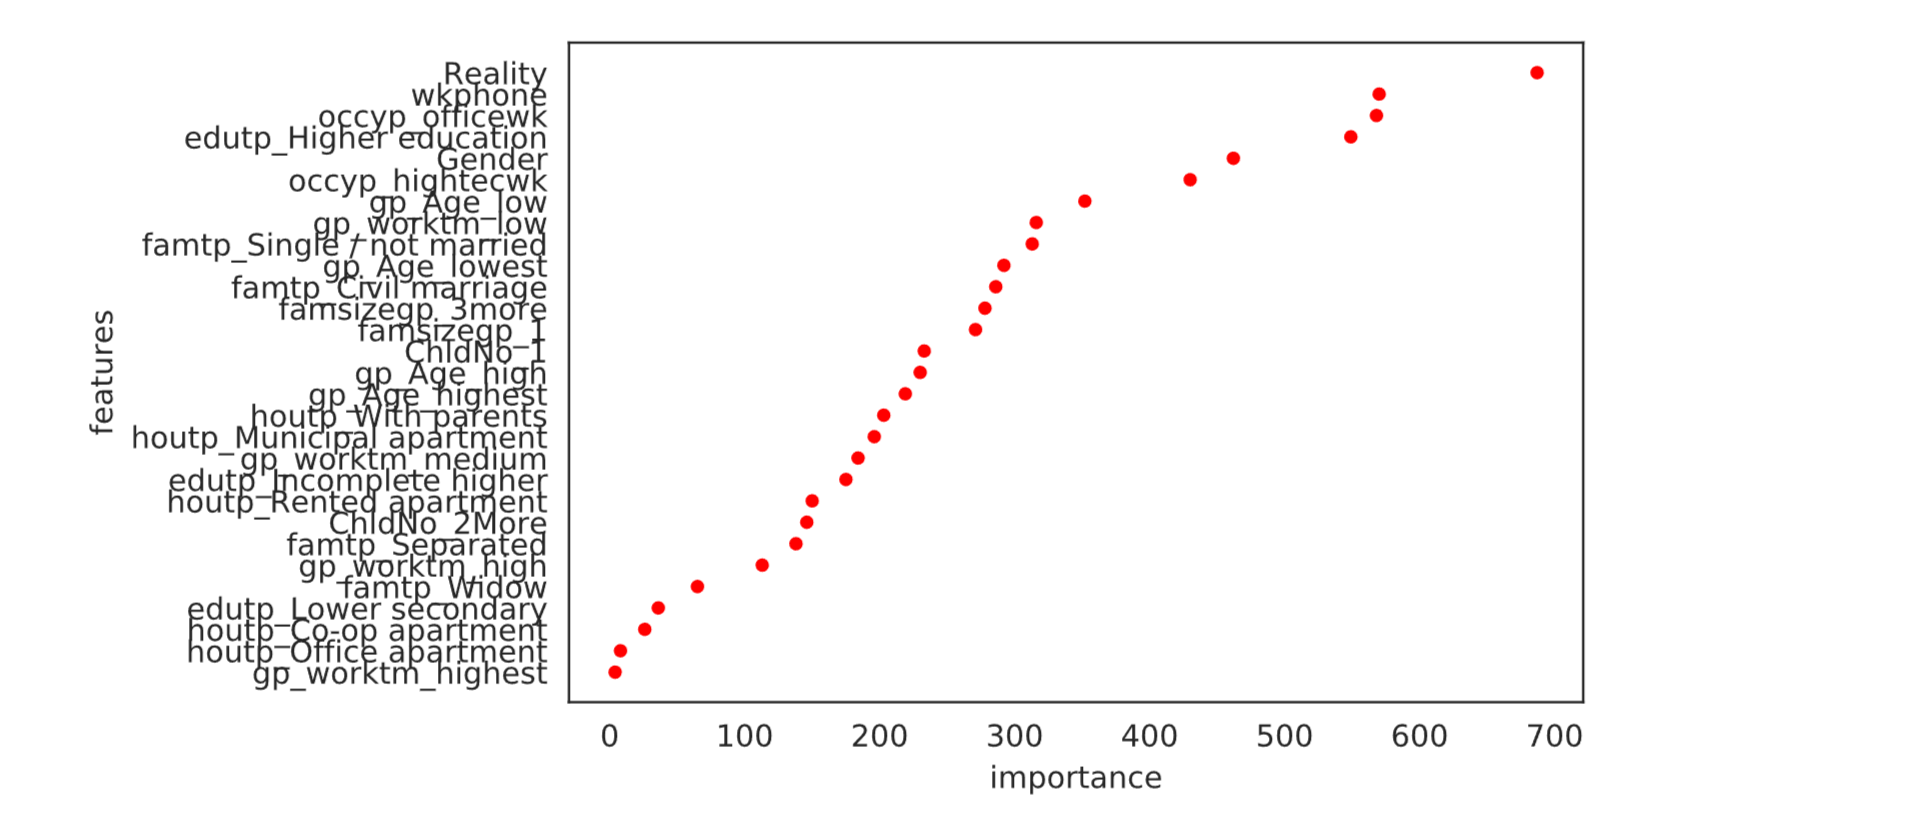
Output: 
6. XGBoostOutput: 
XGBoost performed with a high accuracy score of 0.93789. This indicates that the extreme gradient boosting algorithm employed in XGBoost captured the intricate patterns in the data and made highly accurate predictions for credit card approval. Output: 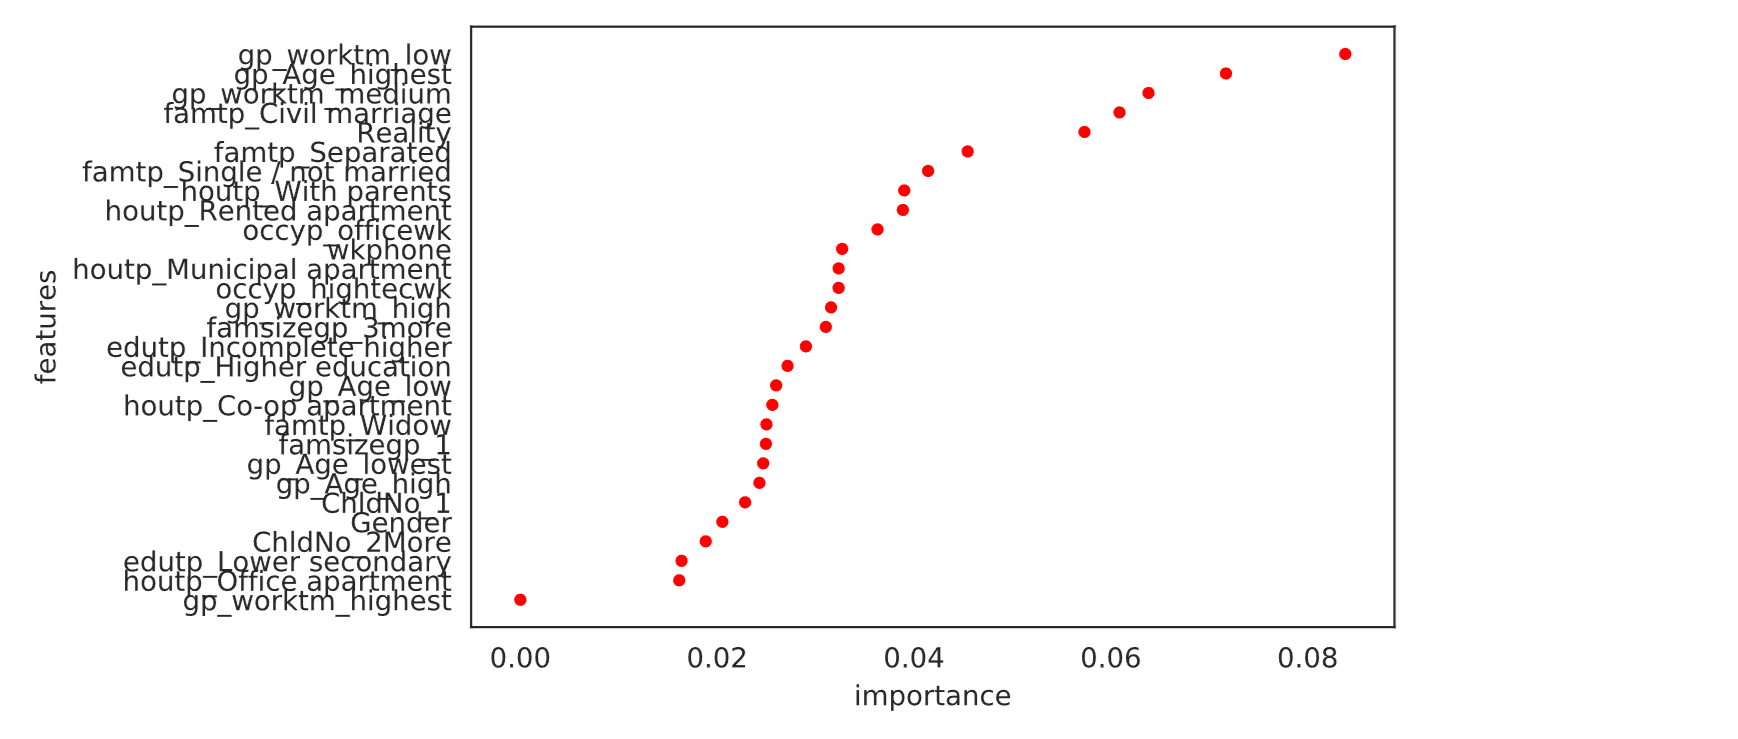
7. CatBoostOutput: 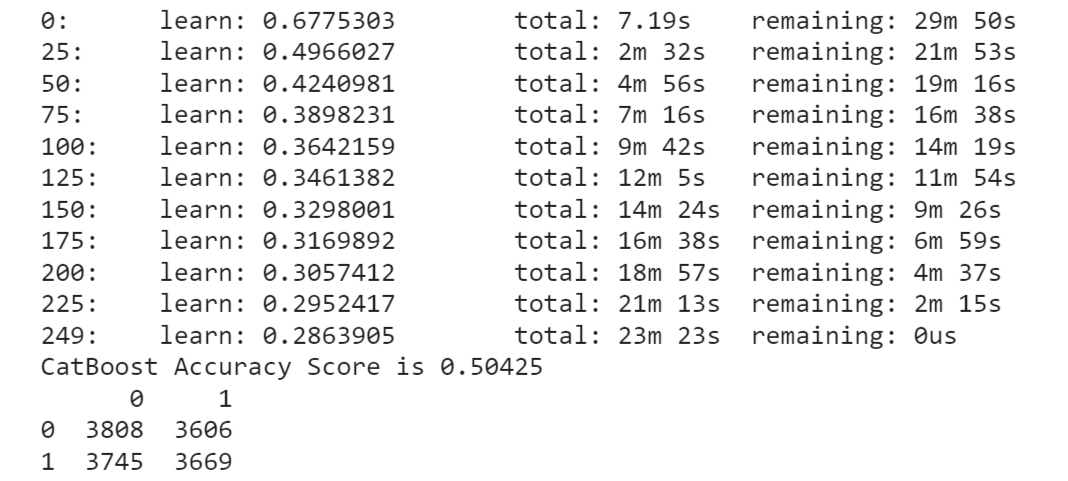
CatBoost, however, achieved a relatively lower accuracy score of 0.50081. This suggests that the model did not perform well in this context and may require further investigation or parameter tuning to improve its predictive capabilities. XGBoost model exhibited the highest accuracy among the models considered, followed by Light GBM and Random Forest Classifier. These models appear to be more suitable for predicting credit card approval. ConclusionCredit card approval using machine learning offers numerous benefits, including enhanced accuracy, faster processing, personalized offerings, and risk mitigation. By leveraging machine learning algorithms, financial institutions can streamline the approval process, provide customized credit card solutions, and make informed lending decisions. However, it is crucial to address challenges related to data privacy, model interpretability, and fairness to ensure responsible and ethical implementation of machine learning in credit card approval. With proper consideration and oversight, machine learning has the potential to revolutionize the lending landscape, benefiting both consumers and lenders alike. |
 For Videos Join Our Youtube Channel: Join Now
Feedback
- Send your Feedback to [email protected]
Help Others, Please Share


