Liver Disease Prediction Using Machine Learning
Liver disease is a significant global health concern, affecting millions of individuals worldwide. Early and accurate detection of liver disease is crucial for effective treatment and prevention of further complications. In recent years, machine learning has emerged as a powerful tool in the field of healthcare, enabling the development of predictive models that can assist in the diagnosis and prognosis of various medical conditions, including liver disease. Application of Machine Learning in Liver Disease PredictionMachine learning algorithms have found diverse applications in the field of liver disease prediction. By analyzing patient data and medical records, machine-learning models can identify patterns and risk factors associated with liver diseases. Some of the key applications include:
Benefits of Using Machine Learning for Liver Disease PredictionThe integration of machine learning into liver disease prediction offers several benefits:
Challenges in Liver Disease Prediction Using Machine LearningDespite the numerous advantages, there are challenges associated with applying machine learning to liver disease prediction:
Here, We will try to implement it in code. Data SummaryPatients with Liver disease have been continuously increasing because of excessive consumption of alcohol, inhaling of harmful gases, and intake of contaminated food, pickles, and drugs. This dataset was used to evaluate prediction algorithms in an effort to reduce the burden on doctors. ContentThis data set contains 416 liver patient records and 167 non-liver patient records collected from North East of Andhra Pradesh, India. The "Dataset" column is a class label used to divide groups into the liver patient (liver disease) or not (no disease). This data set contains 441 male patient records and 142 female patient records. Any patient whose age exceeded 89 is listed as being of age "90". Columns
Importing LibrariesOutput: 
EDAOutput: 
Output: 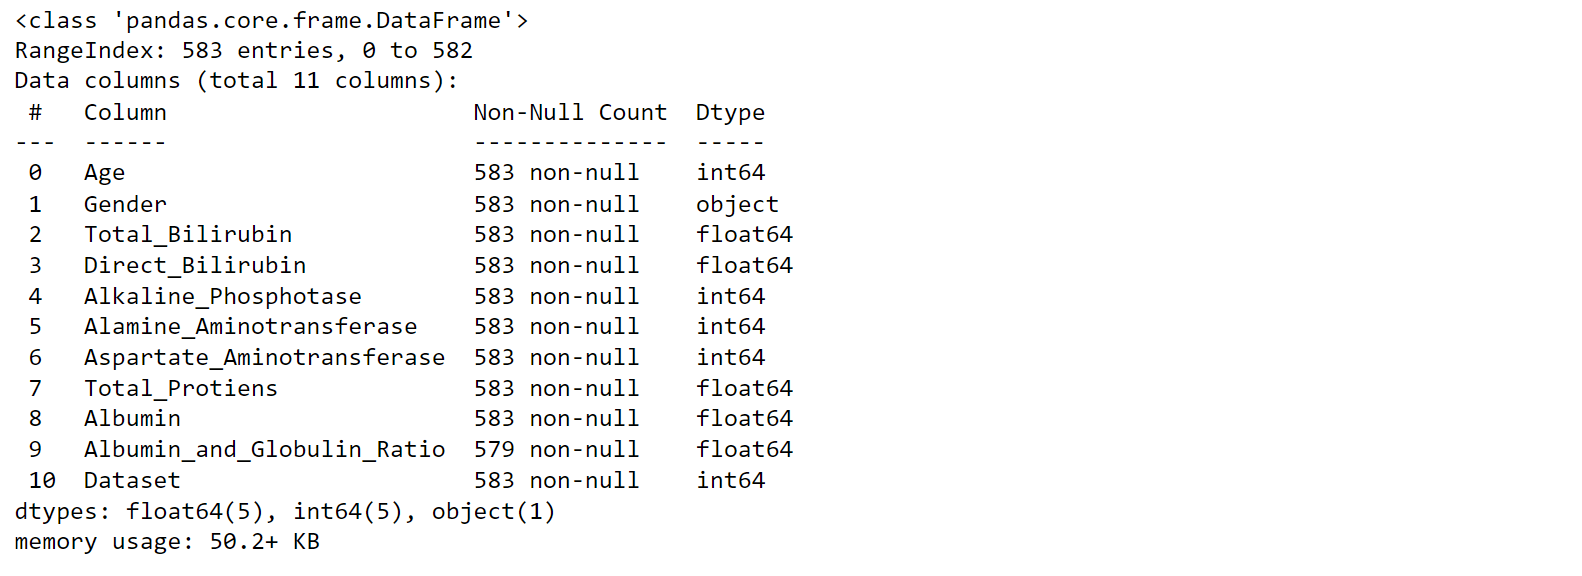
The feature named "Albumin_and_Globulin_Ratio" is incomplete as it lacks 583 values. Therefore, we need to address this issue during the data preprocessing phase. Now, We intend to assess the balance of the data by creating a histogram visualization. Output: 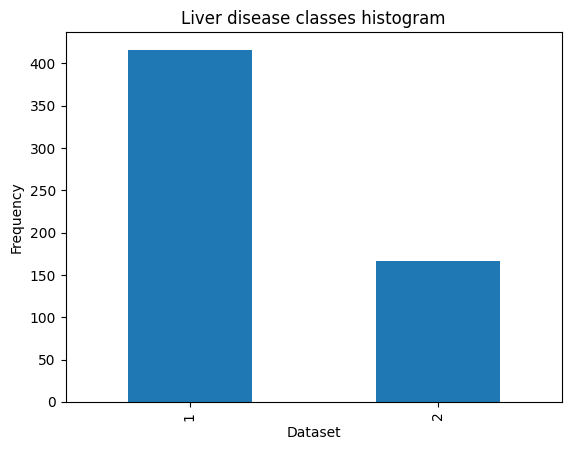
In order to simplify the class labels, we need to reassign them. For patients without liver disease, we will assign the label 0, and for patients with liver disease, we will assign the label 1. Output: 
At this point, I will replace the missing values with zeros. Output: 
Output: 
Based on the information provided in the table, since the ranges vary for different features, it is necessary to perform feature scaling. Output: 
Now, in order to encode the categorical data into numerical values, We utilized the conventional pandas function called "get_dummies". Since there is only one column that requires encoding, this function was sufficient for the task. Output: 
To examine the relationships between the features, utilizing the "corr()" function and generating a heatmap is a valuable approach. This allows for a visual representation of the correlations between the features. Output: 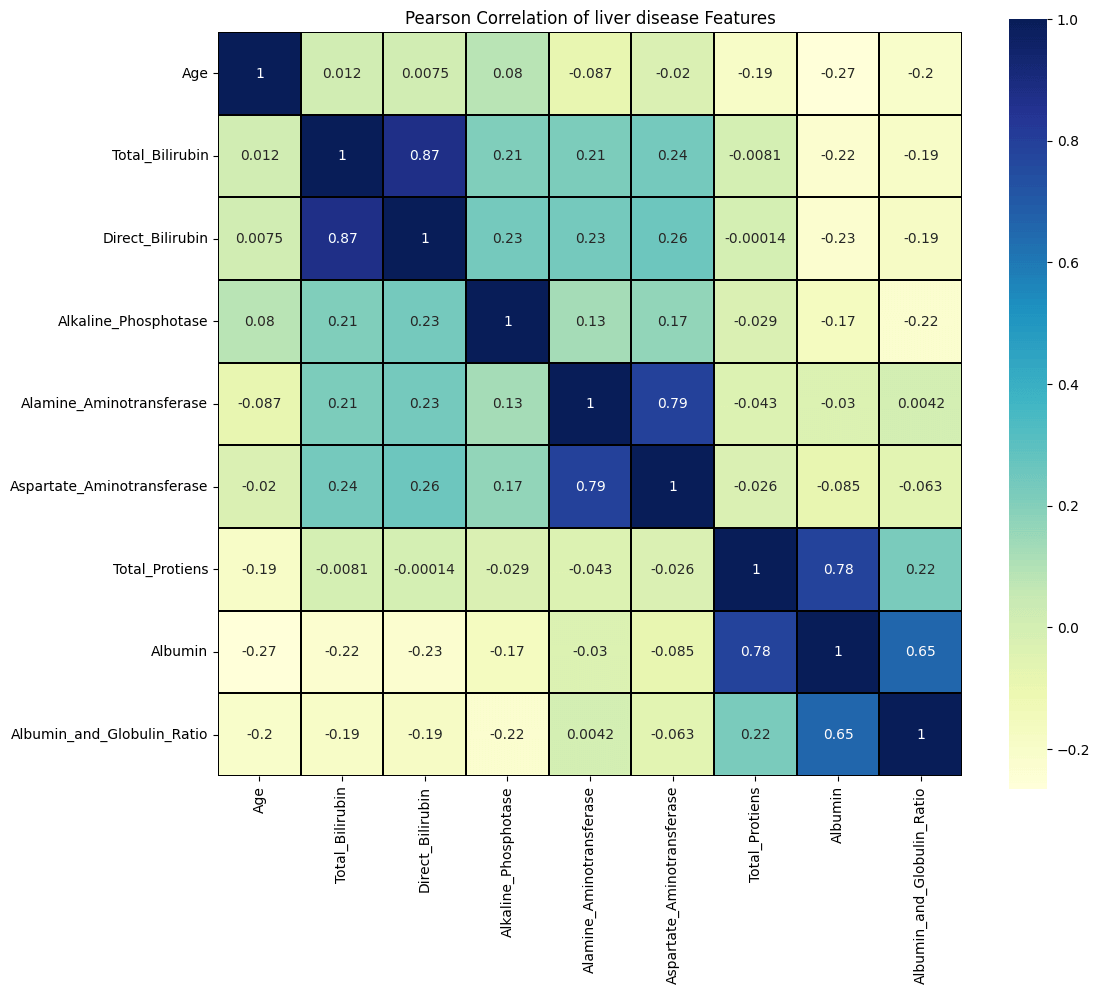
Based on the heatmap analysis, it is evident that there is a strong correlation between certain pairs of features. Specifically, there is a high correlation between "Direct_Bilirubin" and "Total_Bilirubin," "Alamine Aminotransferase" and "Aspartate Aminotransferase," and "Total Protiens" and "Albumin." We will now utilize the Support Vector Classifier (SVC) on the dataset without employing any sampling techniques solely to evaluate its performance. Output: Output: 
Output: 
Output: 
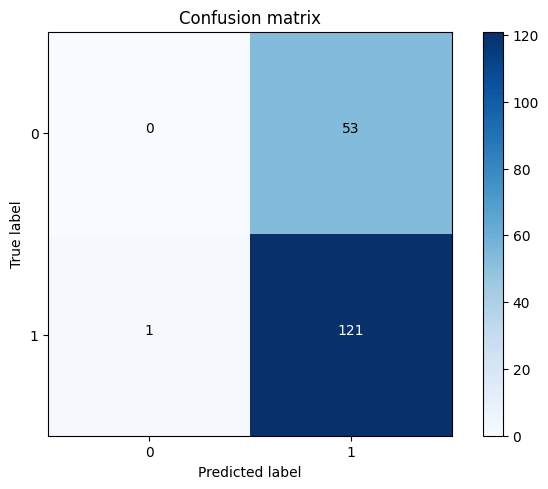
Based on the confusion matrix, we observe that there are no true negatives, which is an incorrect outcome for the algorithm. This suggests that the algorithm, being unbalanced, consistently predicts that the patient has liver disease. We need to tune the model. Output: 
Output: 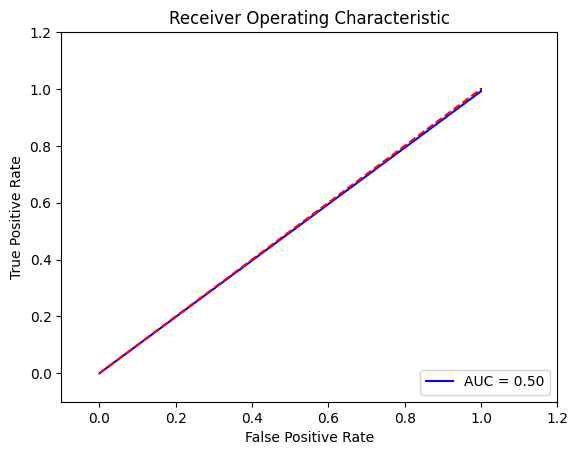
Based on the analysis of the ROC curve and confusion matrix, it is evident that there is a need to minimize the number of false positives since they represent incorrect predictions. In order to optimize the model, We have utilized the GridSearchCV method. Output: 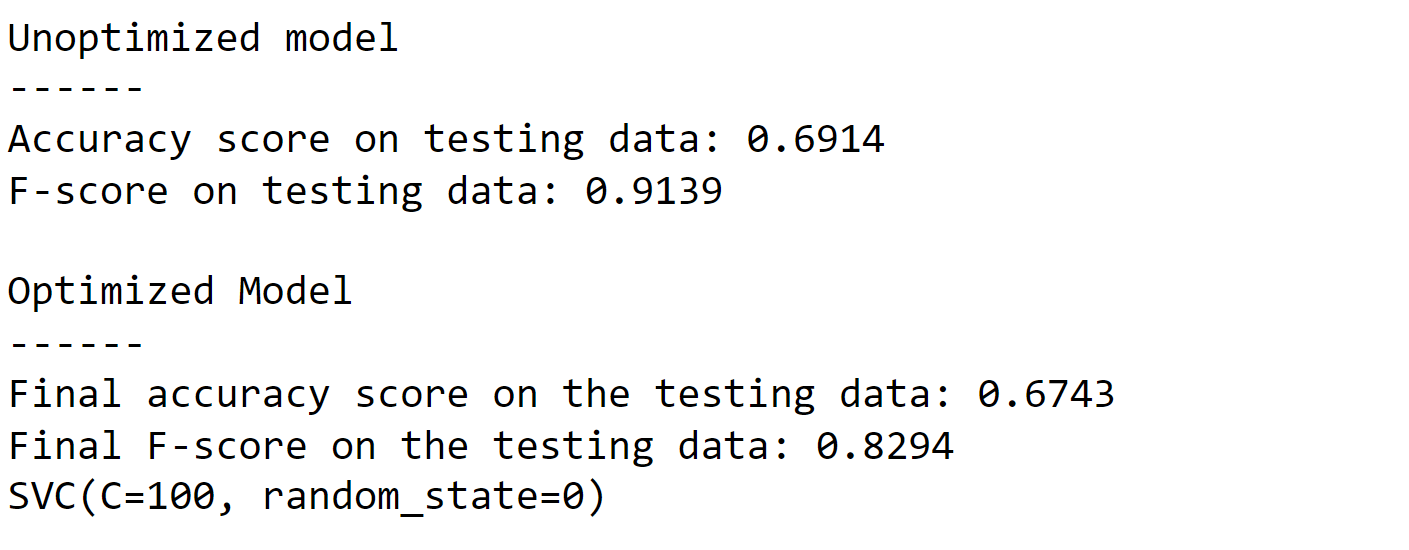
Output: 
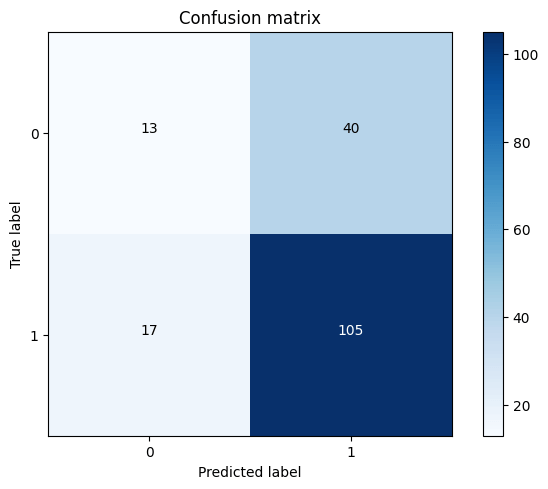
With the inclusion of true negative cases, the ROC curve is expected to demonstrate improved performance. Output: 
Output: 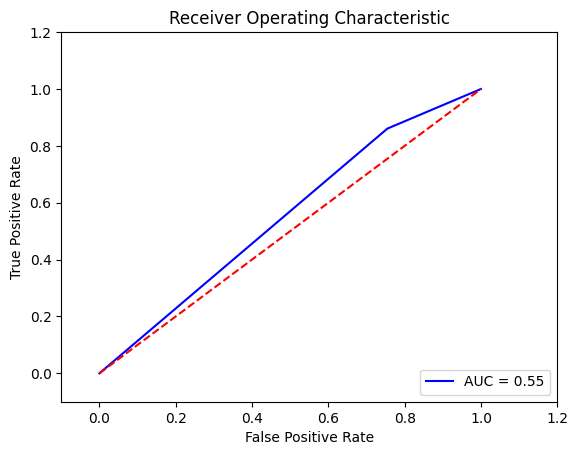
The ROC curve exhibits an improved AUC of 0.58 compared to the unoptimized model. However, it is still not considered a highly effective model. This could be attributed to the unbalanced nature of the dataset, which limits the improvement in AUC. Additionally, the relatively small size of the dataset may also contribute to the limitations of the model's performance. I will apply the oversampling technique to balance the dataset and augment the data volume. Output: 
Output: 
Output: 
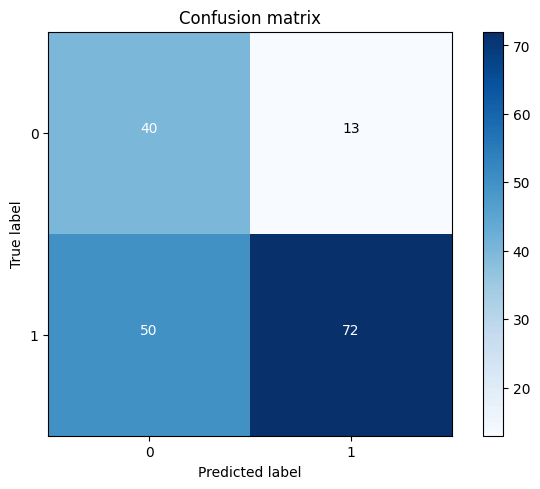
The recall metric shows a low value, indicating the need to optimize the model for improvement. Output: 
Output: 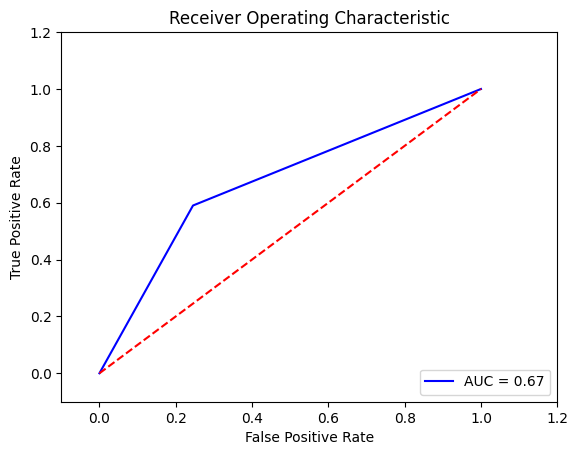
Output: 
Output: 
Output: 
Output: 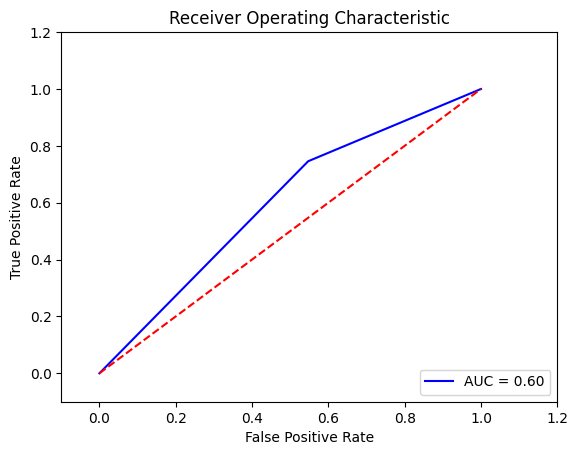
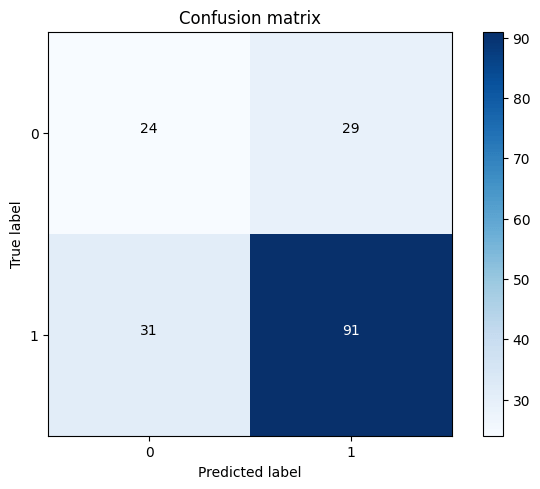
Despite employing the SMOTE technique, the performance of SVC is still not satisfactory. Both the recall metric and AUC score are approximately 0.67, which falls short of the desired level. Therefore, We decided to explore the RandomForestClassifier as an alternative approach. Output: 
Output: 
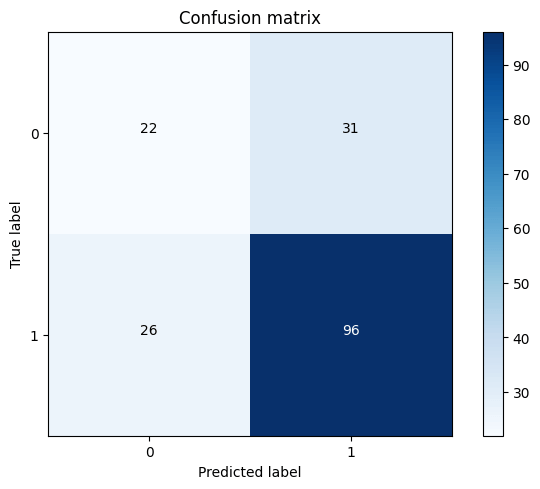
The recall metric has shown improvement compared to SVC after using the RandomForestClassifier. However, the model still requires further tuning to optimize its performance. Output: 
Output: 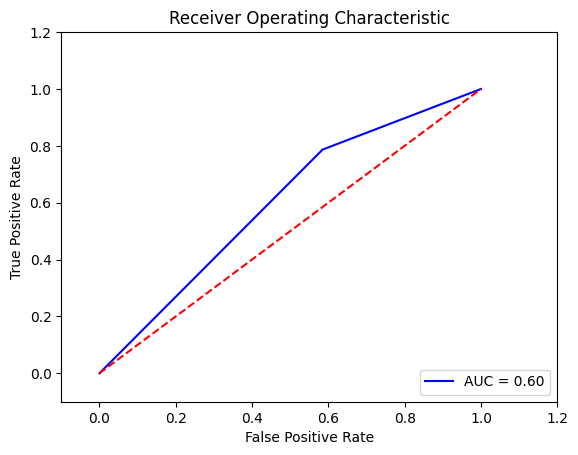
Output: 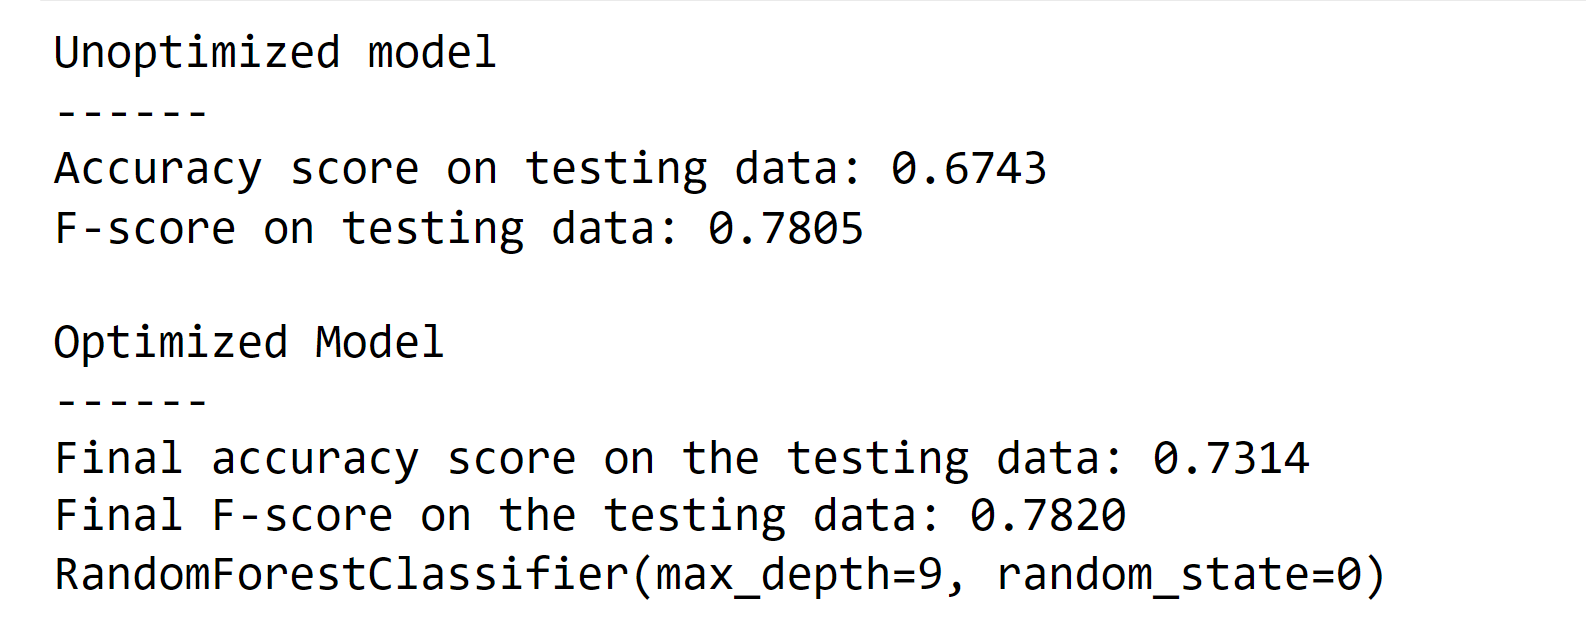
Output: 
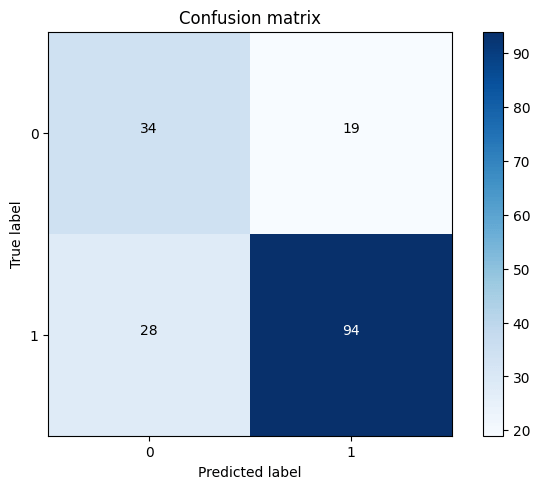
Output: 
Output: 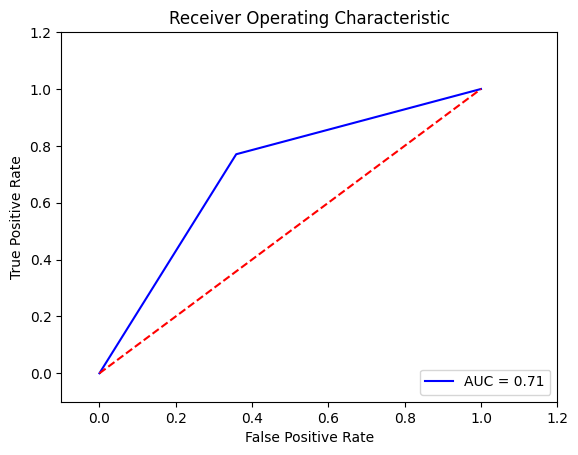
After applying GridSearchCV to optimize the RandomForestClassifier, the model achieved a recall metric of 0.76 and an AUC of 0.69 on the ROC curve. Future Aspects of Liver Disease Prediction Using Machine LearningAs machine learning continues to evolve, several future aspects hold promise for liver disease prediction:
ConclusionMachine learning has emerged as a valuable tool for liver disease prediction, offering significant benefits in terms of accuracy, early detection, and personalized medicine. However, challenges such as data availability, model interpretability, and ethical considerations need to be addressed. The future holds immense potential for further advancements in machine learning techniques, enabling more accurate and efficient liver disease prediction. By harnessing the power of machine learning, we can improve patient outcomes and make significant strides in combating liver diseases worldwide. |
 For Videos Join Our Youtube Channel: Join Now
Feedback
- Send your Feedback to [email protected]
Help Others, Please Share


