| |

Customer Churn Prediction Using Machine Learning
Customer churn (also known as customer attrition) occurs when a customer stops using a company's products or services. Customer churn affects profitability, especially in industries where revenues are heavily dependent on subscriptions (e.g. banks, telephone and internet service providers, pay-TV companies, insurance firms, etc.). It is estimated that acquiring a new customer can cost up to five times more than retaining an existing one. Therefore, customer churn analysis is essential as it can help a business:
A range of machine learning techniques, including logistic regression, decision trees, random forests, support vector machines, and neural networks, are widely employed in the prediction of customer churn. These algorithms analyze historical customer data and pertinent characteristics to develop models capable of effectively categorizing customers as either churners or non-churners. Code: Importing LibrariesOutput: 
Parameters and VariablesIt is convenient to have some default parameters and variables. FunctionsSince we will reuse parts of the code, it will be helpful to define some functions. Importing DatasetOutput: 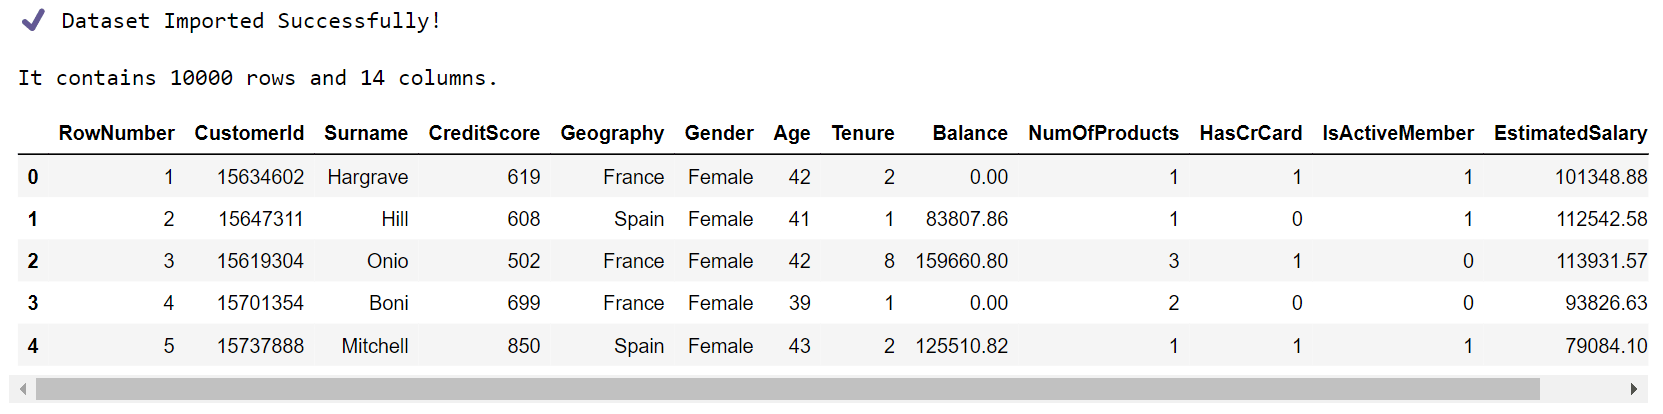
Our DataFrame has 14 features/attributes and 10K customers/instances. The last feature, 'Exited', is the target variable and indicates whether the customer has churned (0 = No, 1 = Yes). The meaning of the rest of the features can be easily inferred from their name. Features 'RowNumber', 'CustomerId', and 'Surname' are specific to each customer and can be dropped. Output: 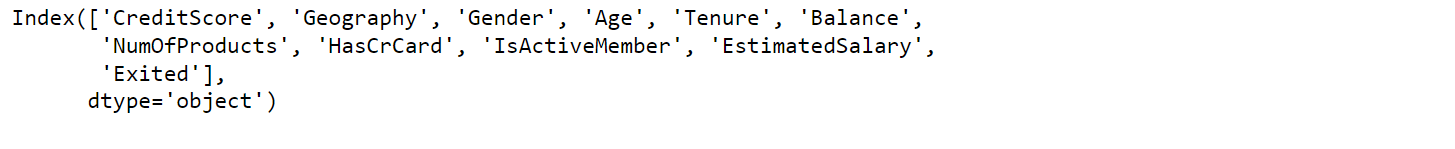
Output: 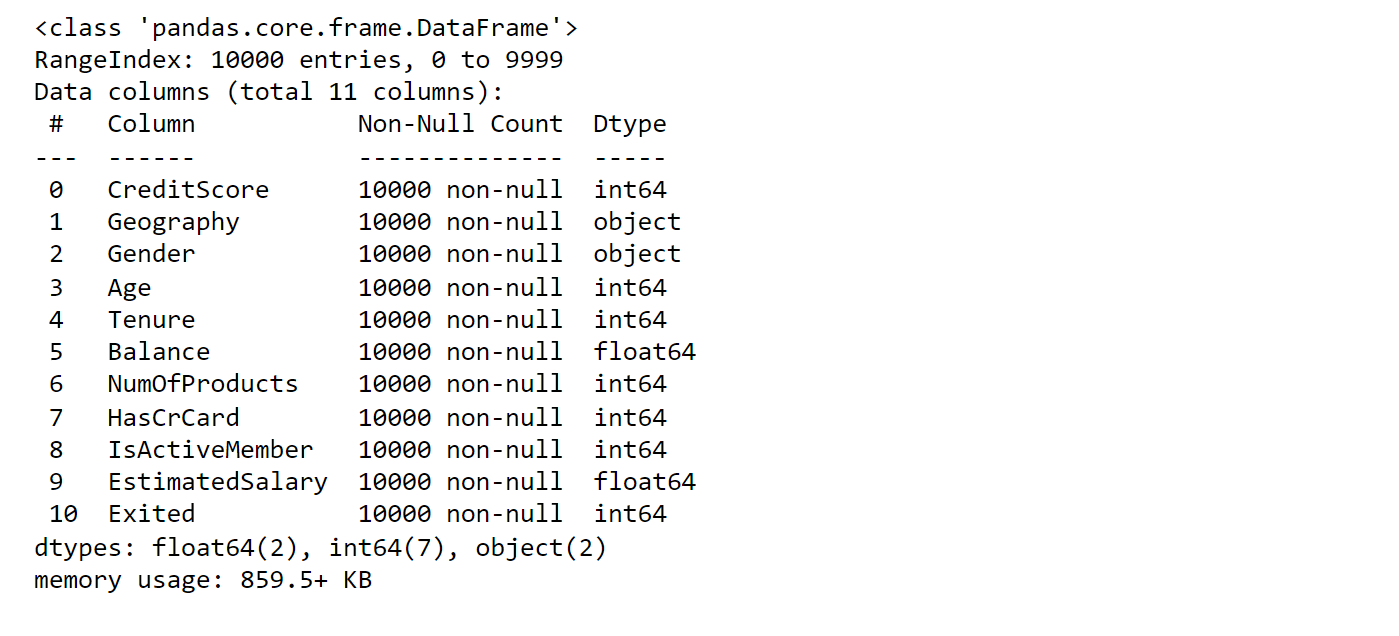
There are no missing values in our DataFrame. Output: 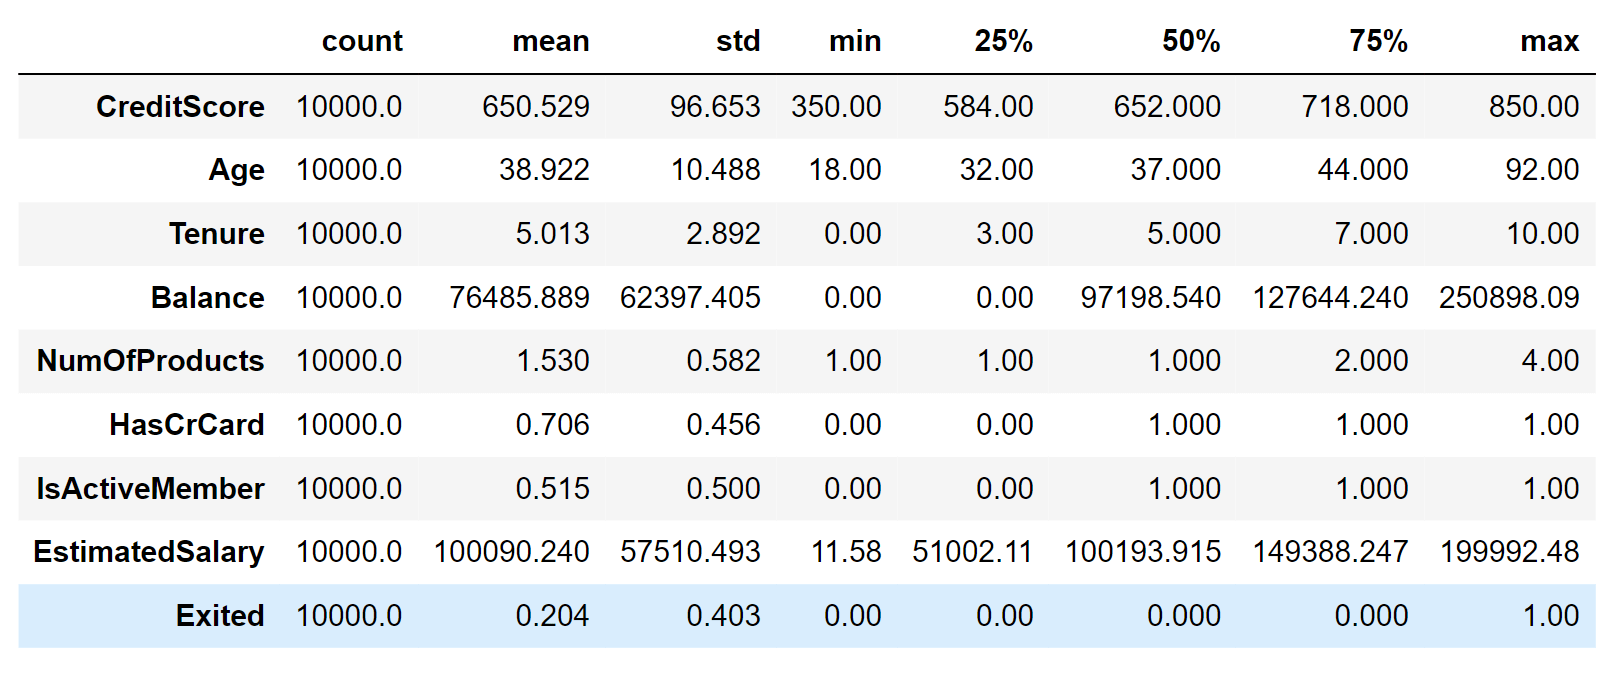
The most important things to note are:
EDA will help us understand our dataset better. However, before we look at the data any further, we need to create a test set, put it aside, and use it only to evaluate our Machine Learning models. Splitting the DatasetWe will split our dataset into a train and test set using scikit-learn's train_test_split() function, which implements random sampling. Our dataset is large enough (especially relative to the number of features), so we do not risk introducing sampling bias. Output: 
Exploratory Data AnalysisThe target variable('Exited') is already encoded and can take two possible values:
Output: 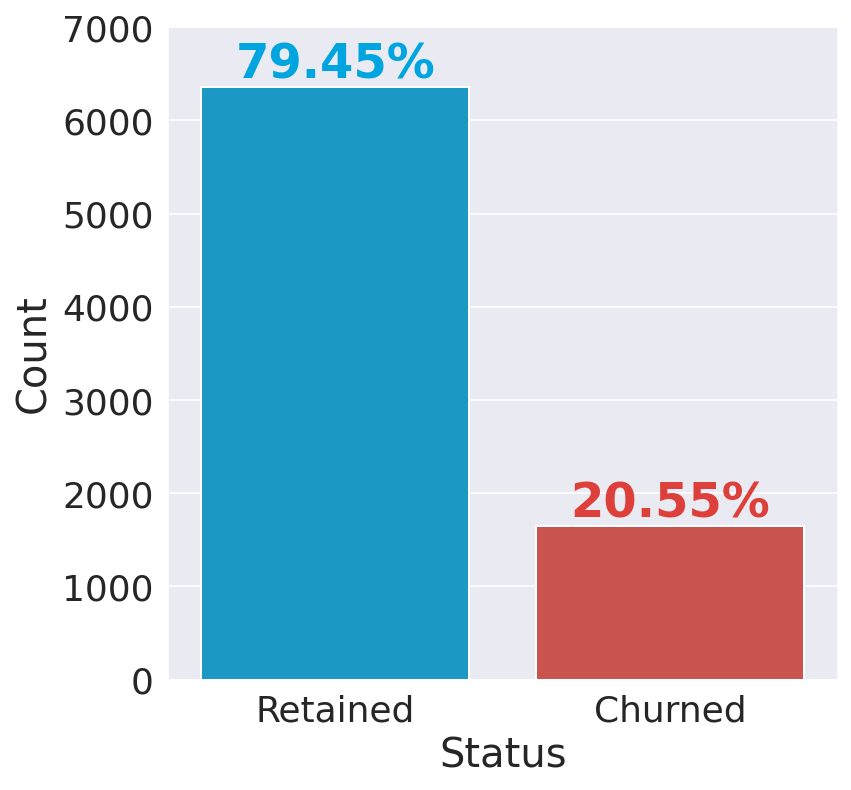
The bank kept 80% of its clientele. Notice that our dataset is skewed/imbalanced since the number of instances in the 'Retained' class outnumbers the number of instances in the 'Churned' class by a lot. Therefore, accuracy is probably not the best metric for model performance. Different visualization techniques apply to different types of variables, so it's helpful to differentiate between continuous and categorical variables and look at them separately. Output: 
Continuous VariablesOutput: 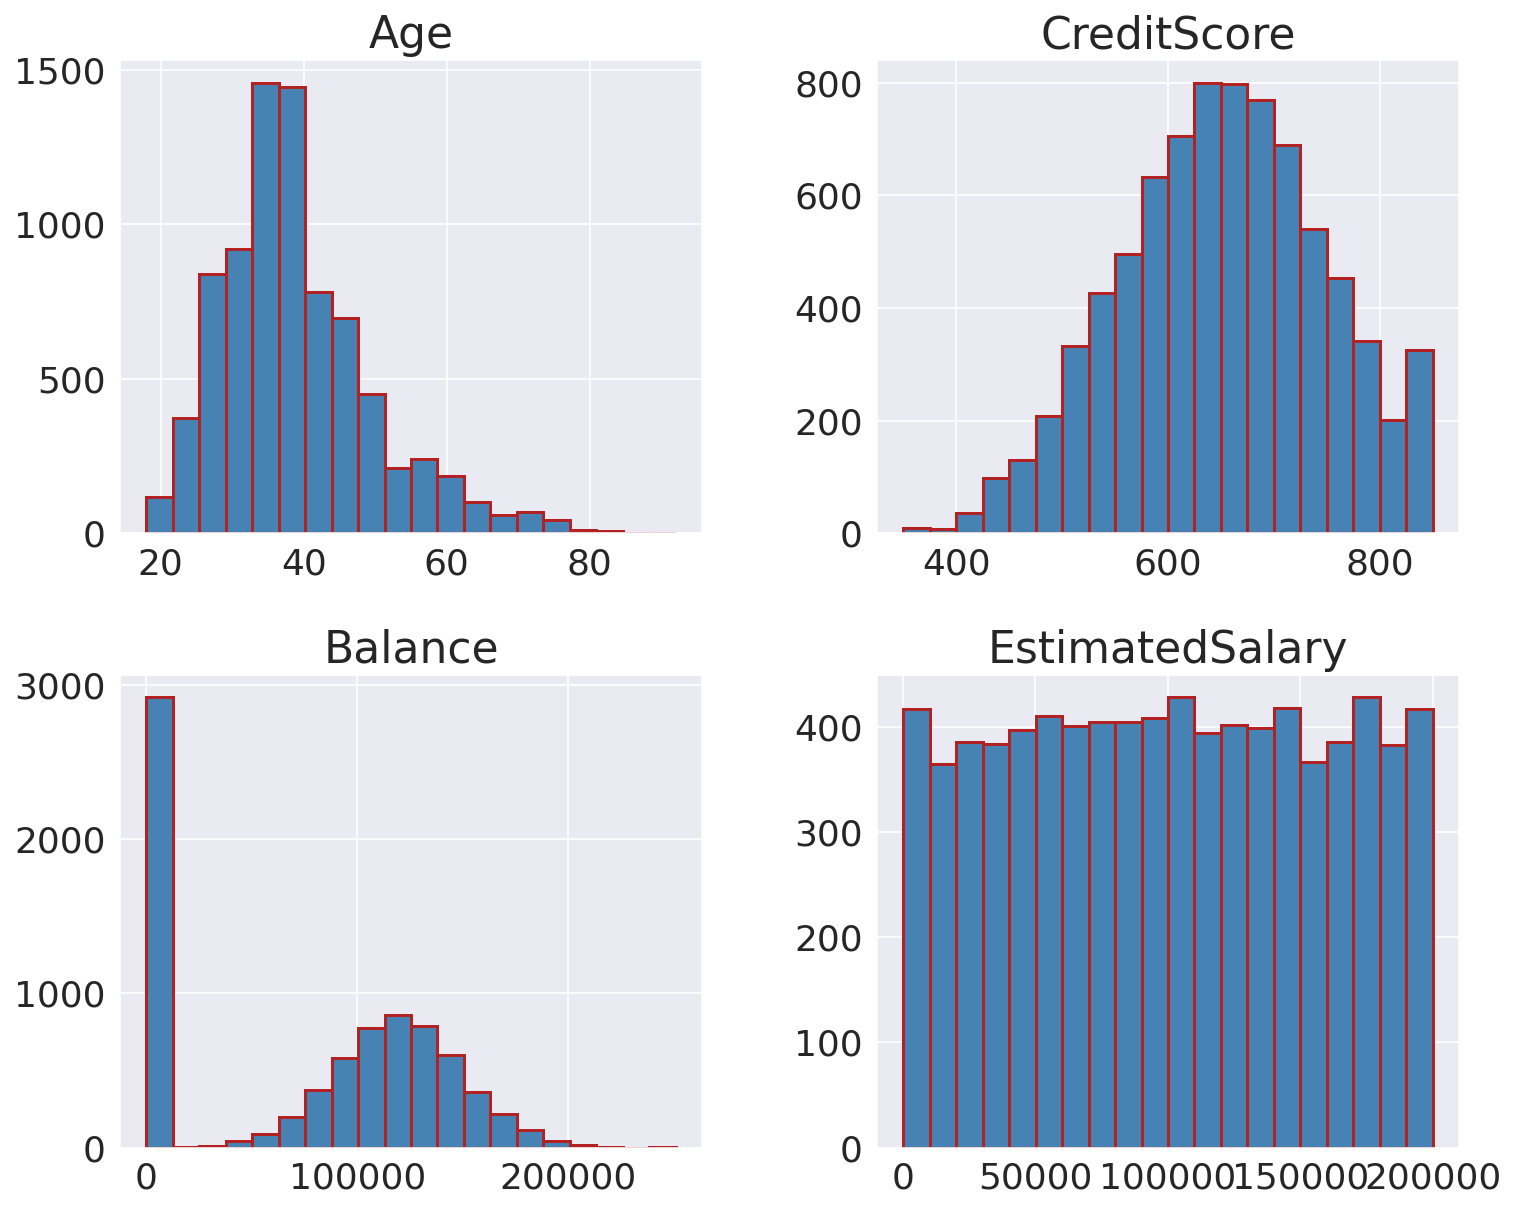
CorrelationsWe will compute the standard correlation coefficient between every pair of (continuous) features. Output: 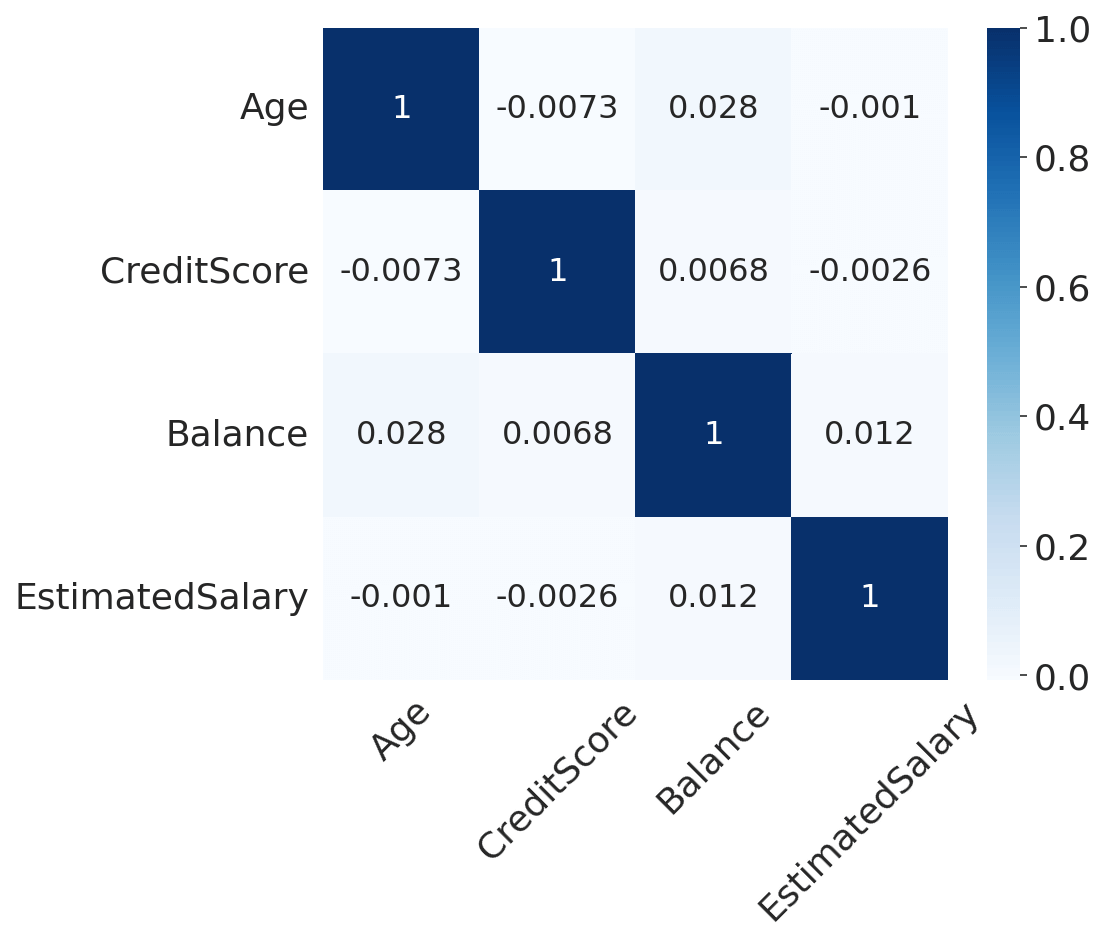
There is no significant intercorrelation between our features, so we do not have to worry about multicollinearity. AgeOutput: 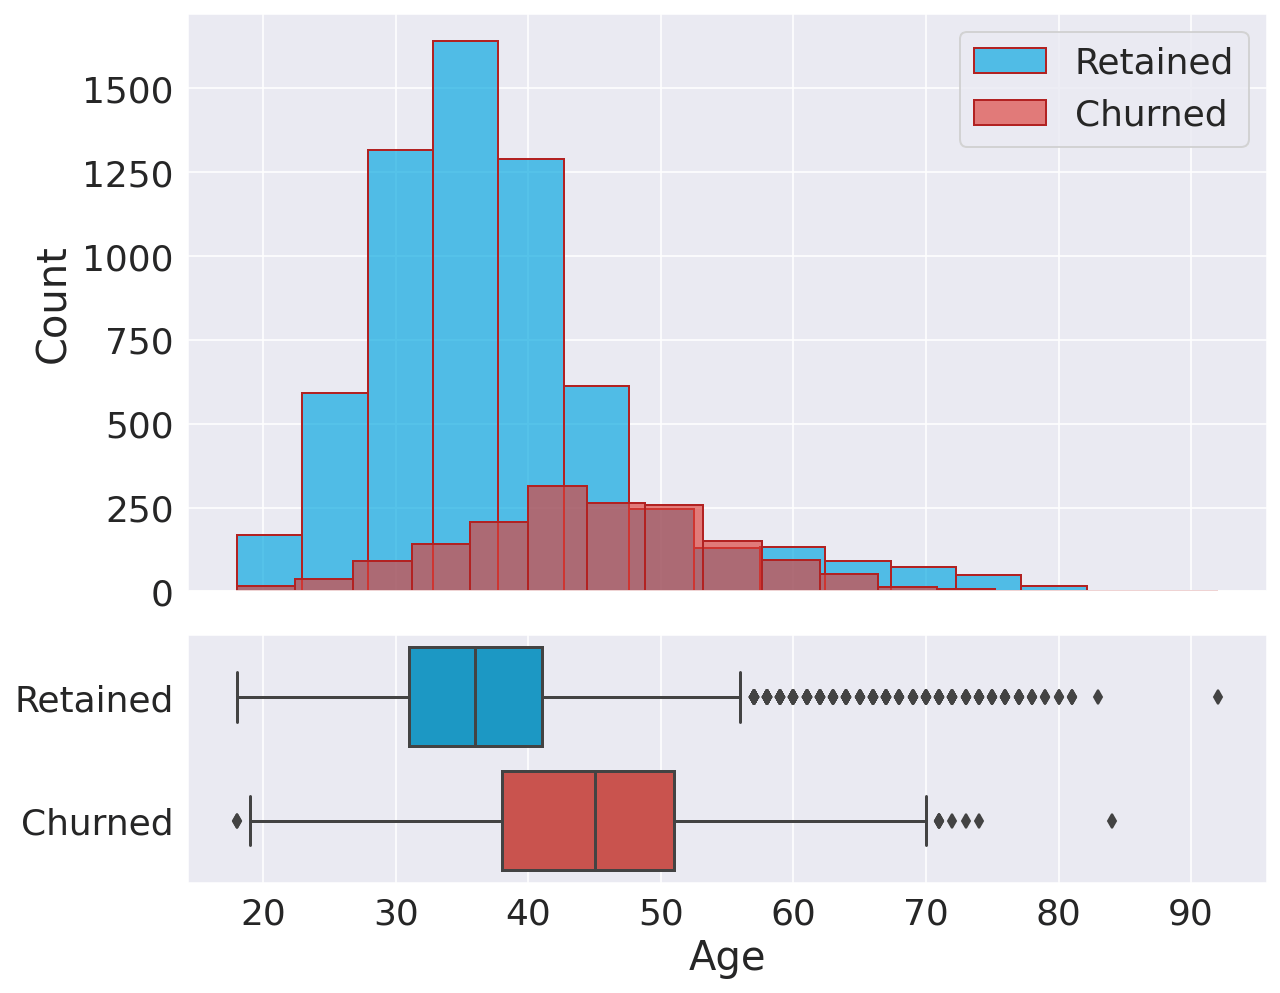
Interestingly, there is a clear difference between age groups since older customers are more likely to churn. This observation could potentially indicate that preferences change with age, and the bank hasn't adapted its strategy to meet the requirements of older customers. Credit ScoreOutput: 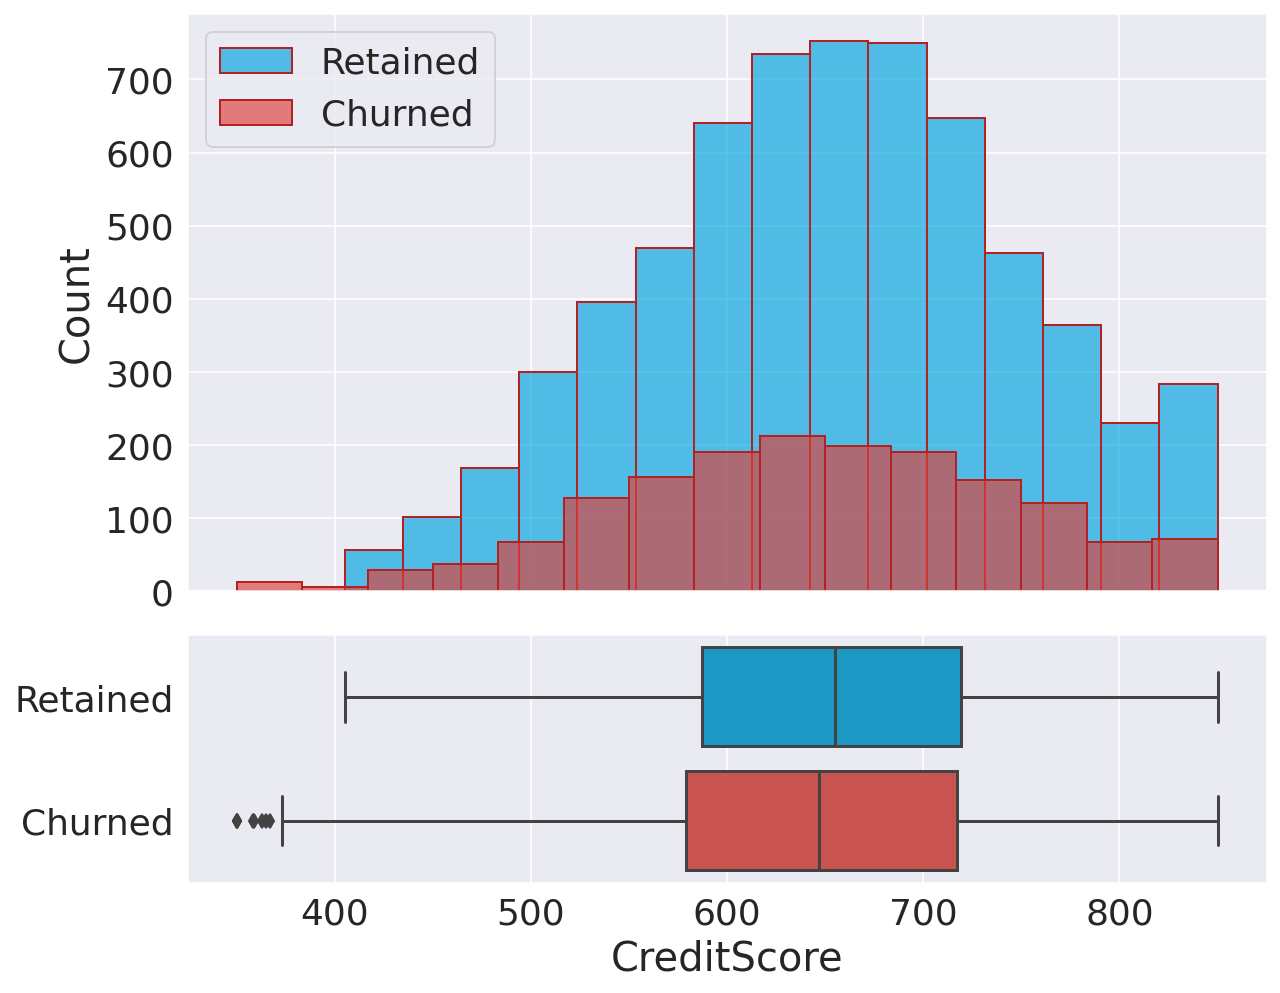
There is no significant difference between retained and churned customers in terms of their credit scores. BalanceOutput: 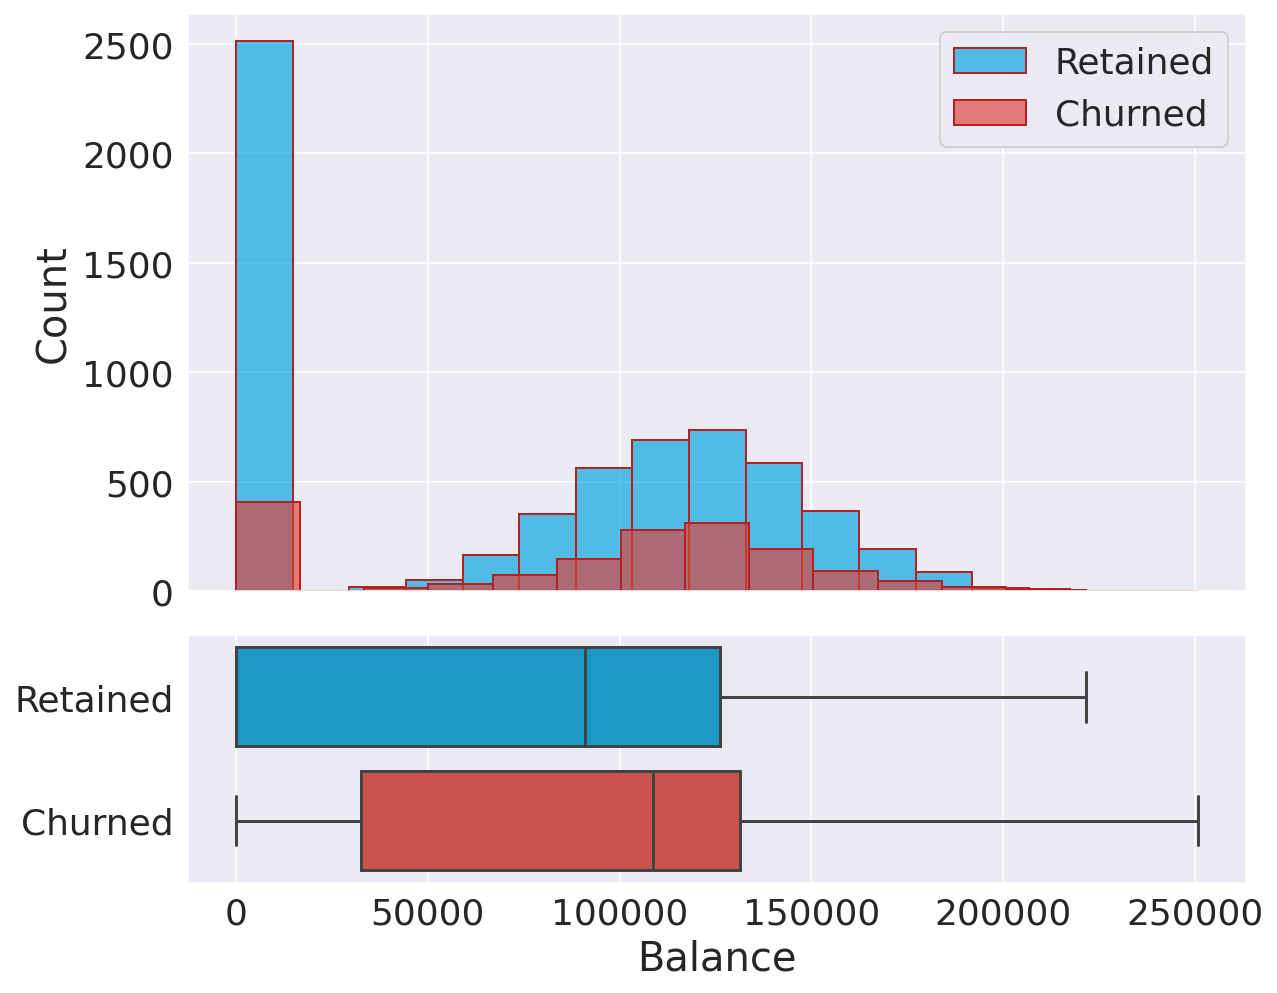
The two distributions are quite similar. There is a big percentage of non-churned customers with a low account balance. Estimated SalaryOutput: Both churned and retained customers display a similar uniform distribution in their salaries. Consequently, we can conclude that salary doesn't have a significant effect on the likelihood to churn. Categorical VariablesOutput: 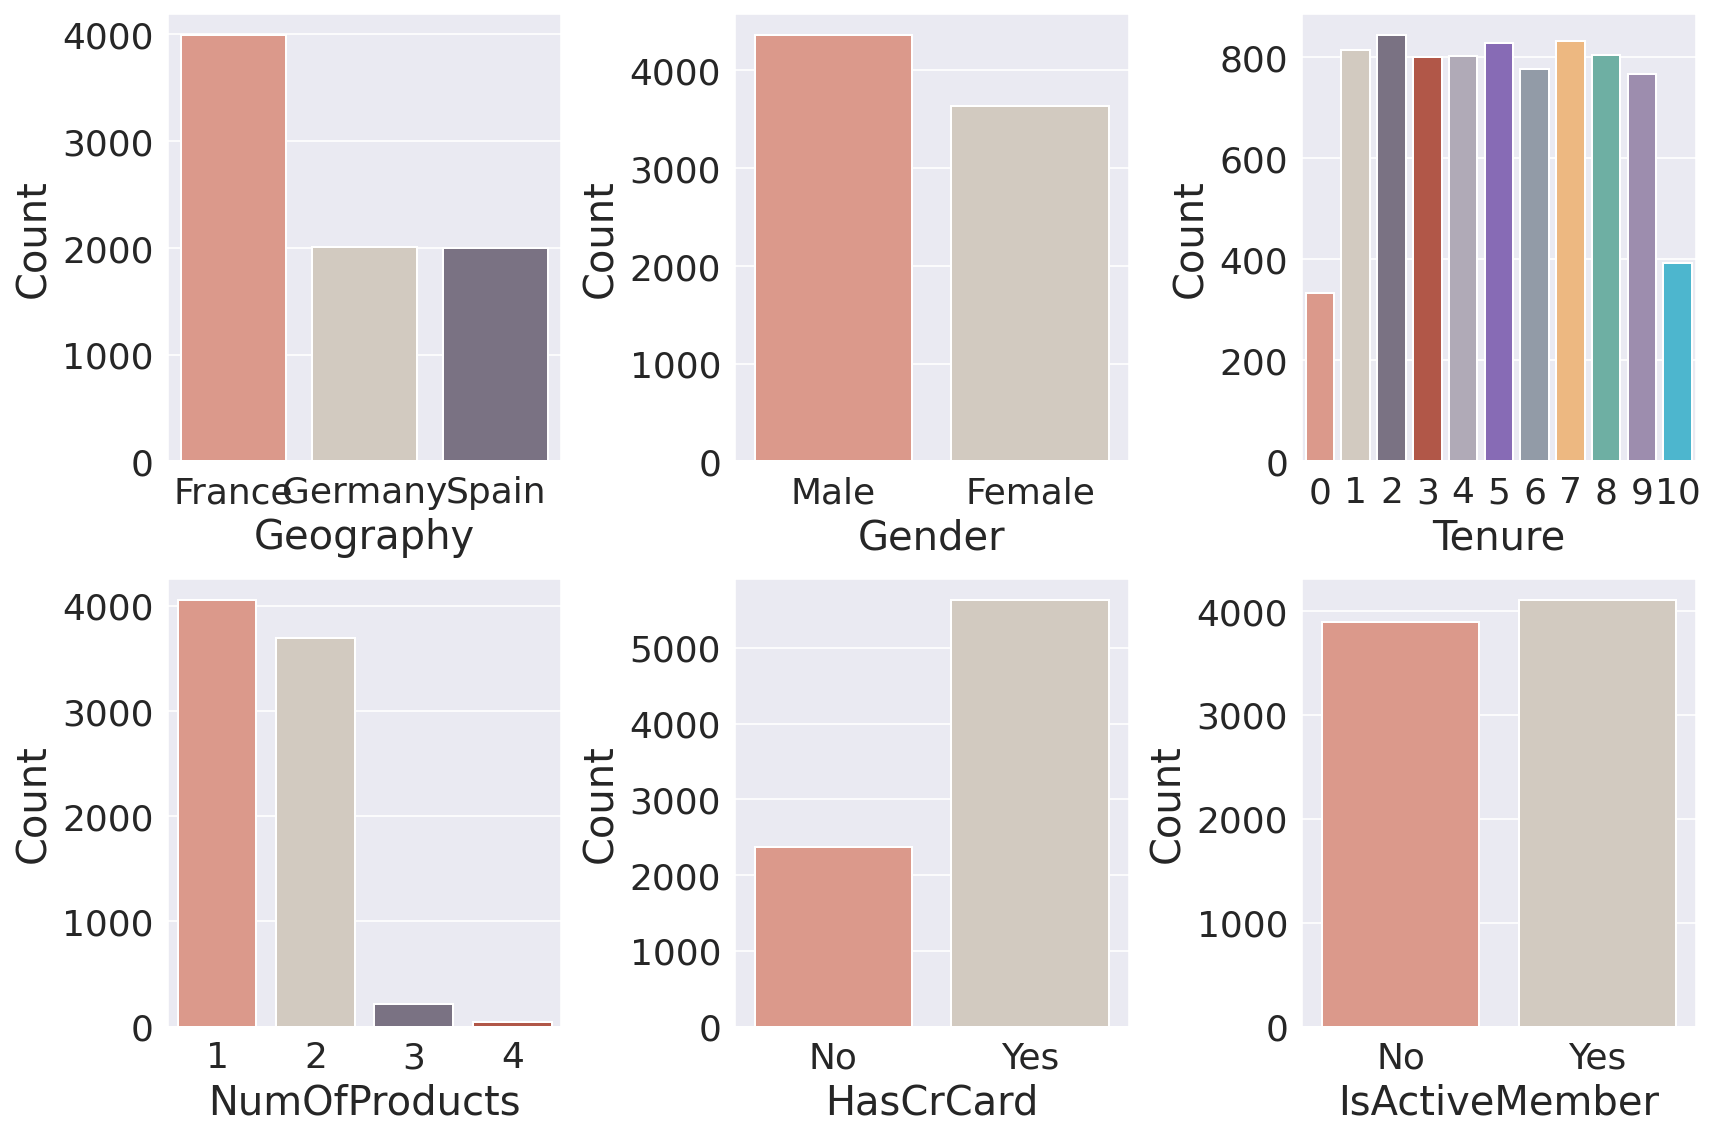
Important points:
GeographyOutput: 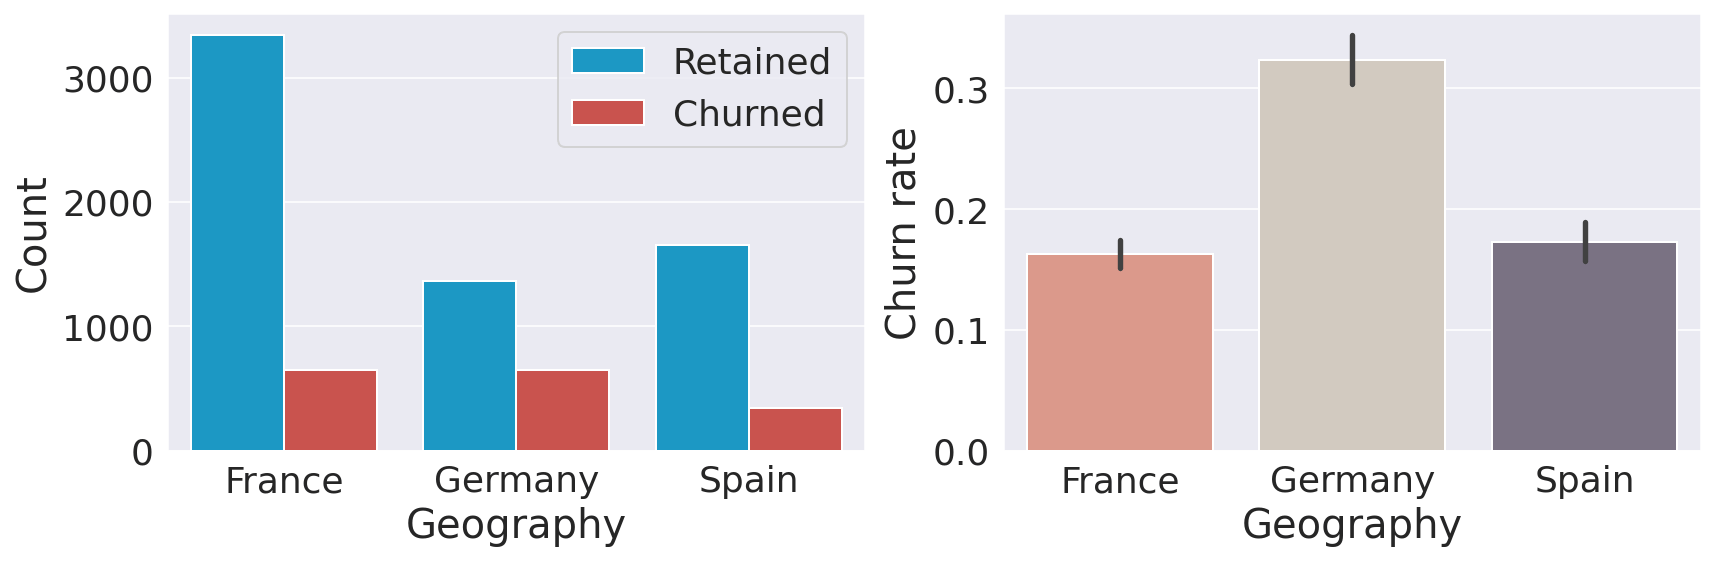
Customers in Germany are more likely to churn than customers in the other two countries (the churn rate is almost double compared to Spain and France). Many reasons could explain this finding, such as higher competition or different preferences for German customers. GenderOutput: 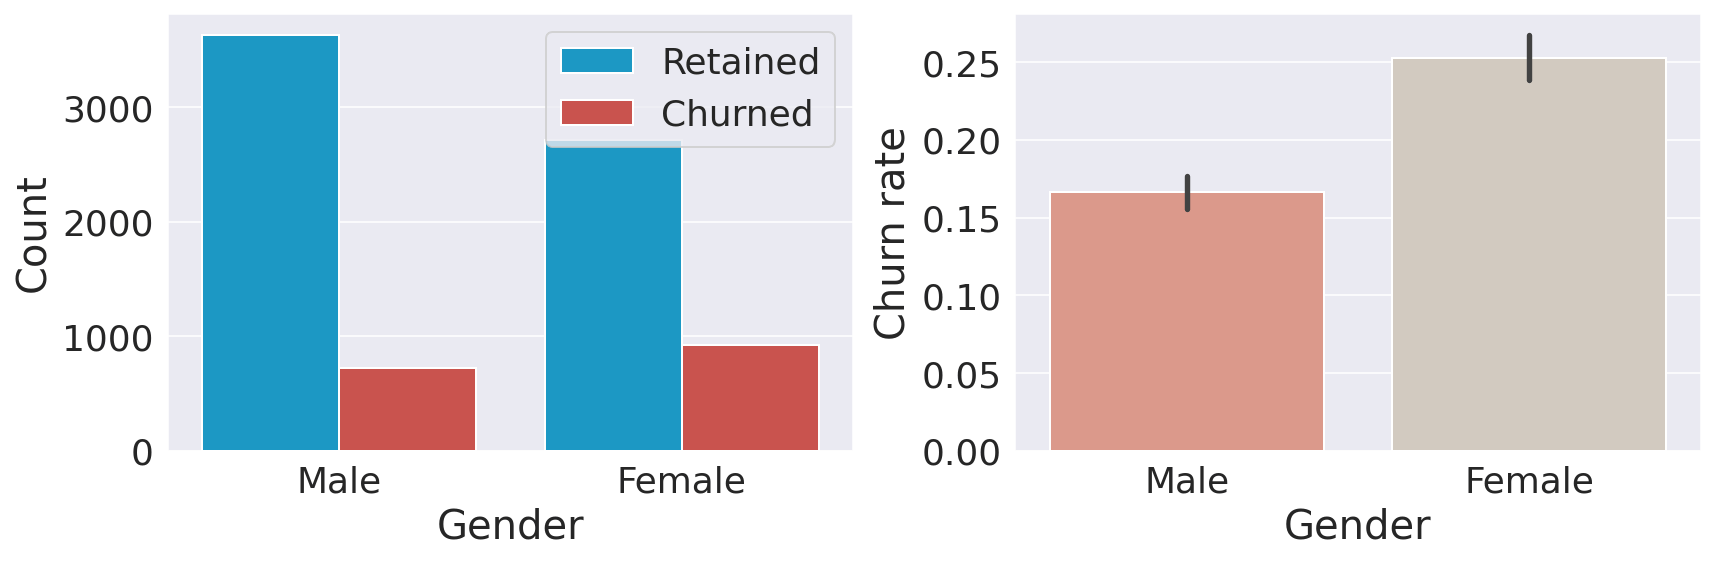
Female customers are more likely to churn. TenureOutput: 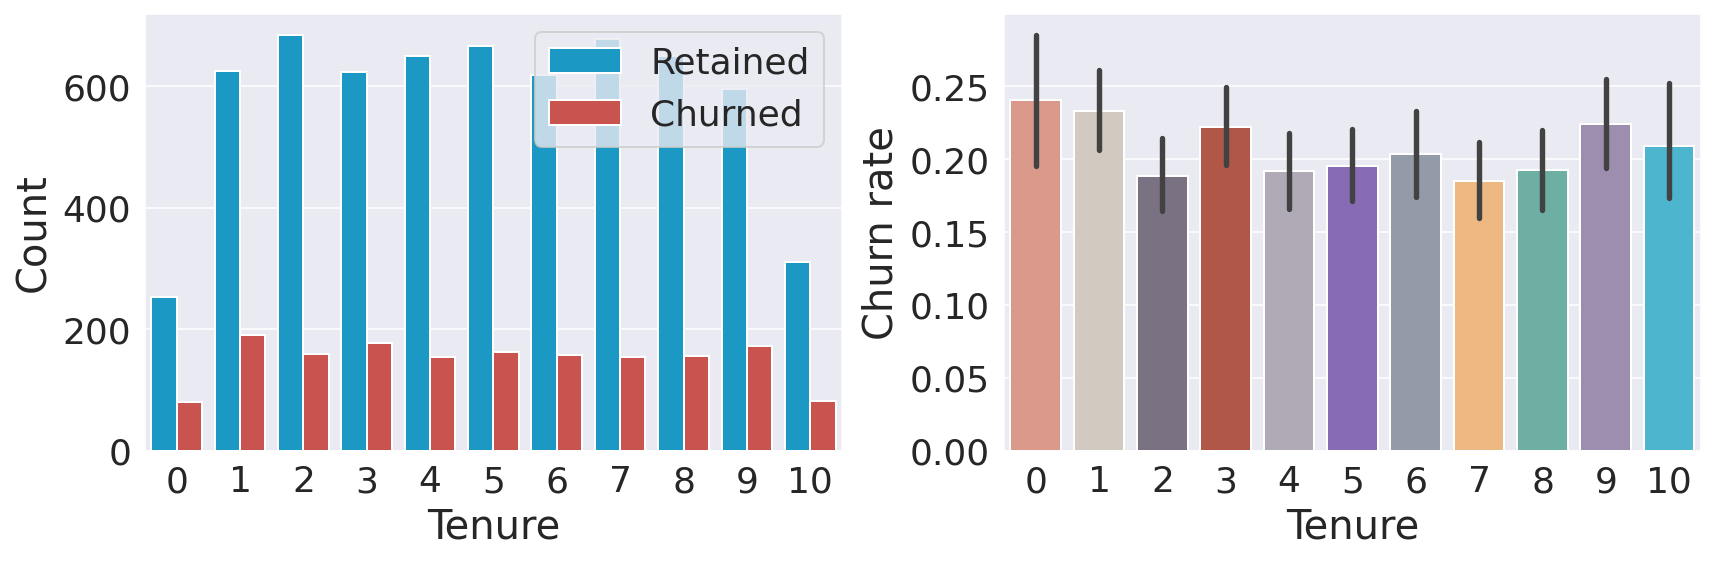
The number of years (tenure) does not seem to affect the churn rate. Number of ProductsOutput: 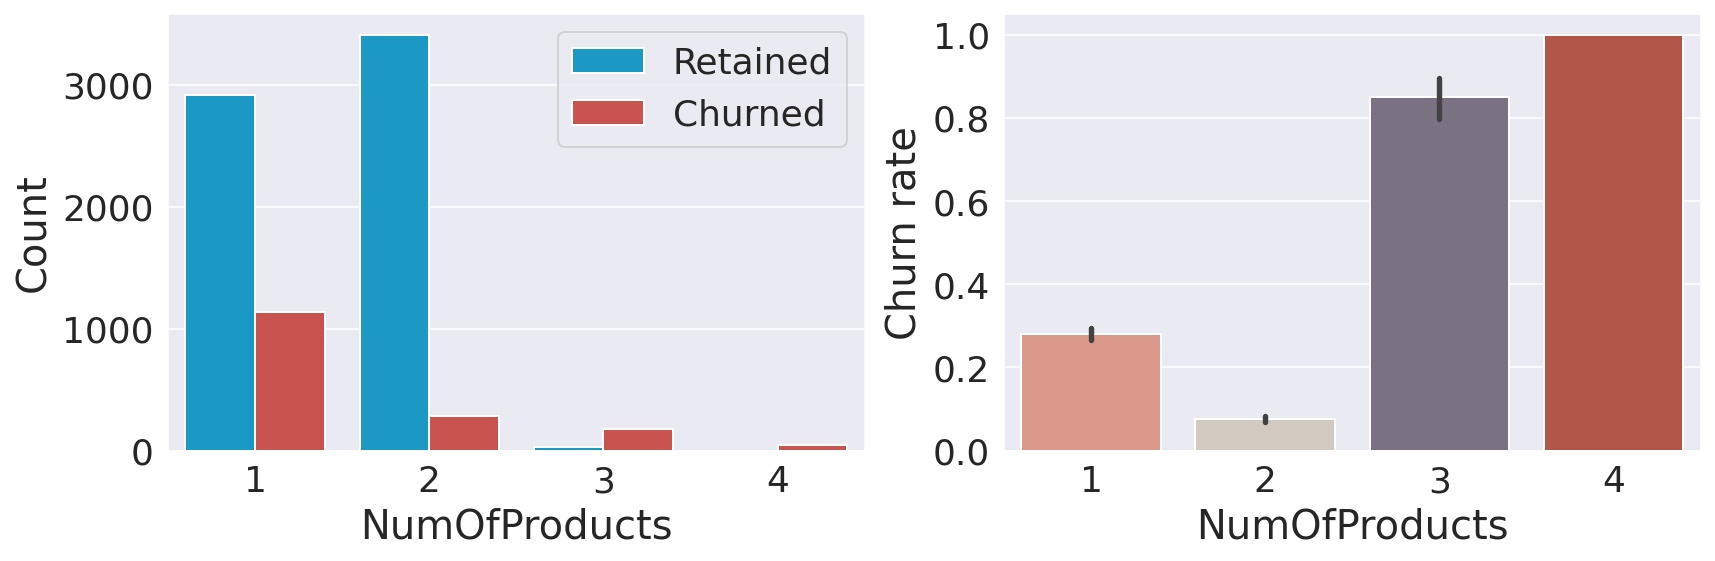
Interestingly, having 3 or 4 products significantly increases the likelihood of churn. I am not sure how to interpret this result. It could potentially mean that the bank cannot properly support customers with more products which in turn increases customer dissatisfaction. Card HoldersOutput: 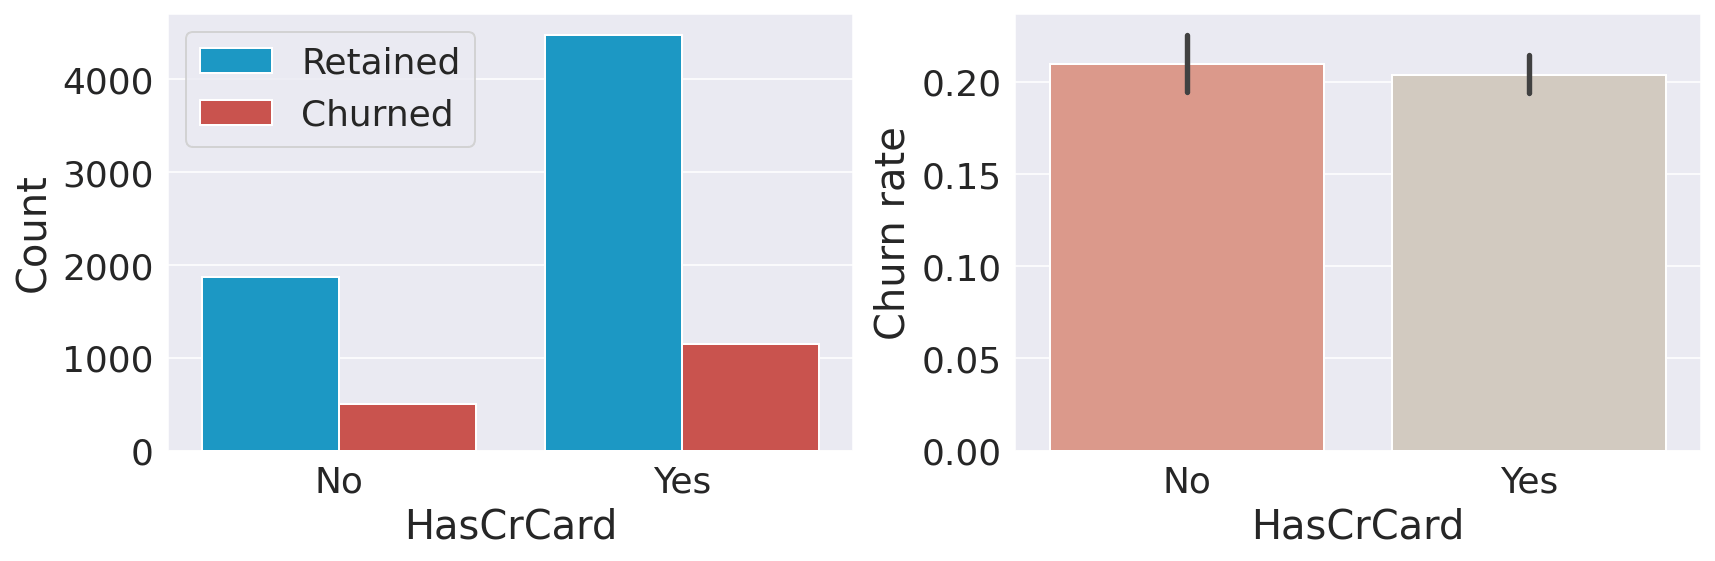
Having a credit card does not seem to affect the churn rate. Active MembersOutput: 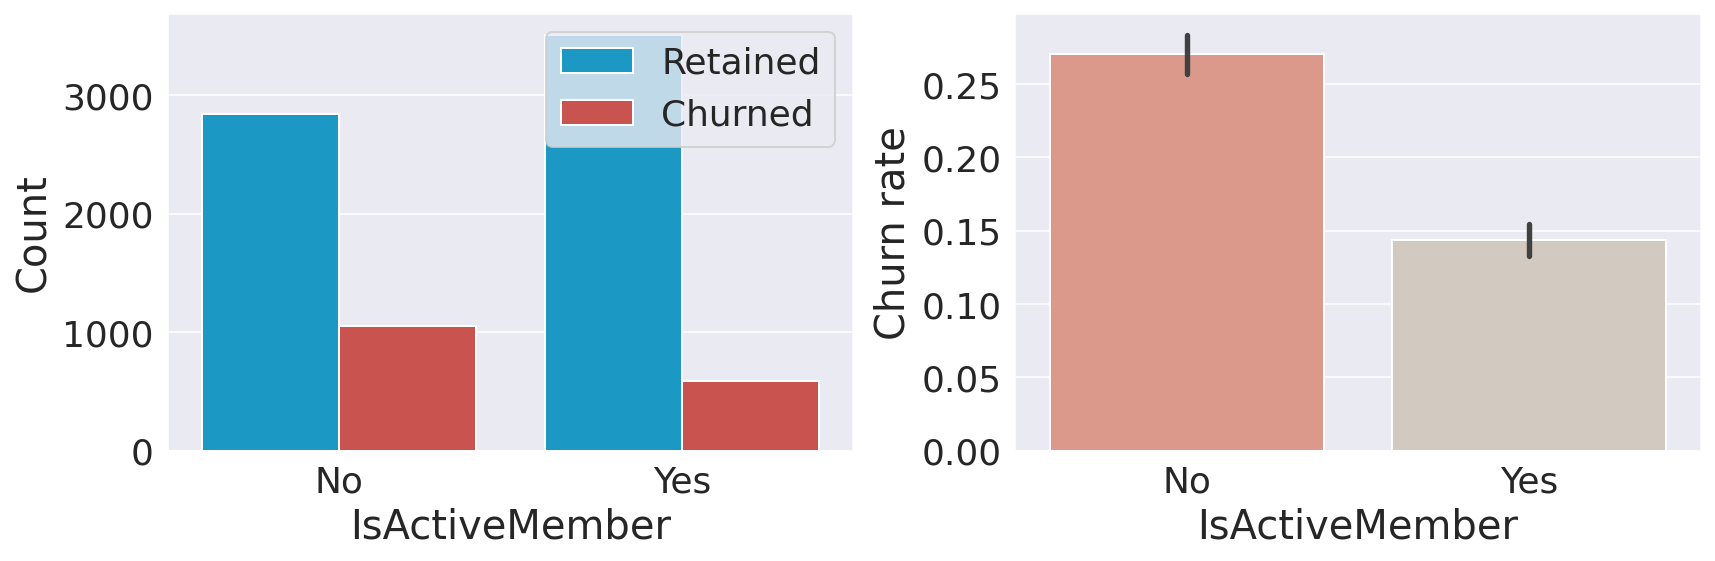
It's not a surprise that inactive customers are more likely to churn. A significant portion of the clientele is inactive; therefore, the bank will benefit from changing its policy so that more customers become active. Data ProcessingData preprocessing is the process of converting raw data into a well-readable format that is suitable for building and training Machine Learning models. Feature SelectionEDA revealed several more features that can be dropped as they do not provide any value in predicting our target variable:
Output: 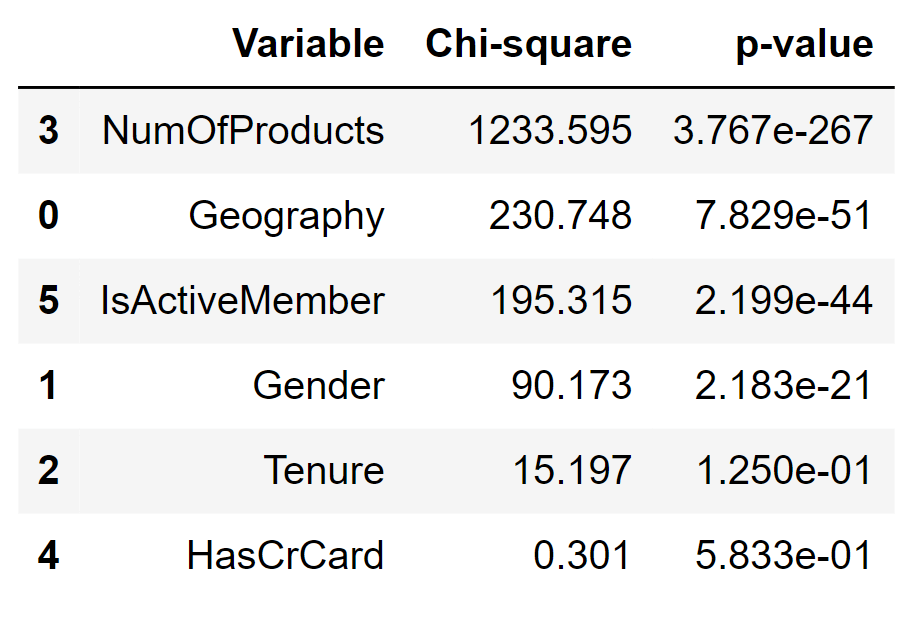
'Tenure' and 'HasCrCard' have a small chi-square and a p-value greater than 0.05 (the standard cut-off value), confirming our initial hypothesis that these two features do not convey any useful information. Encoding Categorical FeaturesMachine learning algorithms usually require that all input (and output) features are numeric. Consequently, categorical features need to be converted (encoded) to numbers before building models. Our dataset contains two features that require encoding:
ScalingFeature scaling is a technique used to normalize the range of features in a dataset. Addressing Class BalanceAs we have seen previously, there is an imbalance in the classes to be predicted, with one class (0 - retained) much more prevalent than the other (1 - churned). Output: 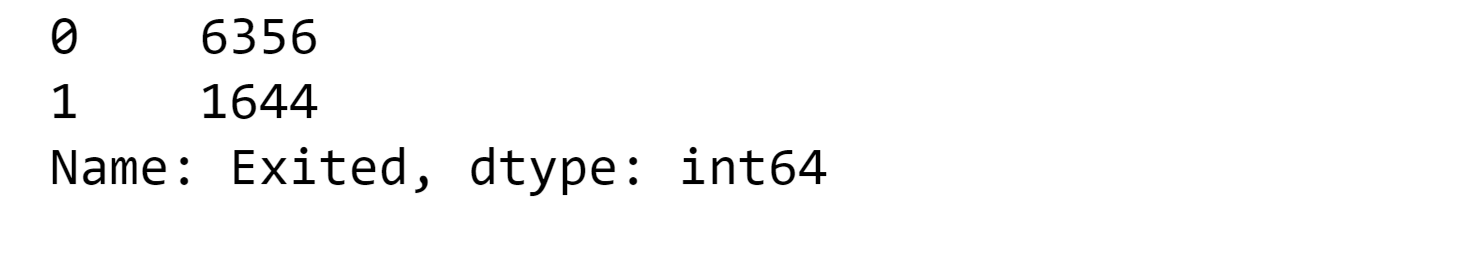
Class imbalance is usually a problem and occurs in many real-world tasks. Classification using imbalanced data is biased in favor of the majority class, meaning that machine learning algorithms will likely result in models that do little more than predict the most common class. Additionally, common metrics can be misleading when handling class-imbalanced data (e.g., if a dataset contains 99.9% 0s and 0.01% 1s, a classifier that always predicts 0 will have 99.9% accuracy). Output: 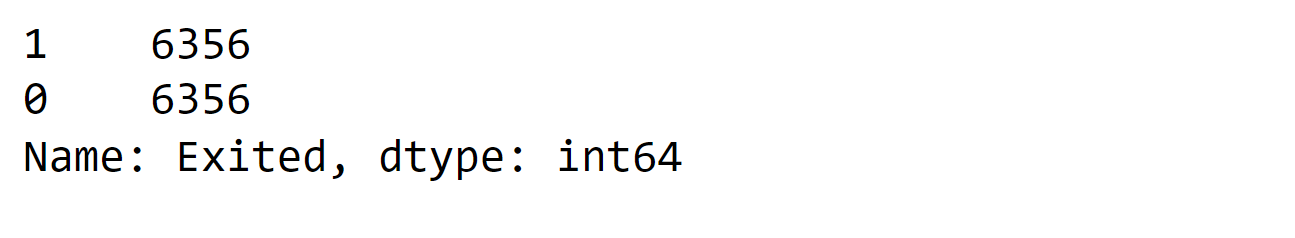
ModelingWe start this section by first creating two simple models to estimate the baseline performance on the training set. Output: 
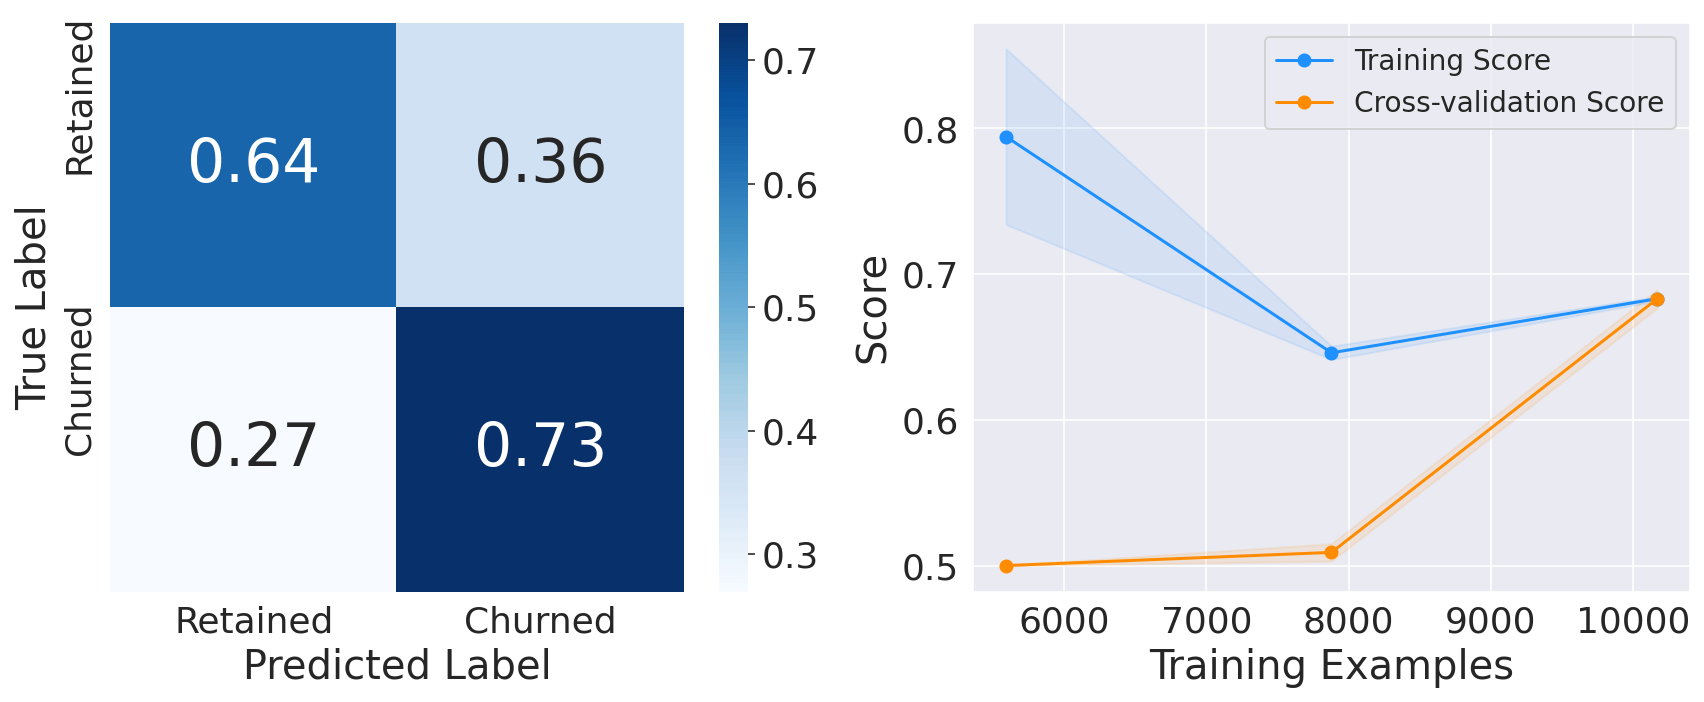
Note: We could have used more (powerful) classifiers such as Random Forests or/and XGBoost. However, We preferred to exclude them at this stage as their default parameters make them more susceptible to overfitting the training set and hence provide inaccurate baseline performance.1. Logistic RegressionOutput: 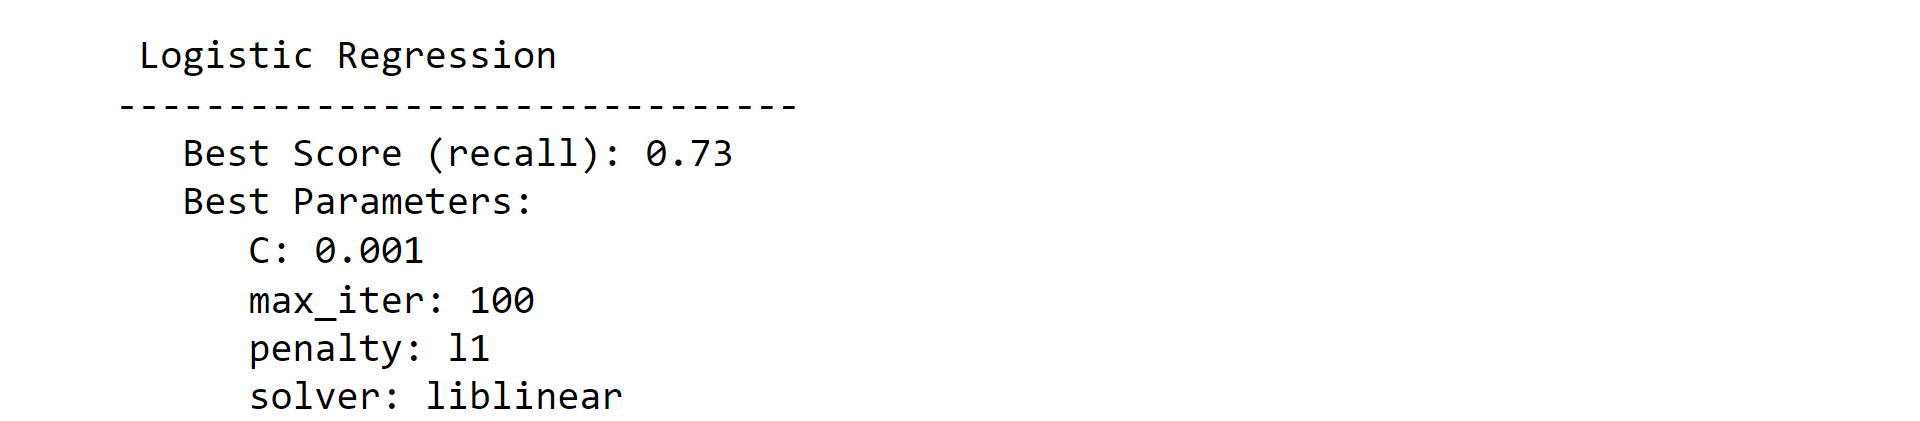
2. Support Vector ClassifierOutput: 
3. Random Forest ClassifierOutput: 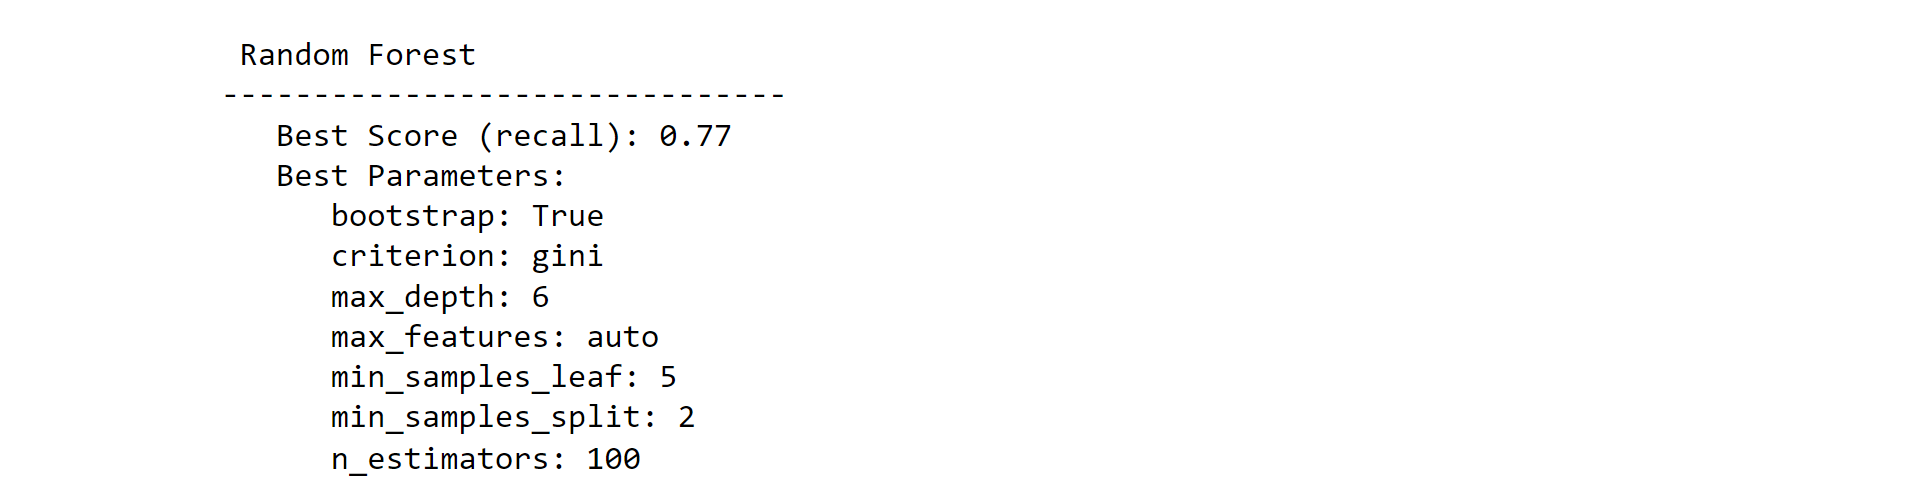

4. Gradient Boost ClassifierOutput: 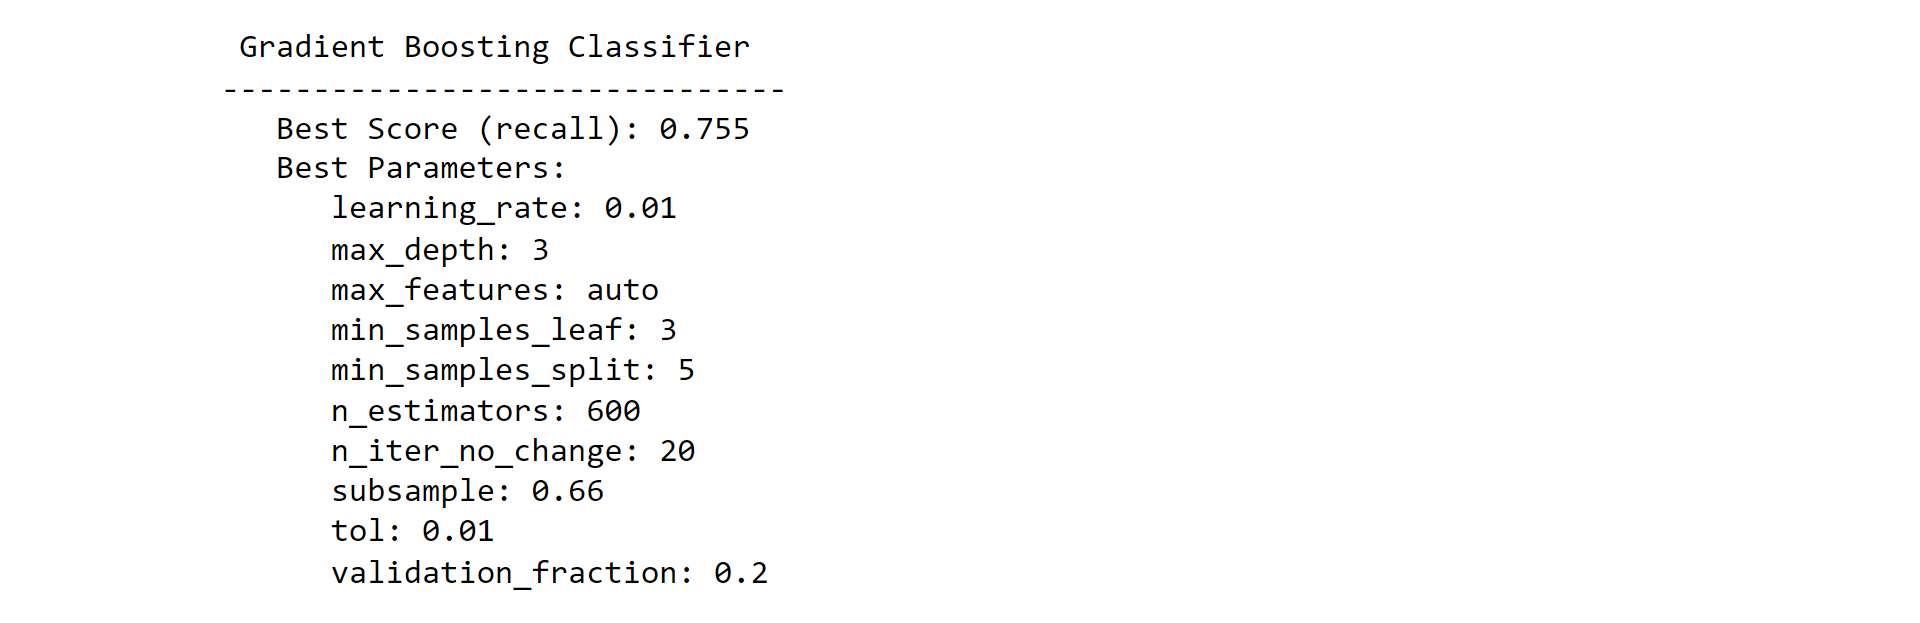
5. XGBoost ClassifierOutput: 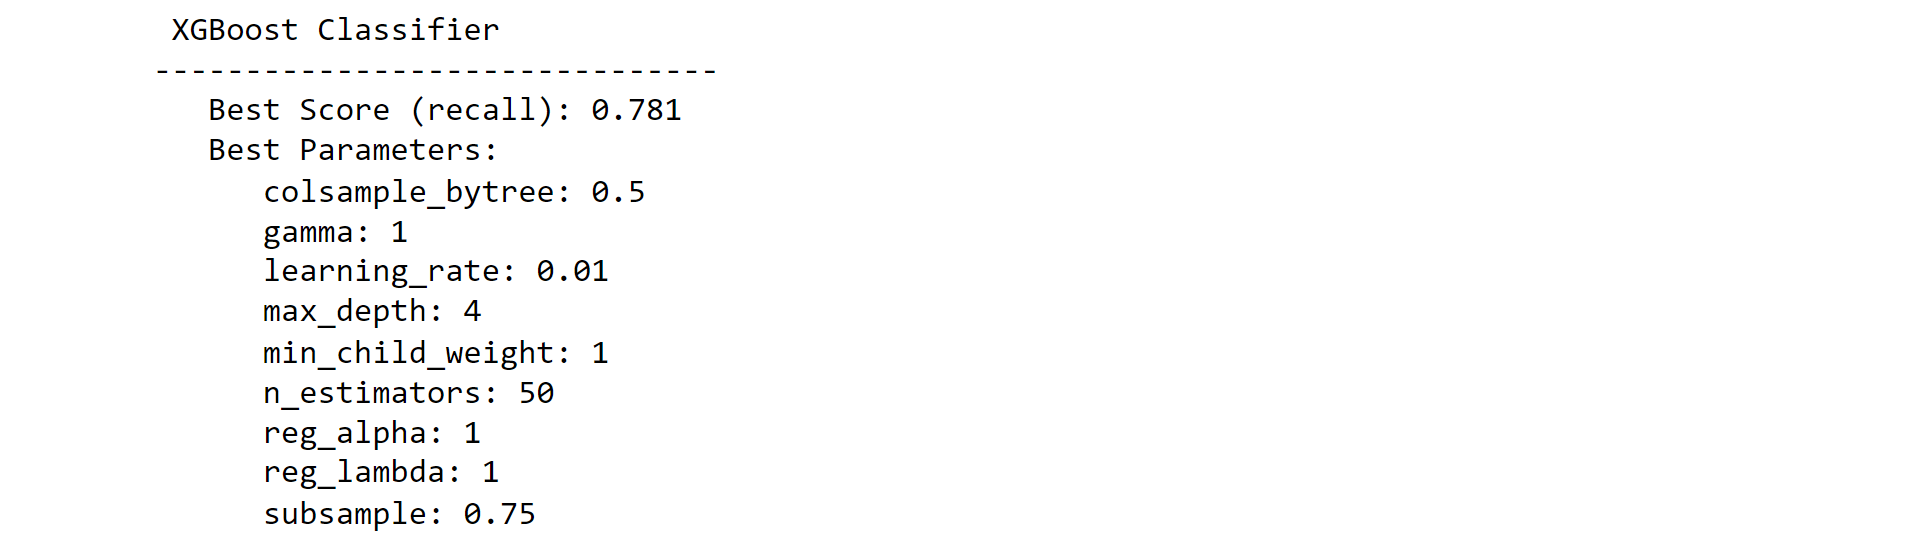
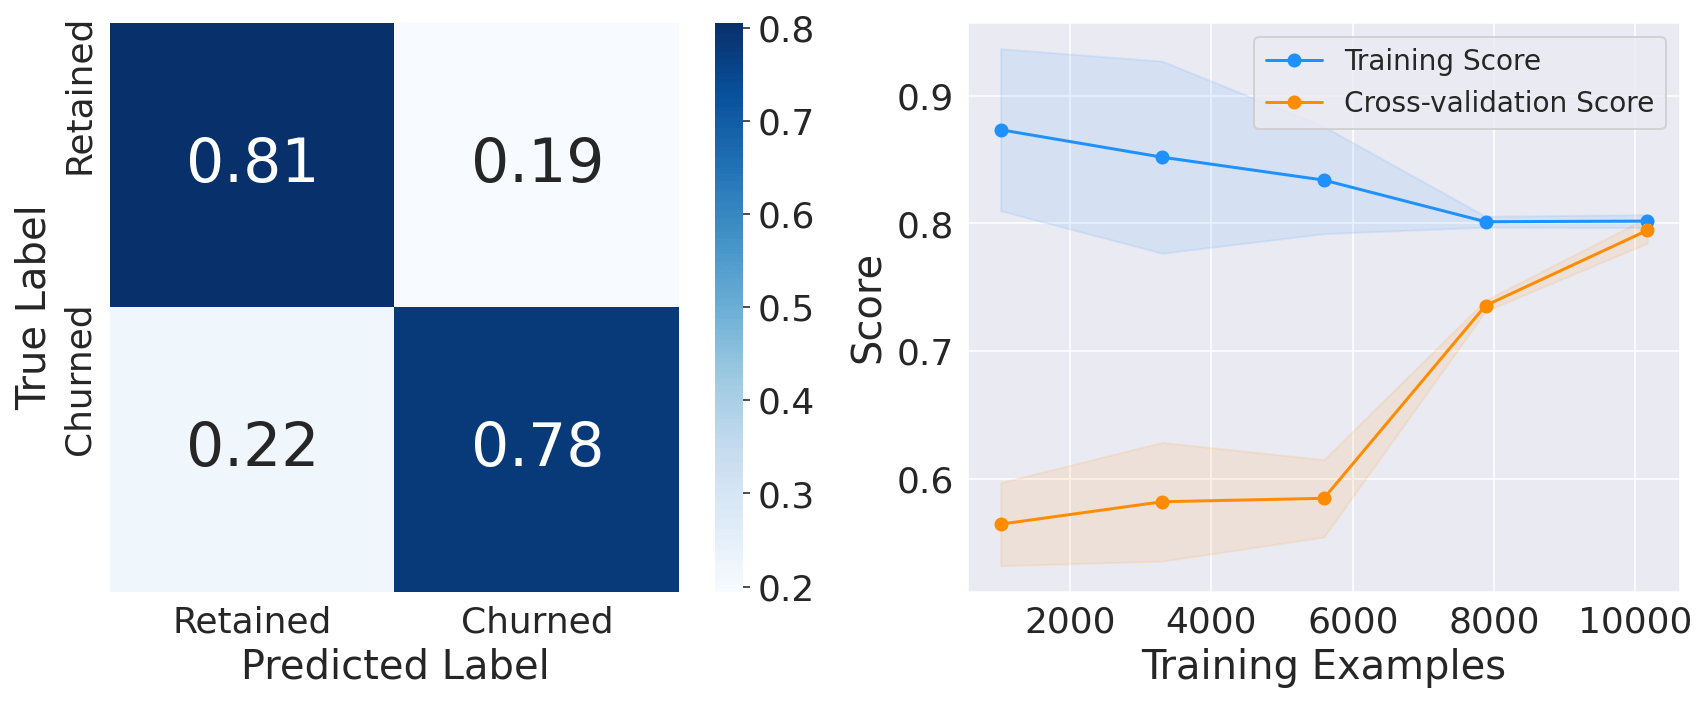
6. LGBM ClassifierOutput: 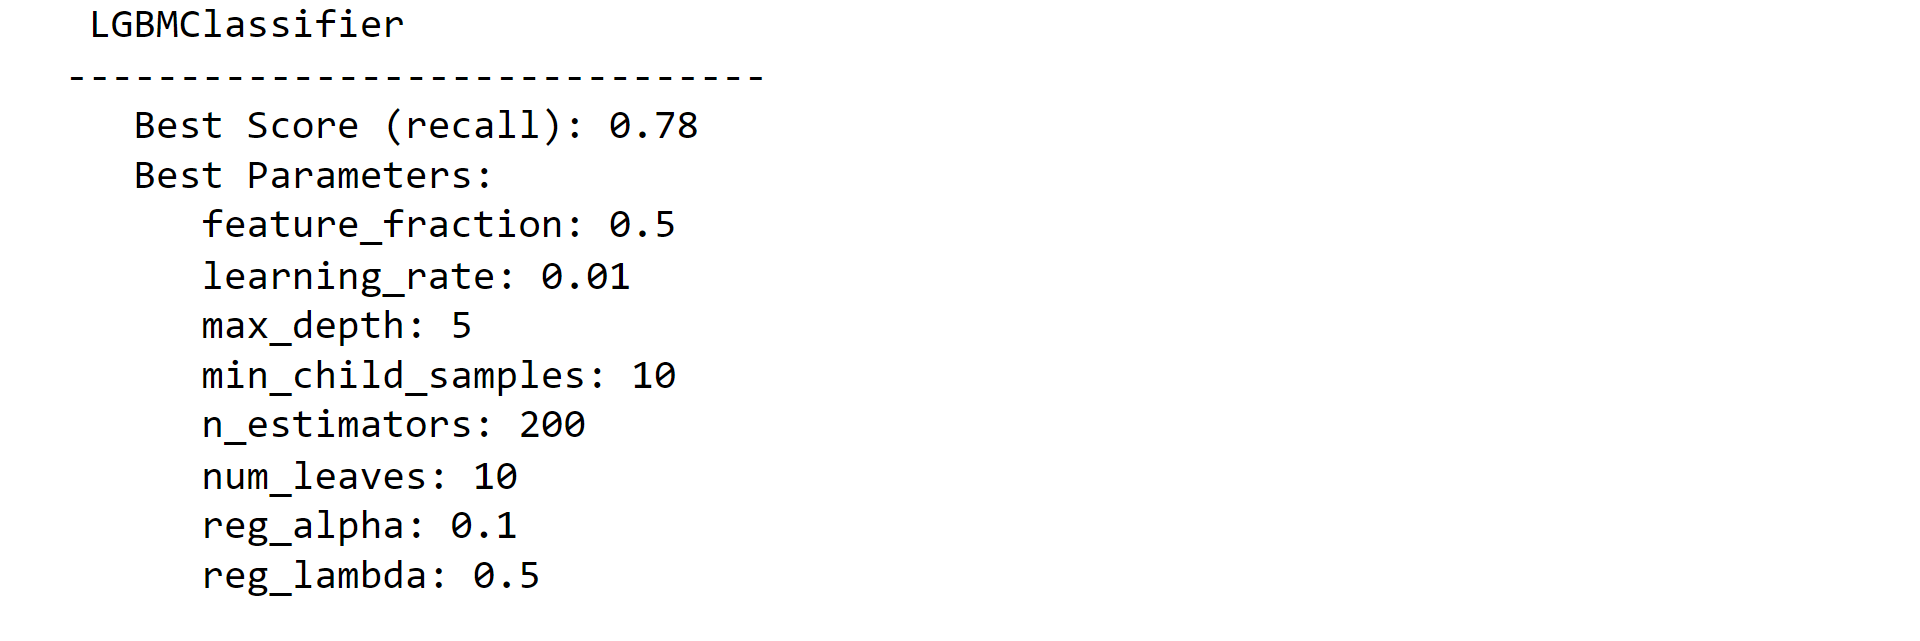
Ensemble learningWe can combine the predictions of all these classifiers to determine if we get better predictive performance compared to each individual constituent classifier. This practice is the main motivation behind Ensemble Learning. Output: 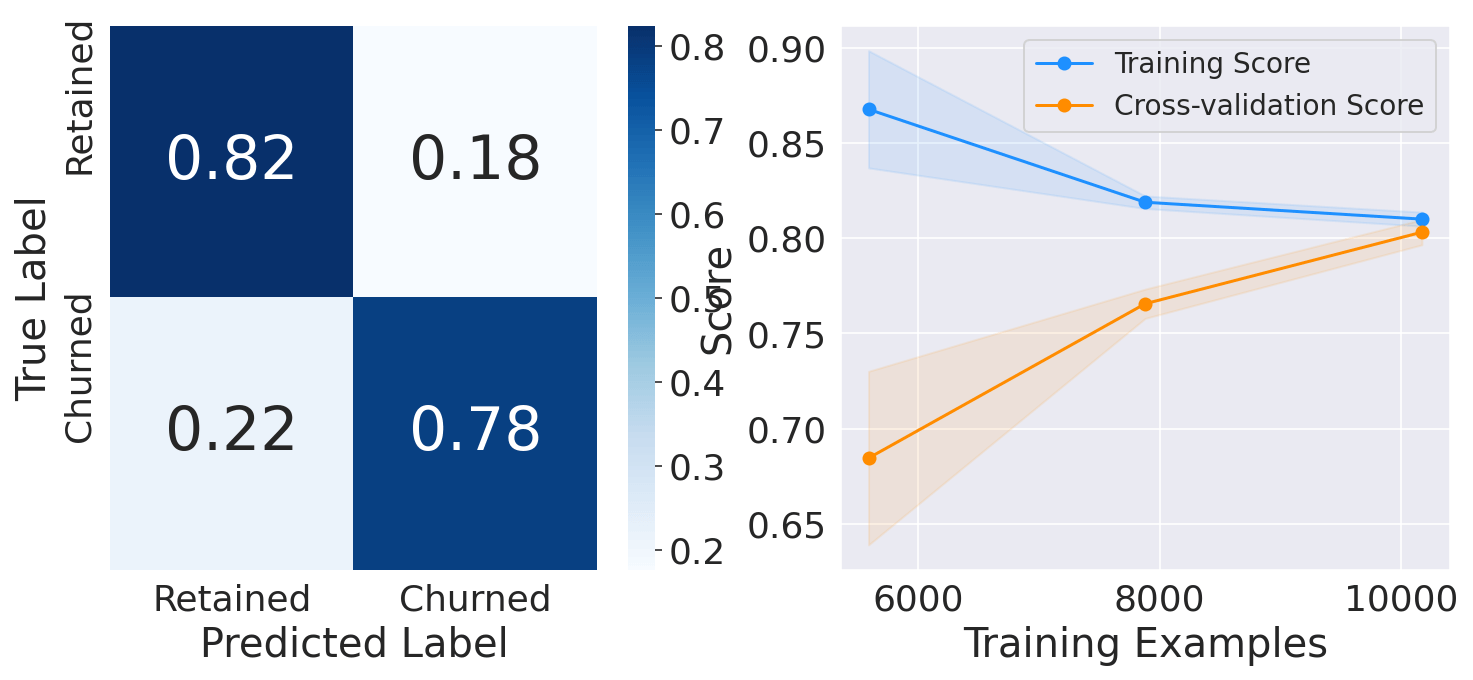
Feature ImportanceOutput: 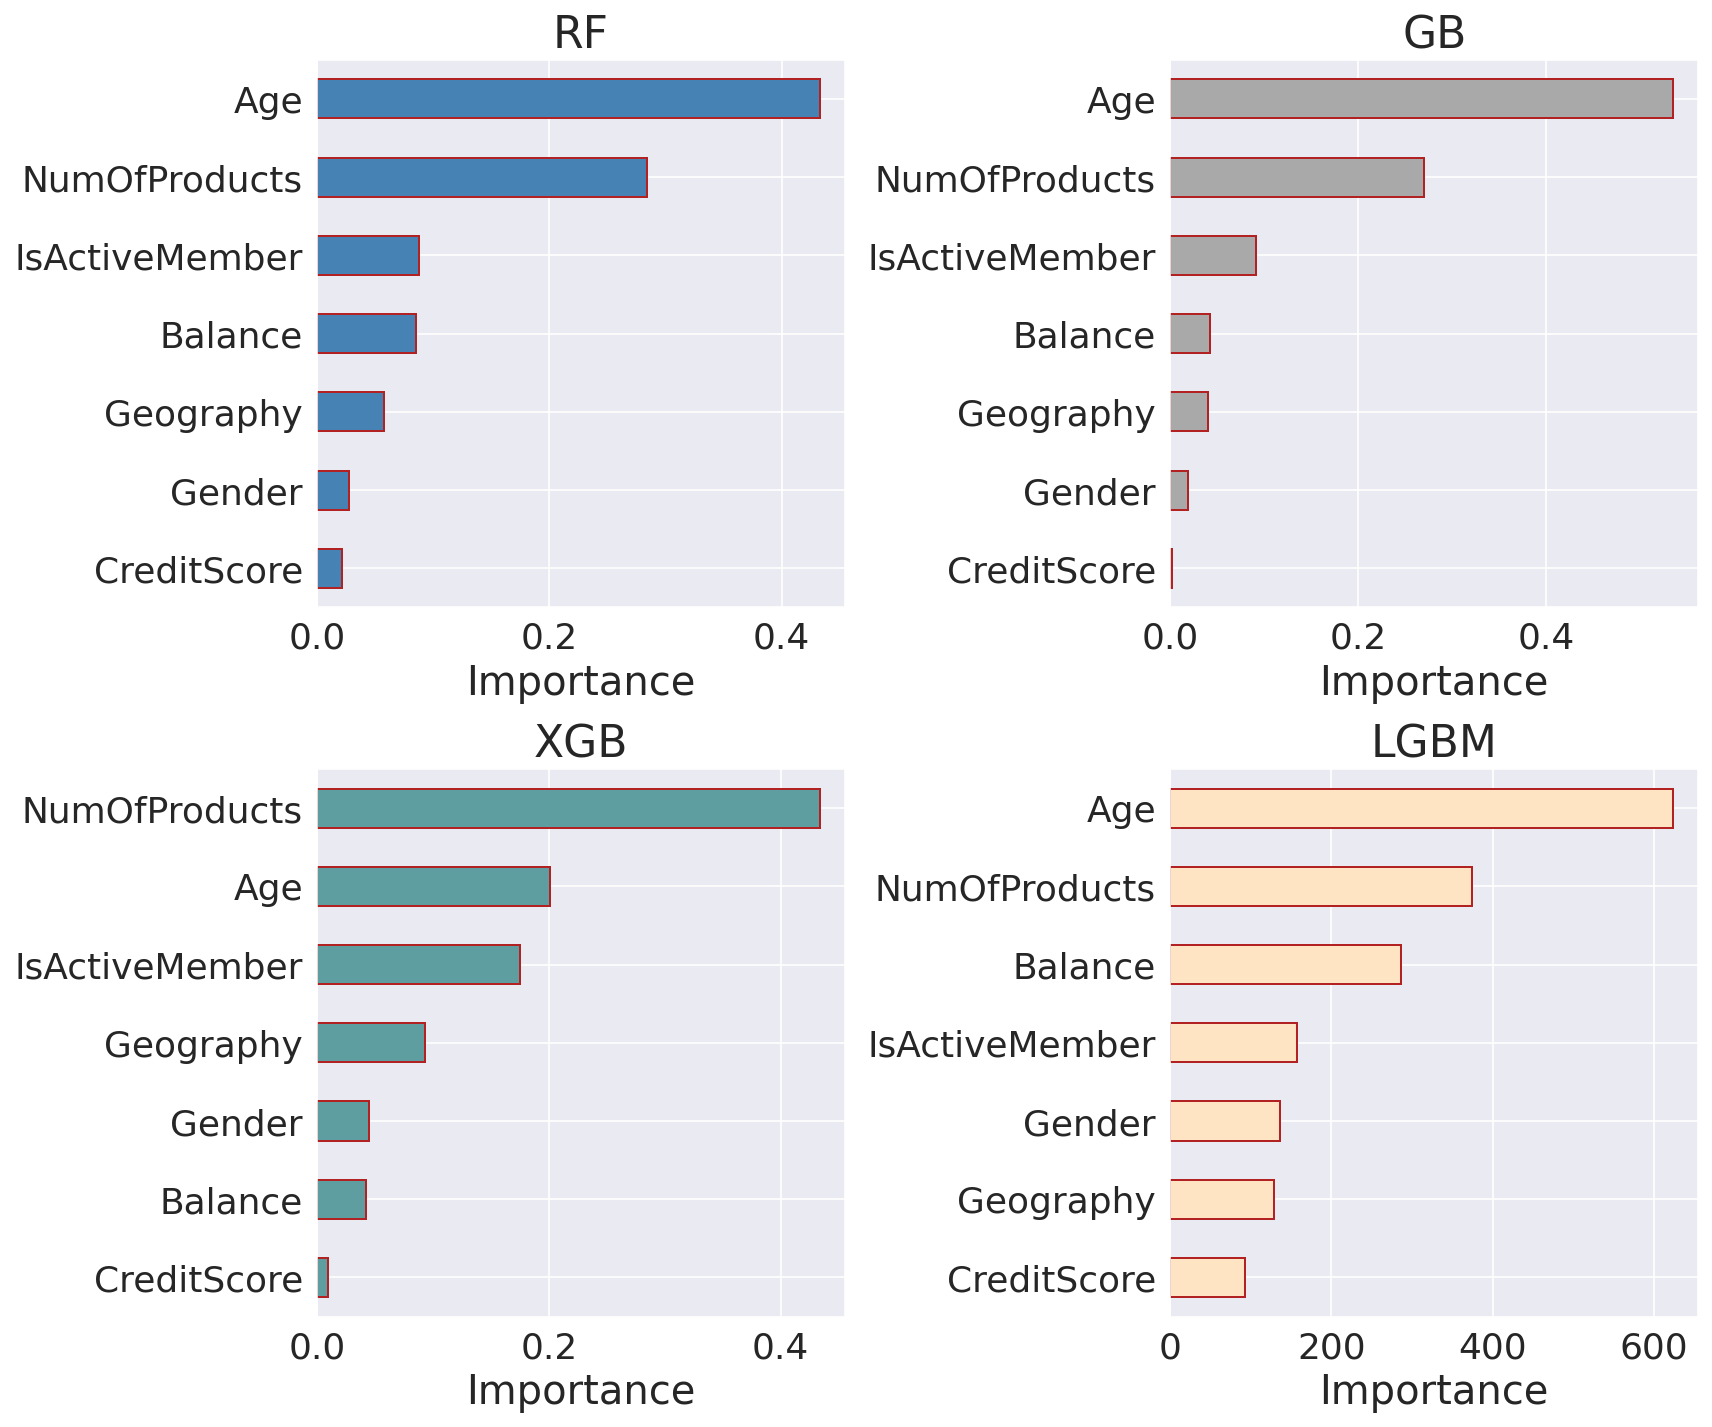
Age' and 'NumOfProducts' seem like the most useful features for all classifiers, followed by 'IsActiveMember' and 'Balance'. On the other hand, 'CreditScore' is the least important feature, with a small value close to zero for all estimators apart from LGBM. Performance ComparisonOutput: 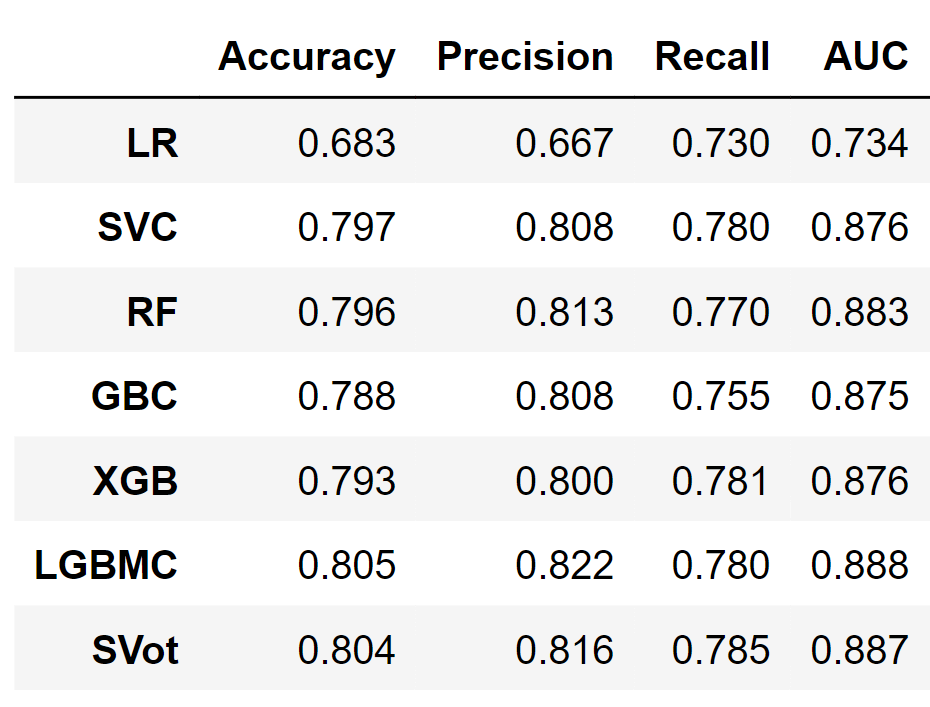
Output: 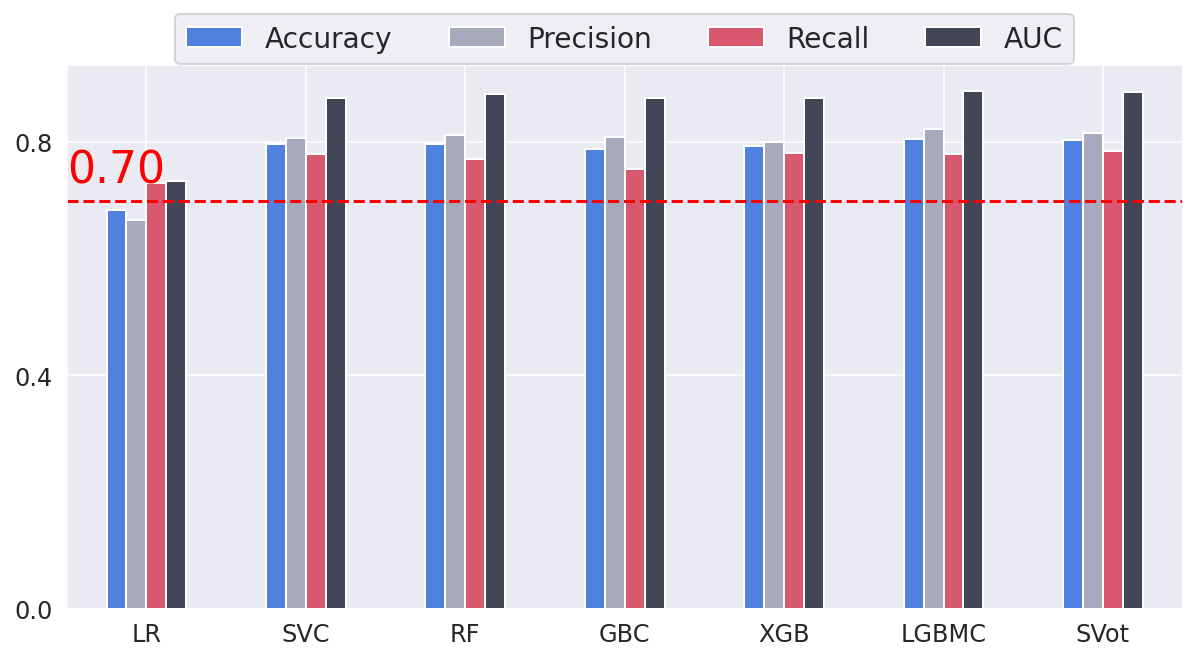
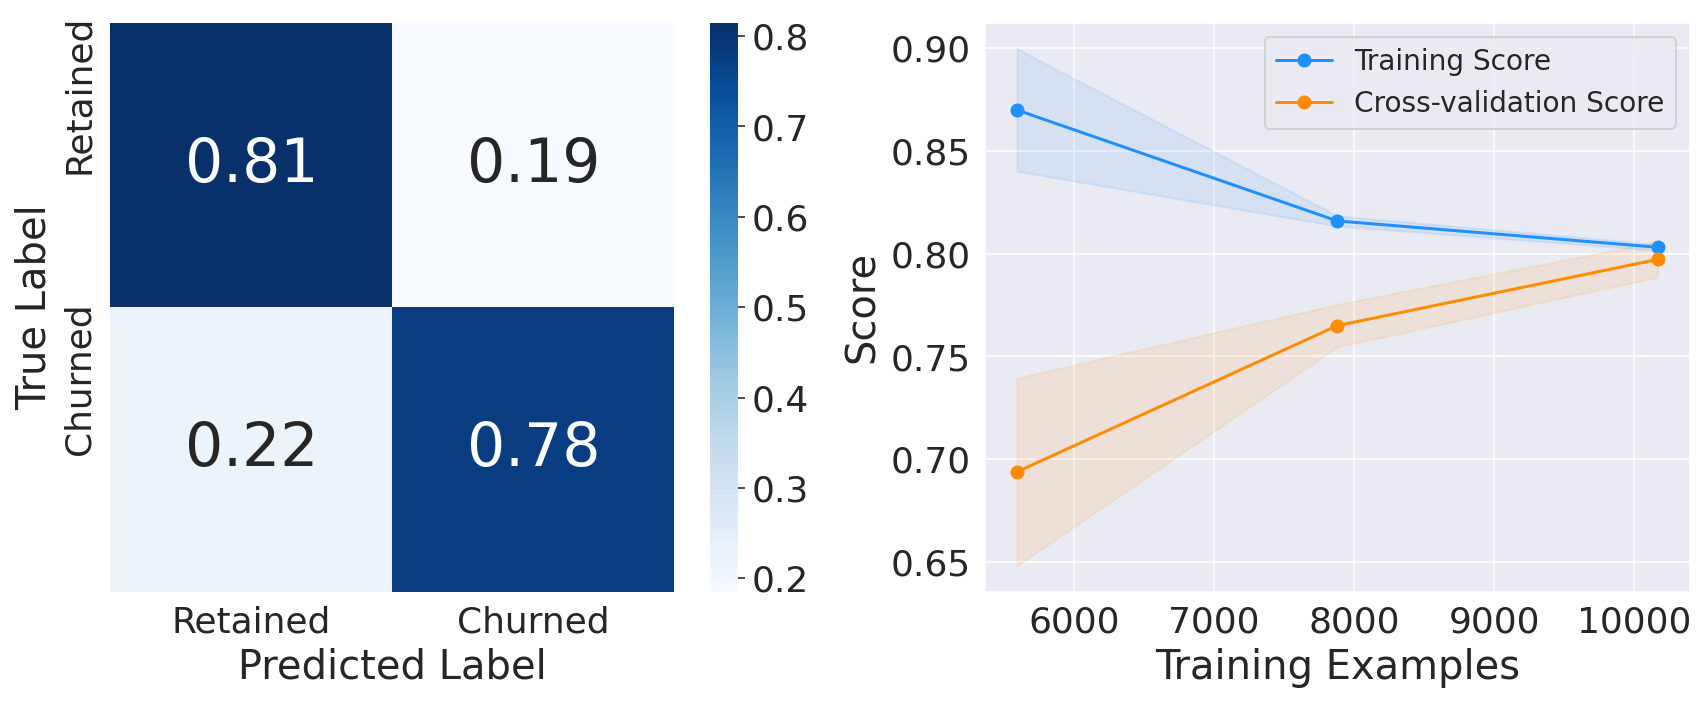
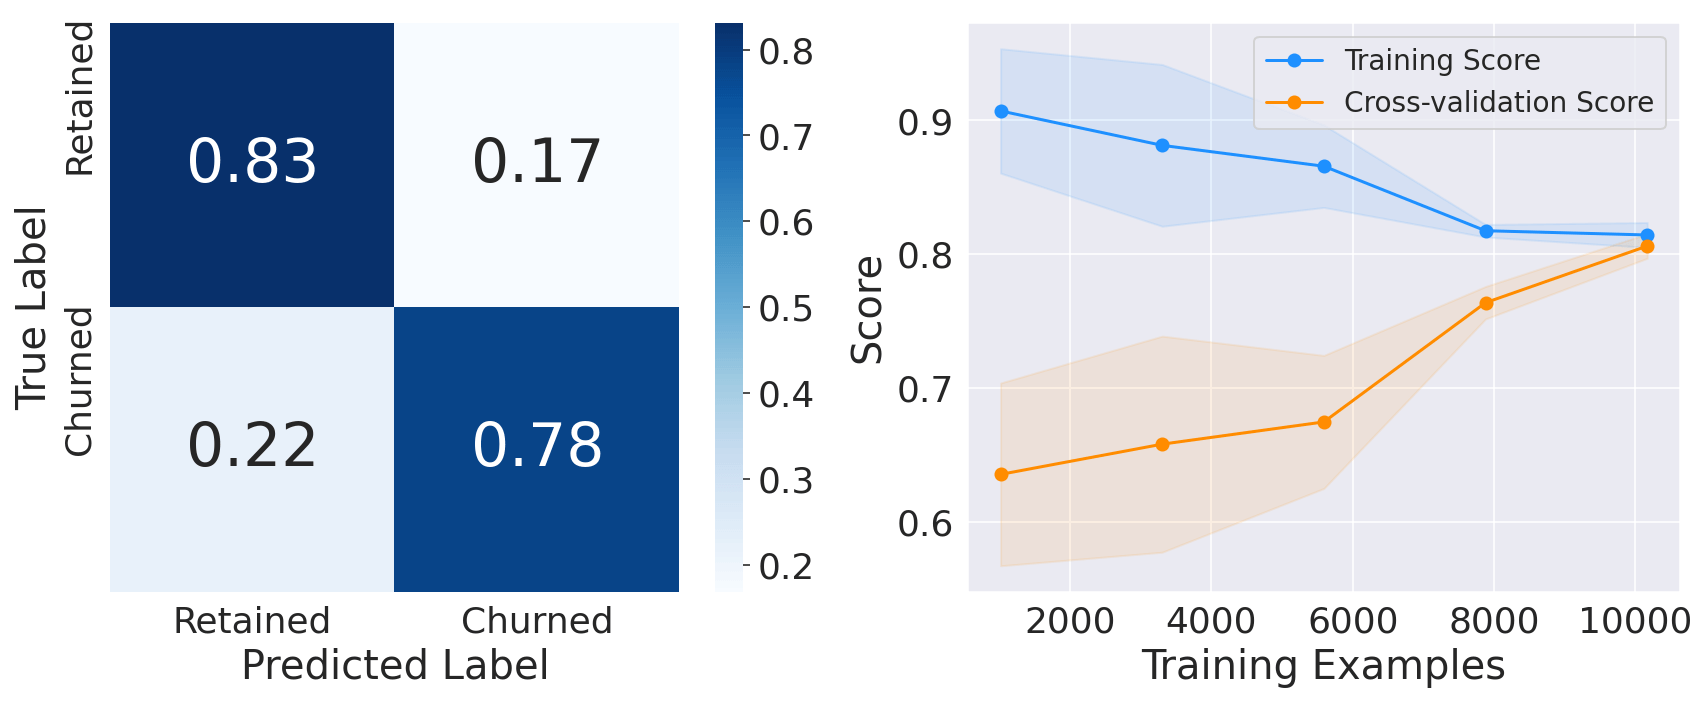
All other classifiers have a recall higher than 70% (baseline performance). XGB is the model with the highest recall (78.5 %). However, the LGBM classifier has the best overall performance with the highest accuracy, precision, and AUC. Output: 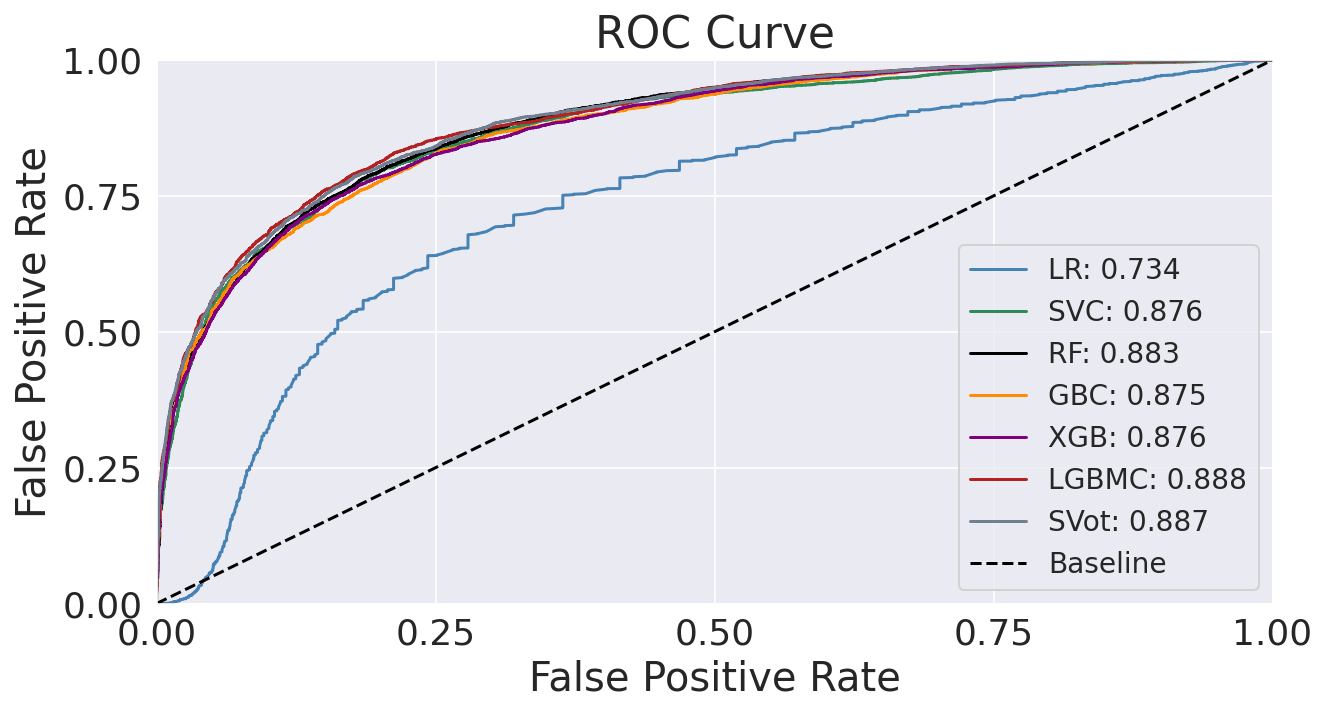
The dashed diagonal line represents a purely random classifier; a good classifier stays as far away from that line as possible (toward the top-left corner). In our case, all classifiers, apart from Logistic Regression, perform similarly. It seems that LGBM performs marginally better, as evidenced by the slightly higher AUC (0.888). Output: 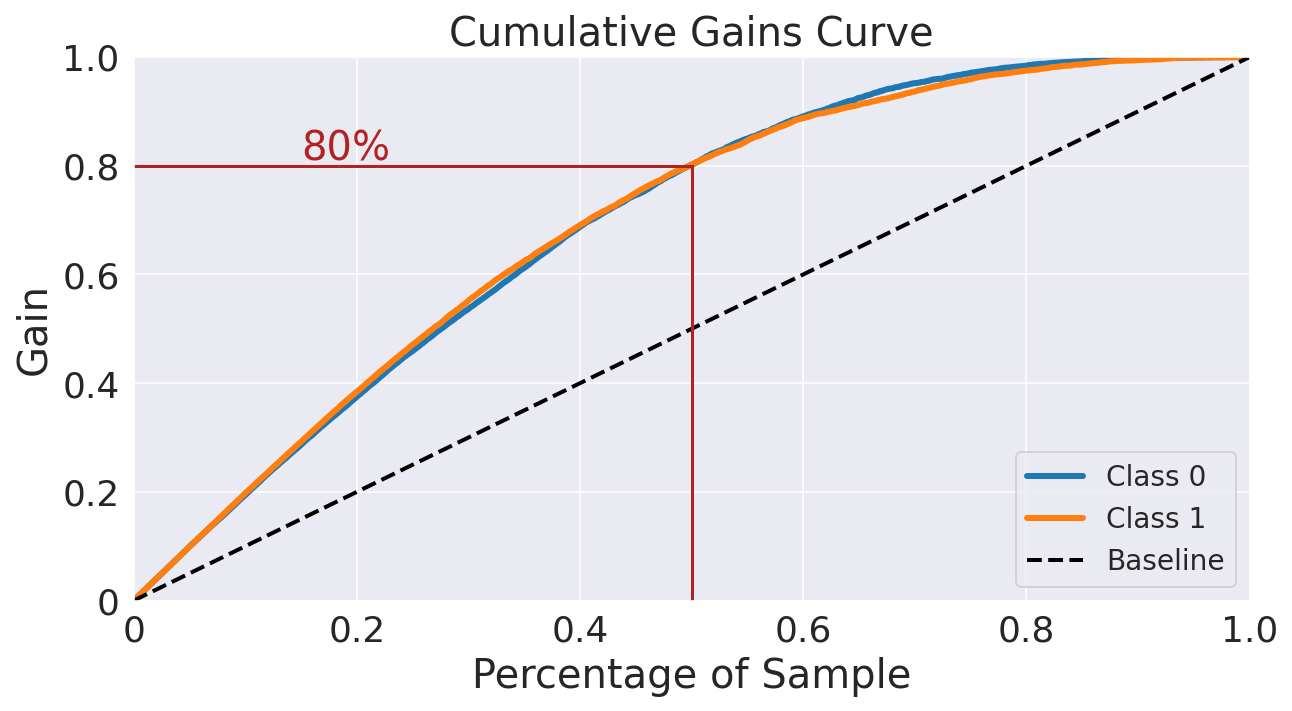
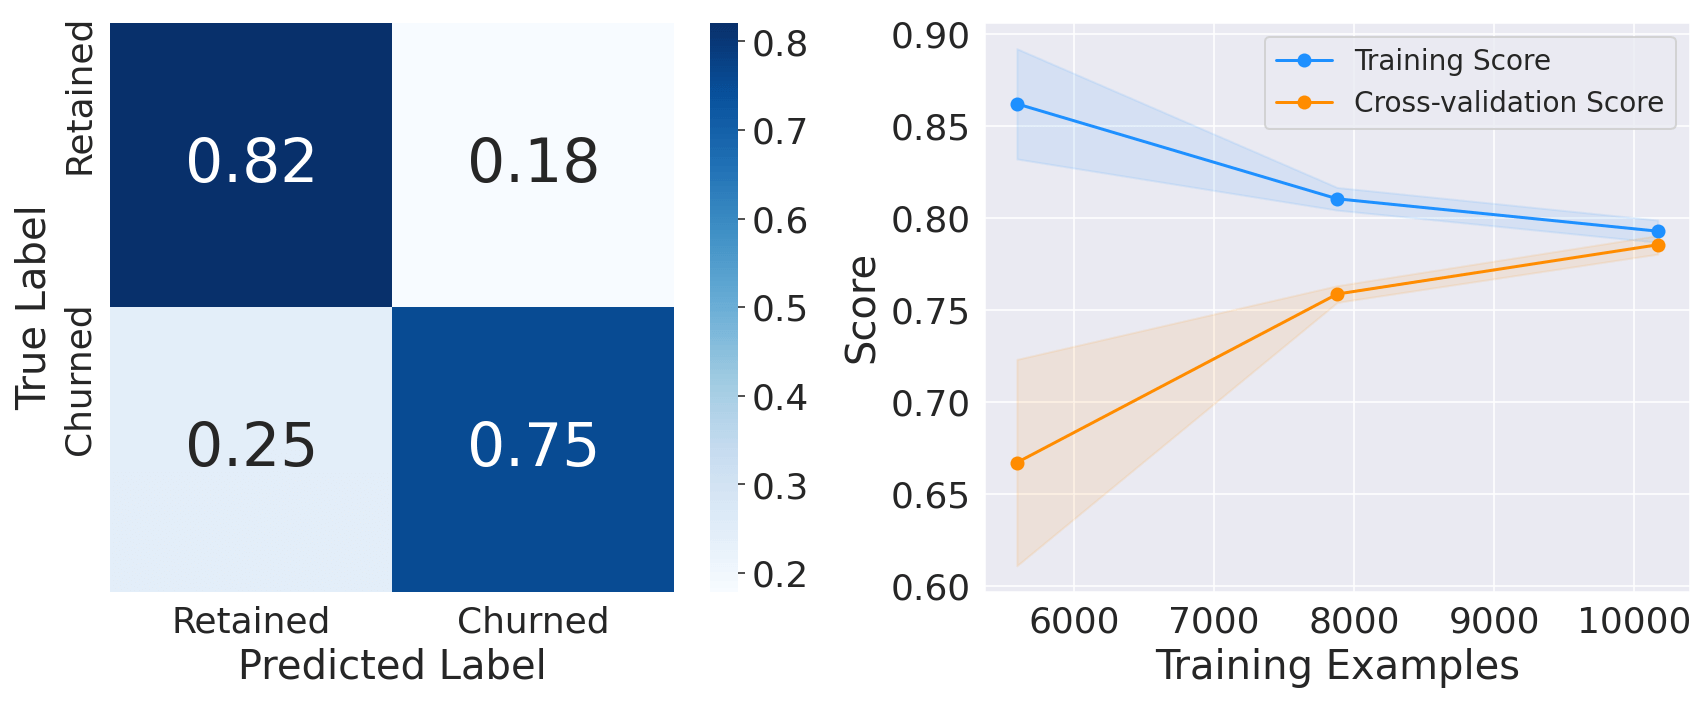
This chart shows that if we target 50% of the customers most likely to churn (according to the model), the model will pick 80% of customers who will actually churn, while the random pick would pick only 50% of the targets. Evaluating on Test SetOutput: 
Output: 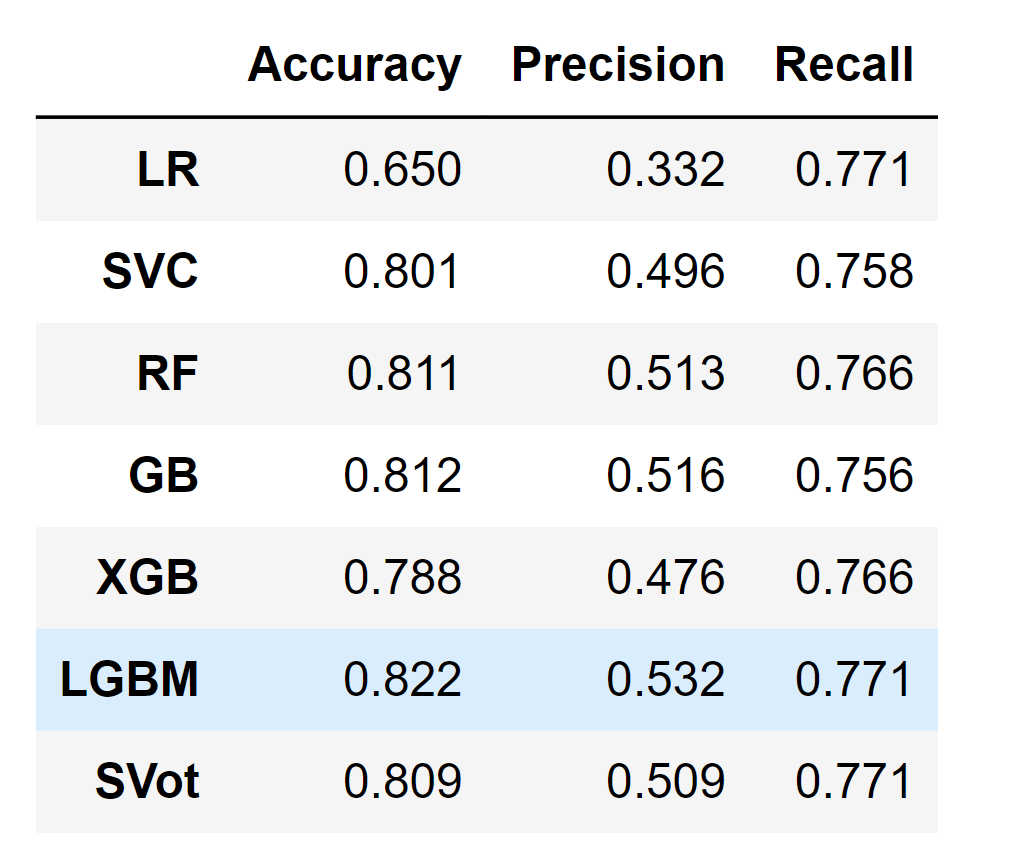
Output: 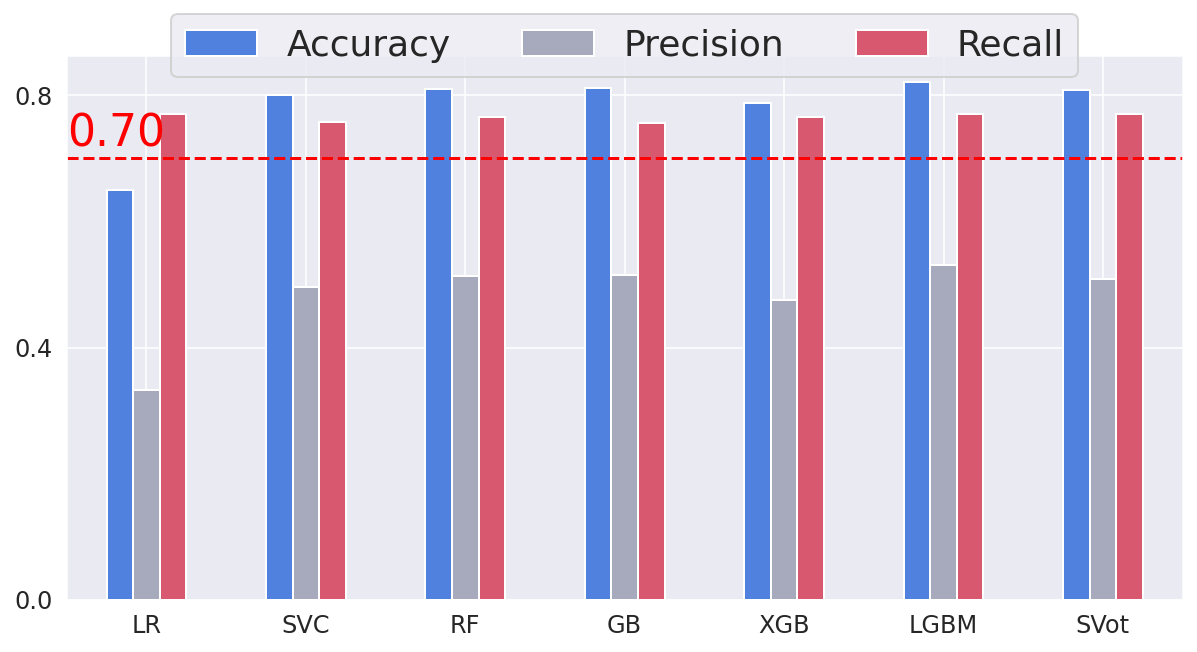
The performance on the test set for all models is fairly similar to the training set, which proves that we do not overfit the training set. Therefore, we can predict customer churn with a recall of approximately equal to 78%. ConclusionOverall, customer churn prediction using machine learning is a valuable tool for businesses aiming to optimize their customer retention strategies, increase customer satisfaction, and drive long-term growth. By leveraging the power of machine learning algorithms, businesses can gain valuable insights into customer behavior and take proactive steps to retain their valuable customer base. |
 For Videos Join Our Youtube Channel: Join Now
Feedback
- Send your Feedback to [email protected]
Help Others, Please Share


