Predicting Salaries with Machine LearningUsing Python to build a machine learning model to forecast NBAA salary and analyse the most important factors One of the richest and most competitive sports leagues is the NBAA. NBAA players' earnings have been rising over the past several years, but these salaries are determined by a complicated network of circumstances behind every jaw-dropping dunk and three-pointer. Numerous factors are at play, including market demand, athlete performance, team success, and sponsorship agreements. Who hasn't wondered why their club spent so much money on a player who isn't doing well or admired the thought process that went into a particularly clever business deal? In this post, we forecast NBAA wages using Python's machine learning skills and identify the key elements that have the most bearing on players' salary. Understanding the problemUnderstanding the foundations of the league's wage system is crucial before delving into the issue. A player is considered a free agent (FA ), a word that will be used frequently in this project, when he is available to sign a deal with any organisation. In order to preserve a competitive balance among clubs, the NBAA is governed by a complicated system of rules and regulations. The wage ceiling and the luxury tax are the two fundamental ideas of this system. A team's ability to spend money on player wages during a particular season is limited by the salary cap. The cap, which is based on league income, is modified each year to make sure that teams are able to manage their budgets. Additionally, it aims to promote fairness among franchises by preventing large-market teams from spending much more than their counterparts in smaller markets. The salary cap can be distributed differently among players, with top-tier players receiving maximum pay and rookies and veterans receiving minimum salaries. However, clubs who want to build lineups capable of contending for championships frequently go above the pay cap. A club enters the luxury tax zone when its payroll exceeds the wage cap. Teams pay a penalty as a result of the luxury tax. The mid-level exception (MLE ) and trade exception, which allow clubs to make tactical roster adjustments, are only two of the numerous laws that serve as exceptions, but for this project, understanding the salary limit and luxury tax is sufficient. 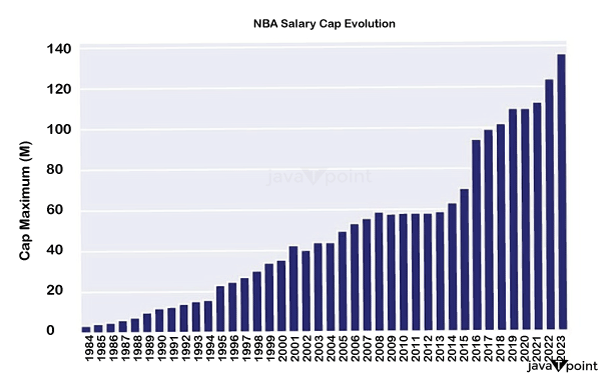
The strategy chosen would use the percentage of the cap as the objective instead of the actual compensation amount due to the salary cap's continuing, continual rise. This choice seeks to take into account how the cap is changing, guaranteeing that the result is unaffected by temporal changes and applies even when analysing past seasons. It should be emphasised that this is merely an estimate and not a perfect representation. DataThe objective of this research is to forecast the earnings of players who sign new contracts for the following season using only data from the current season. The specific stats that were used were: • Average stats per game • Total stats • Advanced stats • Individual stats: age, position • Salary-related stats: salary from the previous season, max cap for the previous and current seasons, and the percentage of that pay that was covered by the cap. 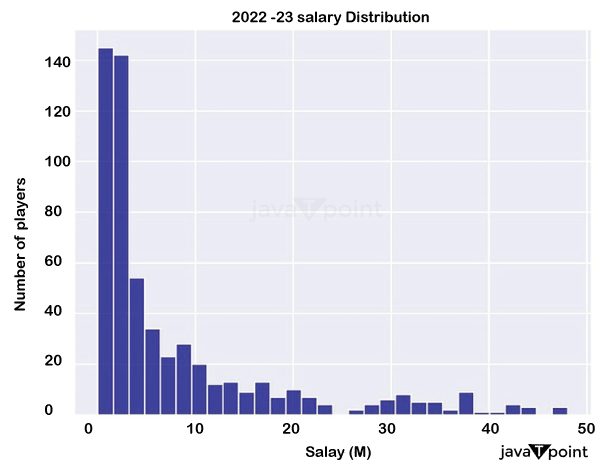
Only individual features were added because we don't know which team the player would sign with. This research included 78 characteristics for the target and each player combined. BRScraper, a Python programme I recently developed that enables easy access to basketball data from Hoops Reference, including NBAA, G League, and other foreign leagues, was used to collect the majority of the data. All instructions on damaging the website or impairing its functionality were adhered to. Data TreatmentThe choice of players for the training of the models is an intriguing factor to take into account. Initially, I chose every player that was available, but because the majority of them would already be bound by a contract, the wage amount did not alter significantly. Consider a player who agrees to a four-year, $20M contract. He earns about $5M year (very seldom are all years exactly the same amount; often there is some development in the pay around $5M ). However, the value may alter even more when a free agent signs a new contract. The performance would be noticeably poorer when evaluating solely free agents, even while training a model with every one of the players may have a better overall result (after all, most players would have salaries that were fairly similar to the previous! ). Only players of this kind should be included in the data as the objective is to estimate the wage of a player signing a new deal. This will help the model better comprehend the trends among these players. The 2023-24 season is the one that is of importance, however data will be used from 2020-21 onwards to increase the variety of samples, which is achievable owing to the target selection. ModelingThe train-test split was created to retain a roughly 70/30 split while only including all free agents from 2023-24 in the test set. At first, a number of regression models were applied: AdaBoost, Gradient Boosting, Support Vector Machines (SVM ), Elastic Net, Random Forest, Light Boosting of Gradients Machine (LGBM ), and others The root mean square error (RMSE ) and coefficient of determination (R2 ) were used to assess each of their performances. ResultsThe following outcomes were found after taking into account the entire dataset for all seasons: 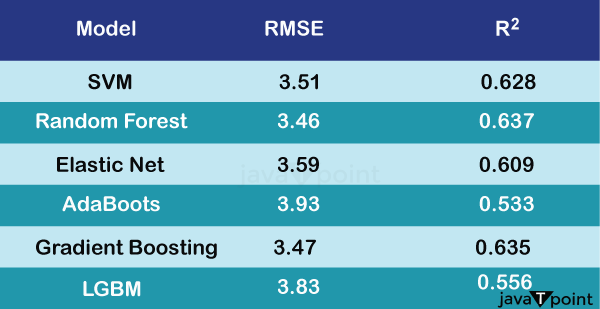
Overall, the models performed well; AdaBoost had the worst metrics among the models employed, while Random Forest and Gradient Boosting obtained the lowest RMSE and greatest R2. Analysis of VariablesThrough SHAP Values, a method that offers a logical explanation of how each characteristic affects the model's predictions, it is possible to visualise the important factors that have an impact on the model's predictions. Again, Predicting the NBAA MVP using Machine Learning provides a more in-depth description of SHAP and how to read its chart. 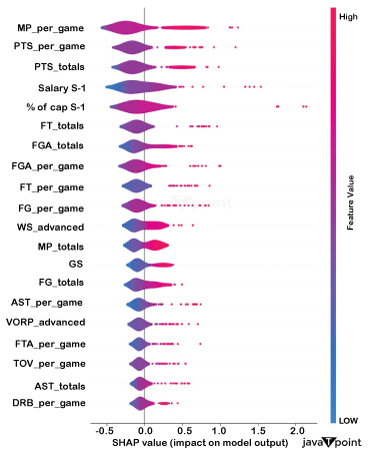
Several significant inferences may be made from this graph:
This is unexpected considering that the majority of modern statistics were created with the specific purpose of improving player performance evaluation. A notable omission from the top 20 is the Player Efficiency Rating (PER ), which is found in 43rd place. It suggests that general managers could adhere to a relatively straightforward strategy when negotiating salaries, sometimes omitting the wider range of performance rating indicators. Perhaps the issue is not as complicated as first thought! Simply put, the person who logs the most playing time and points wins more! Further Resultsconcentrating on the free agents this year and contrasting their expected pay with the actual pay: 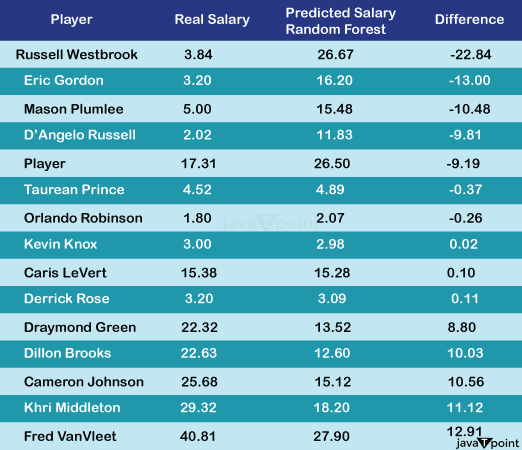
Principal findings from the Random Forest model for the 2023-2024 season (values in millions).
Source code for the application (Predicting Salaries with Machine Learning)Output: 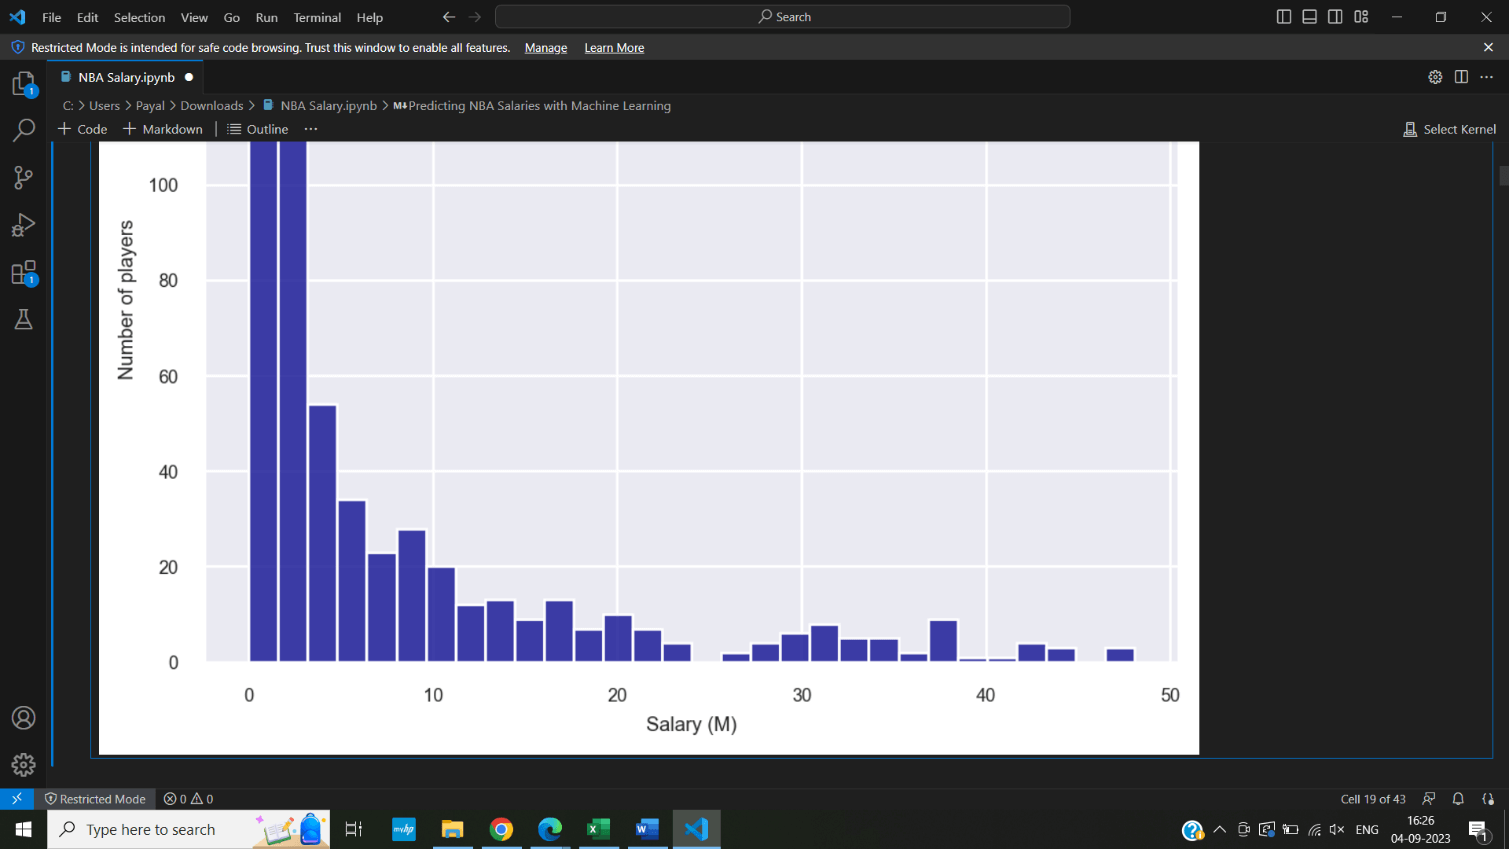
Next TopicFine-tuning Large Language Models
|
 For Videos Join Our Youtube Channel: Join Now
Feedback
- Send your Feedback to [email protected]
Help Others, Please Share


