| |

Crop Yield Prediction Using Machine Learning
Crop yield prediction is an important aspect of agriculture that helps farmers make informed decisions about their crops. It involves estimating the number of crops that will be produced in a given area based on various factors such as soil type, weather conditions, and crop management practices. In recent years, machine learning (ML) has emerged as a powerful tool for predicting crop yields. Machine learning is a branch of artificial intelligence (AI) that allows computers to learn from data without being explicitly programmed. This makes it ideal for crop yield prediction because it can identify patterns and relationships in large amounts of data and make predictions based on these relationships. There are various types of machine learning algorithms that can be used for crop yield prediction, including regression, decision trees, and artificial neural networks. Regression algorithms are commonly used for predicting crop yields because they are simple to understand and easy to implement. These algorithms use a set of inputs (such as weather data, soil data, and management practices) to predict the output (crop yield). Decision tree algorithms are also used for crop yield prediction. They use a tree-like structure to model decisions and their potential consequences. The algorithm starts by making a decision based on the most important input factor and then continues to make additional decisions based on subsequent inputs. The final result of the algorithm is a prediction of crop yield. Artificial neural networks are a more complex type of machine learning algorithm that is modelled after the structure and function of the human brain. They are particularly well suited for crop yield prediction because they can handle large amounts of data and identify complex patterns and relationships. To implement machine learning for crop yield prediction, a large dataset of crop yield data is required. This data should include information about the crop, such as the type of crop, the location, and the date of planting. Additionally, data on weather conditions and soil characteristics should also be collected. The machine learning algorithm is then trained on this data to learn the relationships between the inputs and outputs. Once the machine learning algorithm has been trained, it can be used to make predictions about crop yields in new areas. This is done by inputting the necessary data (such as weather conditions and soil characteristics) and allowing the algorithm to make a prediction. In this article, machine learning techniques will be used to anticipate the top 10 yields that are eaten globally. These crops include :
Now we will implement it in the code. 1. Importing Libraries2. Gathering and Cleaning DataGathering and cleaning data is an essential step in machine learning, as it can significantly impact the accuracy and performance of the model. Crops Yield DataThe ten most popular crops in the world in terms of yield were taken from the FAO website. The information gathered consists of the nation, item, year (from 1961 to 2016), and yield value. Output: 
The Total number of rows in the yield dataset is 56717, along with 12 columns. Output: 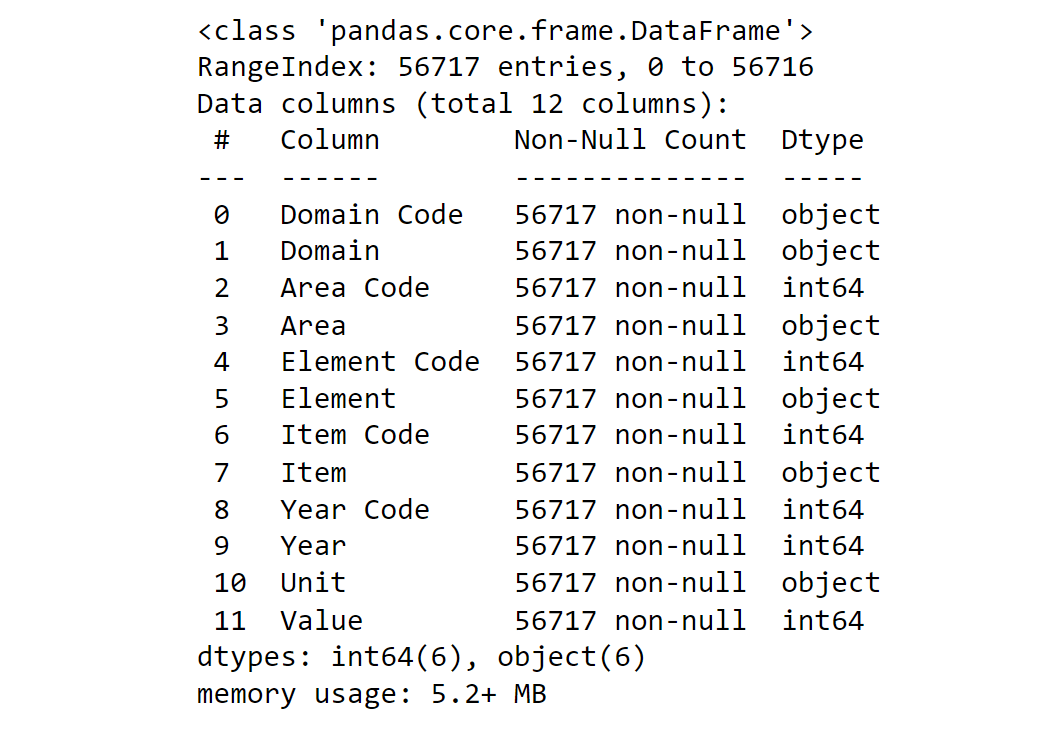
Output: 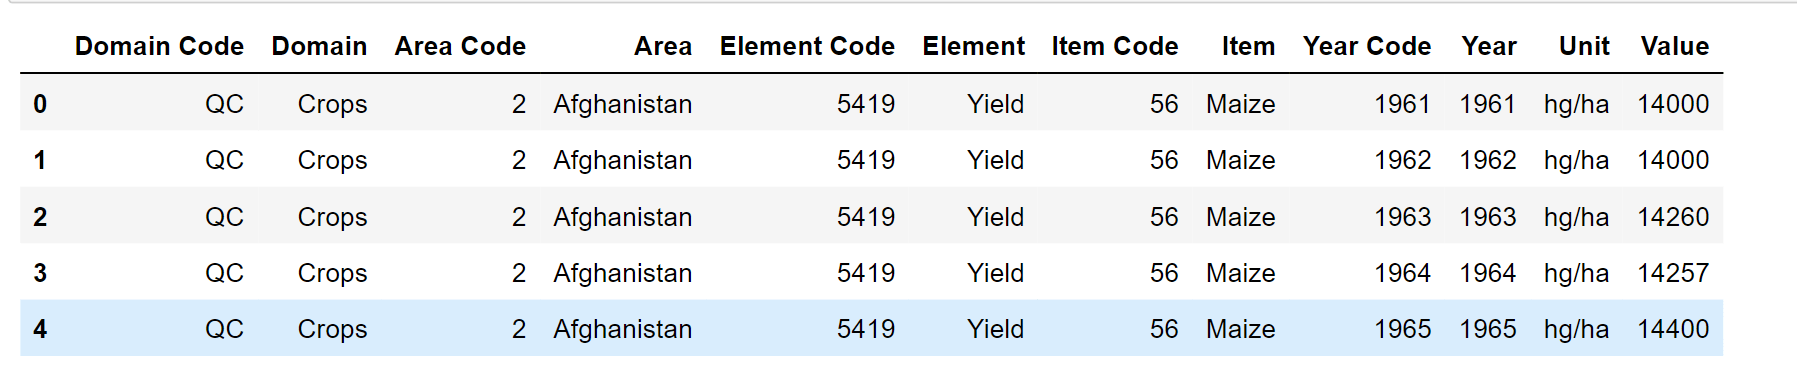
Output: 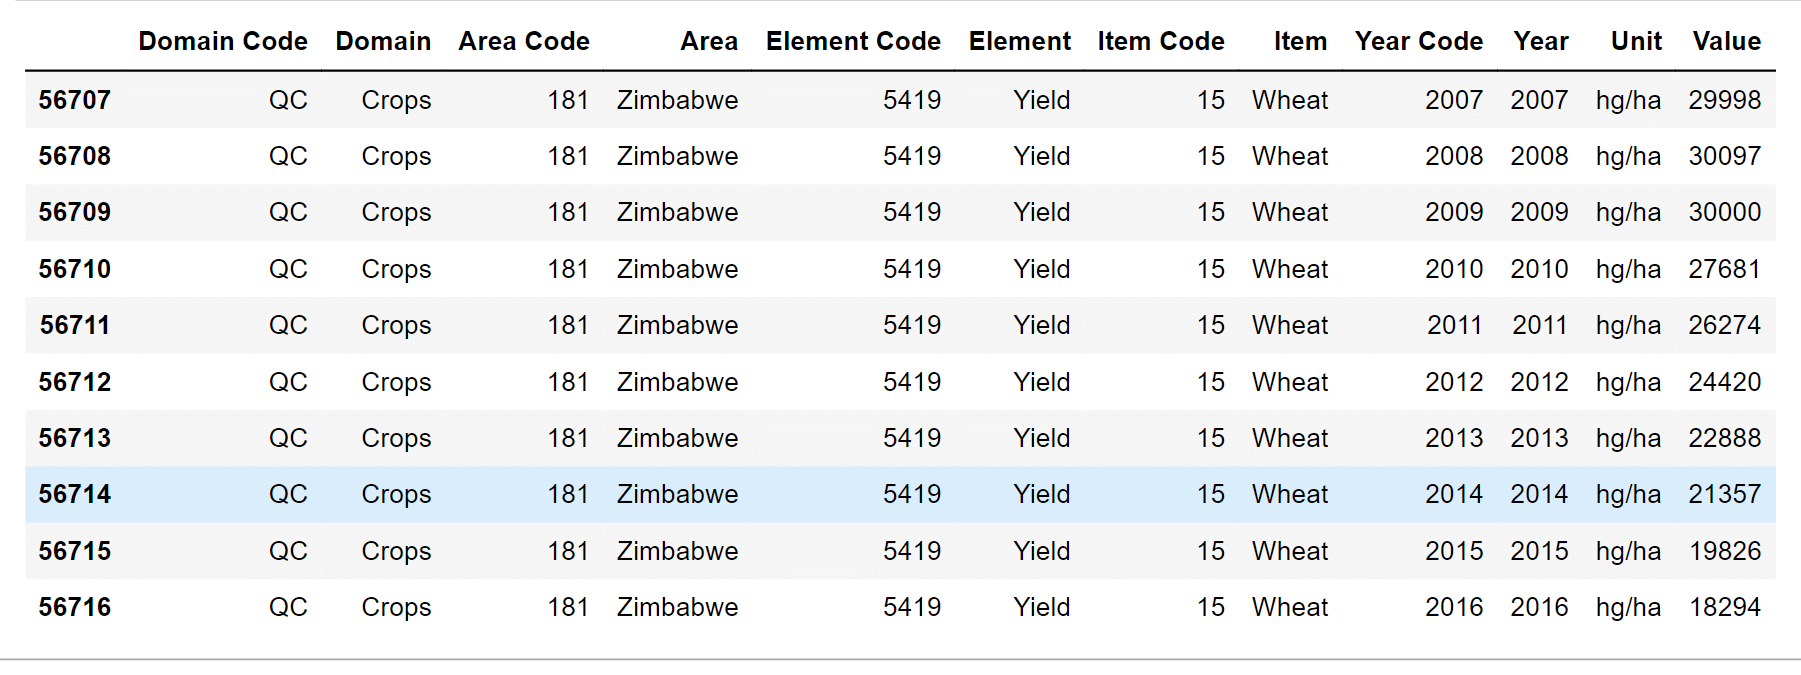
By taking a closer look at the columns in the CSV file, we may rename Value to hg/ha yield to make it clearer that this is the production value of our crops' yields. Moreover, extraneous columns like the area code, domain, item code, etc., should be removed. Output: 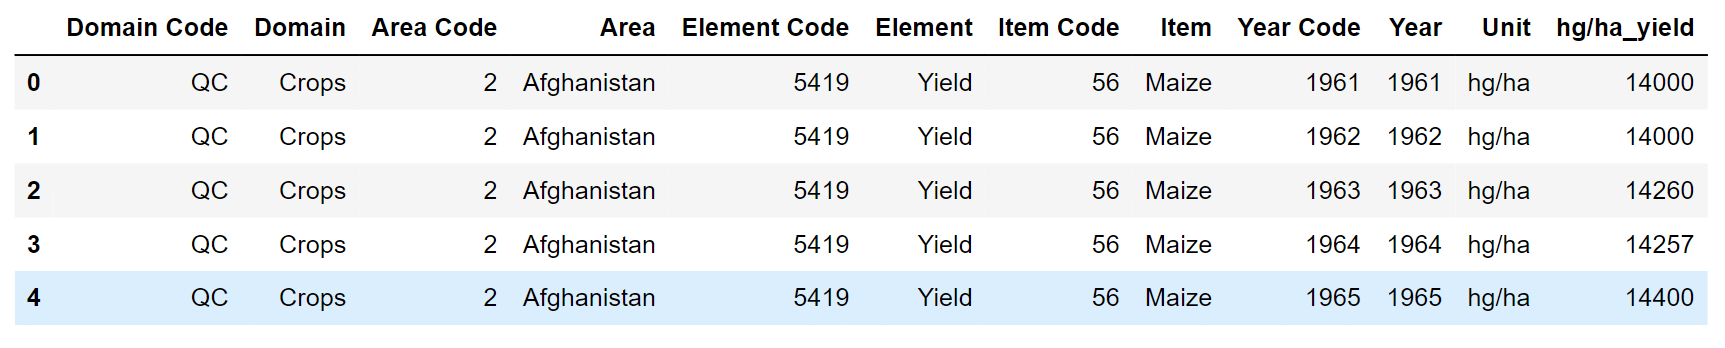
Output: 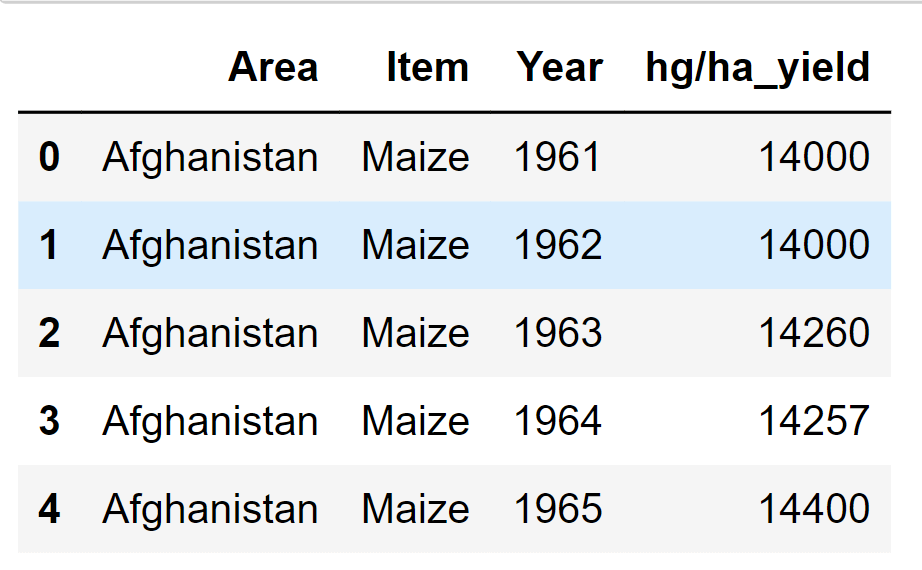
Output: 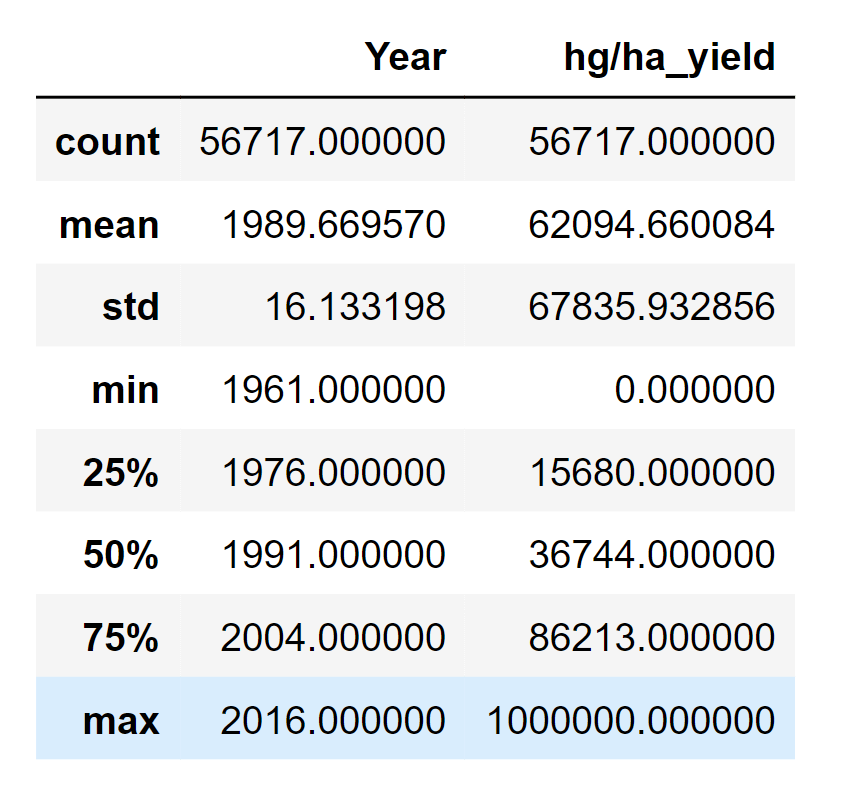
Output: 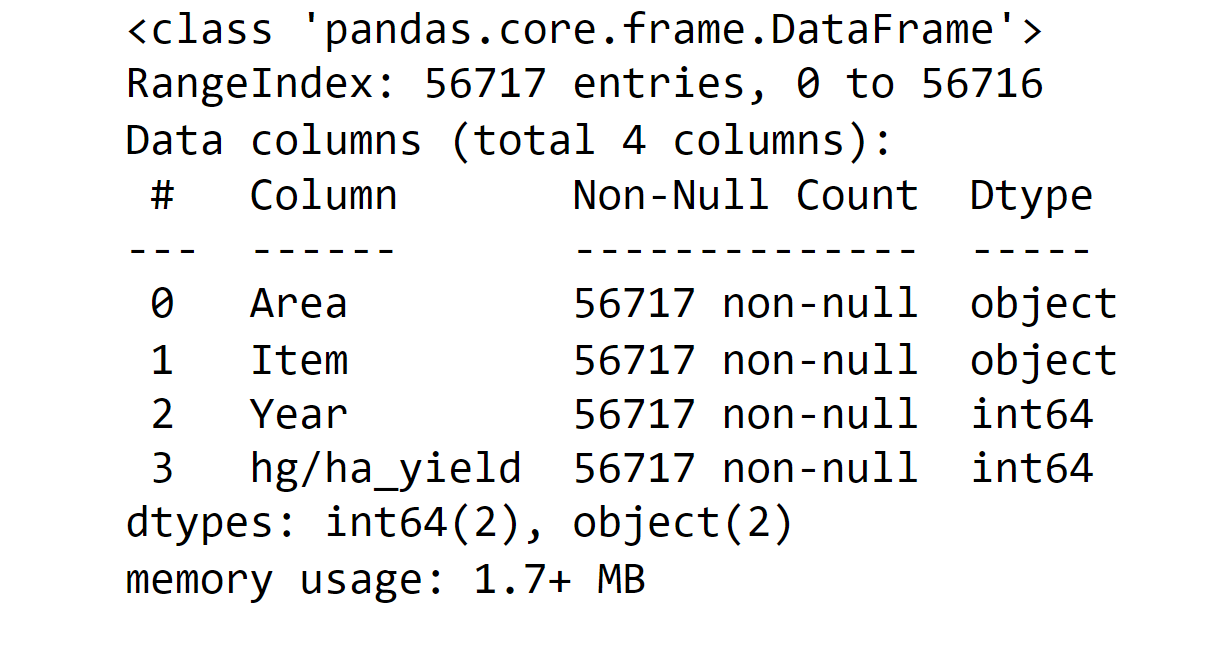
Climate Data: RainfallPrecipitation and temperature are climatic elements. The environmental variables that affect plant growth and development are made up of abiotic elements, such as soil and pesticides. The impact of rainfall on agriculture is significant. Information on annual rainfall was acquired for this project from the World Data Bank. Output: 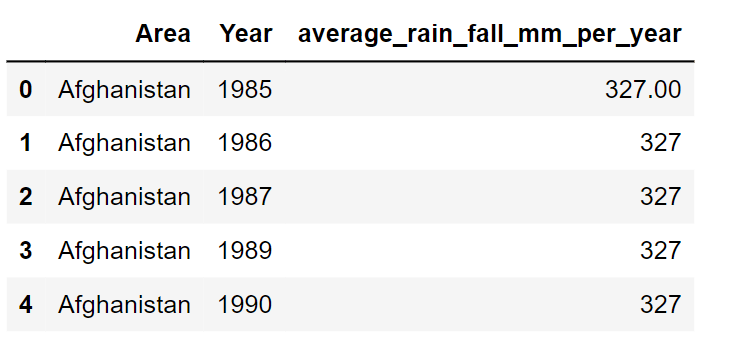
Output: 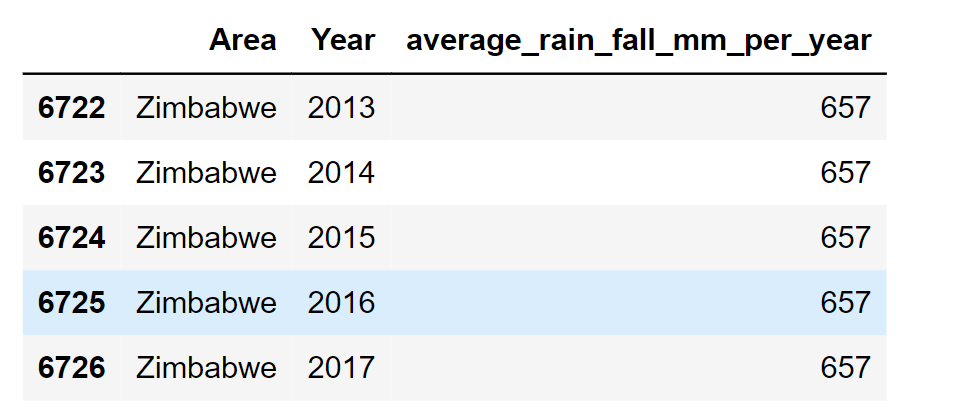
Now, we will check for the datatypes in the dataset. Output: 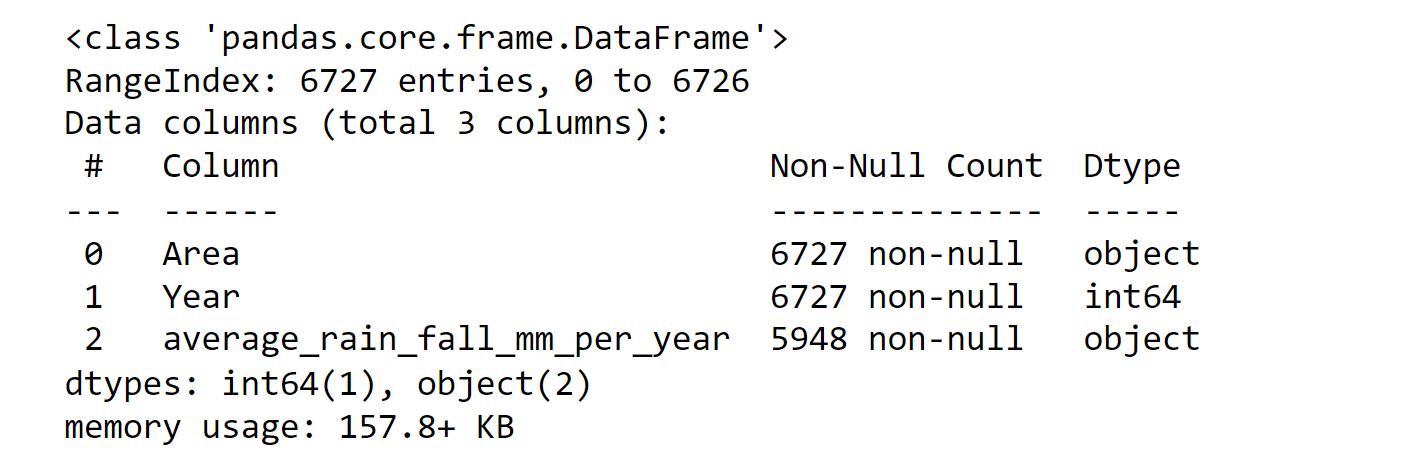
We need to change the datatype of average_rain_fall_mm_per_year from object to float. Also, keep that in mind. It also contains some missing values. Output: 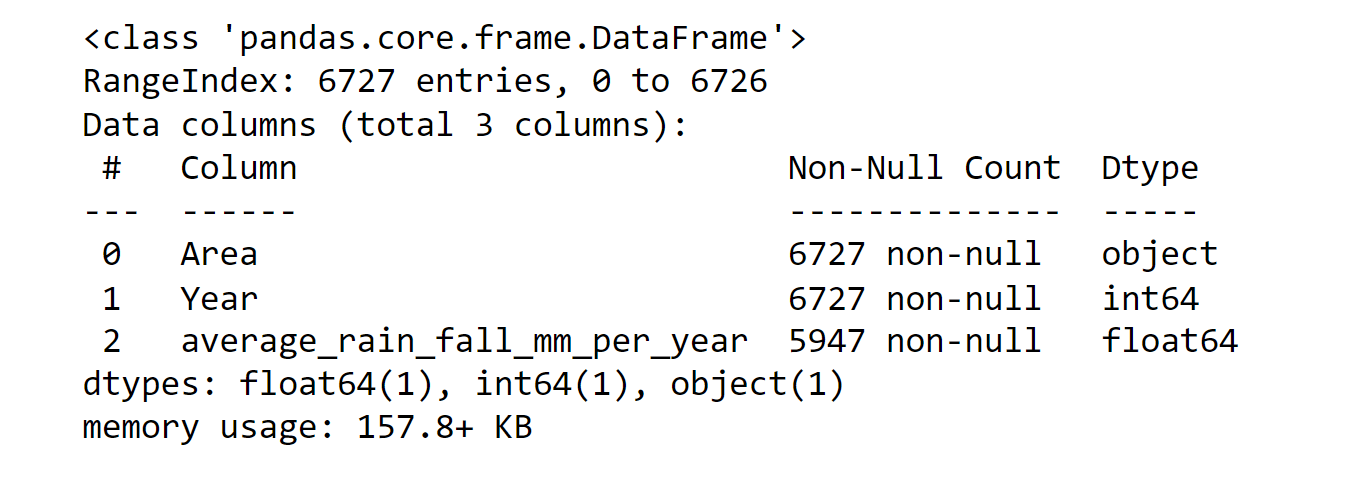
After that, we will remove any blank rows from the dataset and combine the yield dataframe with the rain dataframe according to the year and area columns. Output: 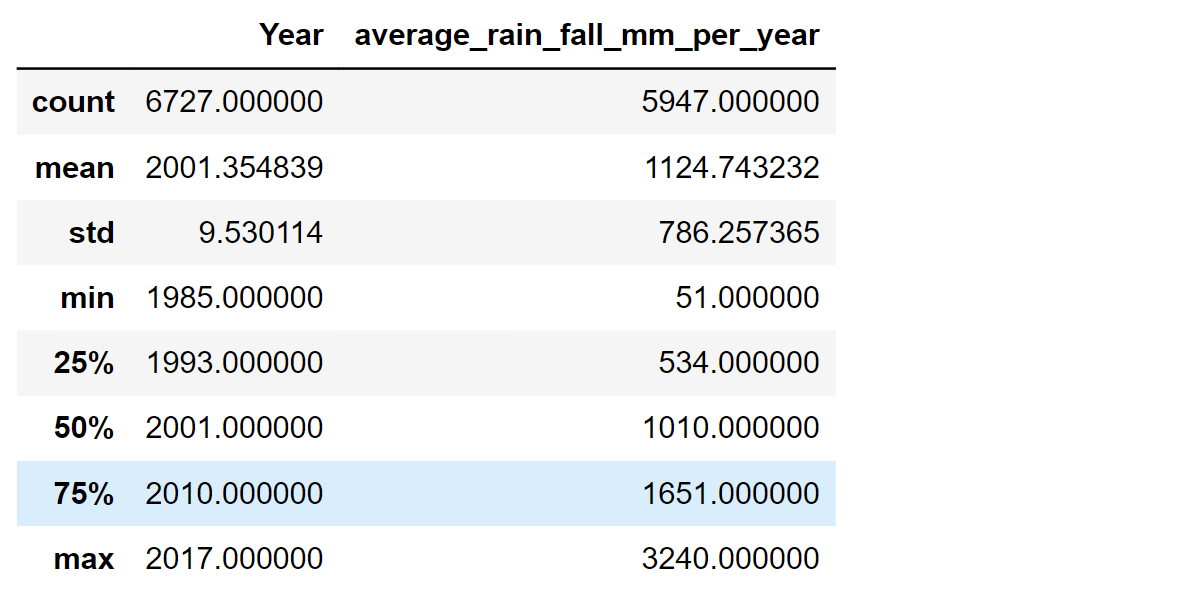
The rainfall dataframe spans the years 1985 through 2016. We will now combine the yield dataframe with the rain dataframe according to the year and area columns. Output: 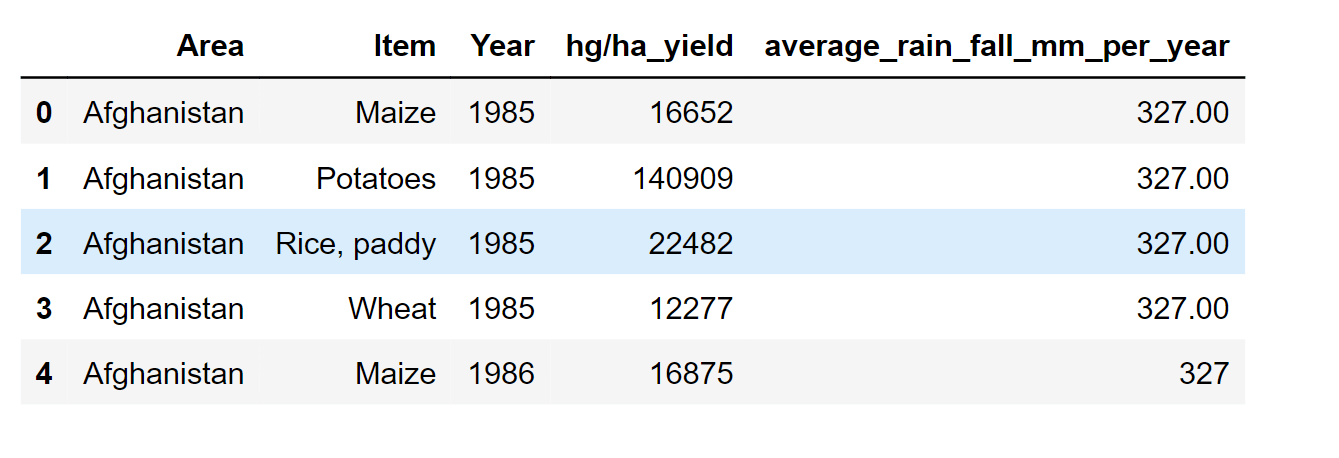
As the rainfall data started in 1985, we can see that the years now start with the first yield dataframe, which started in 1961. Output: 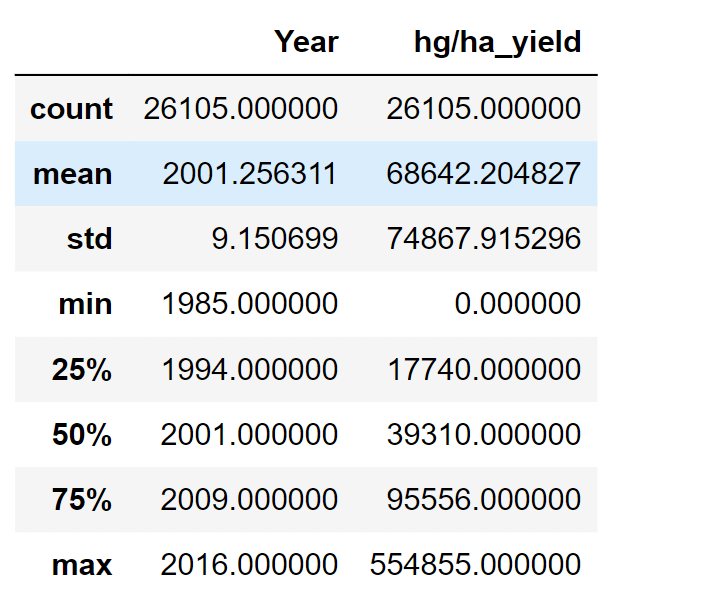
Pesticides DataUsing the FAO database, pesticides used for each nation and item were also gathered. Output: 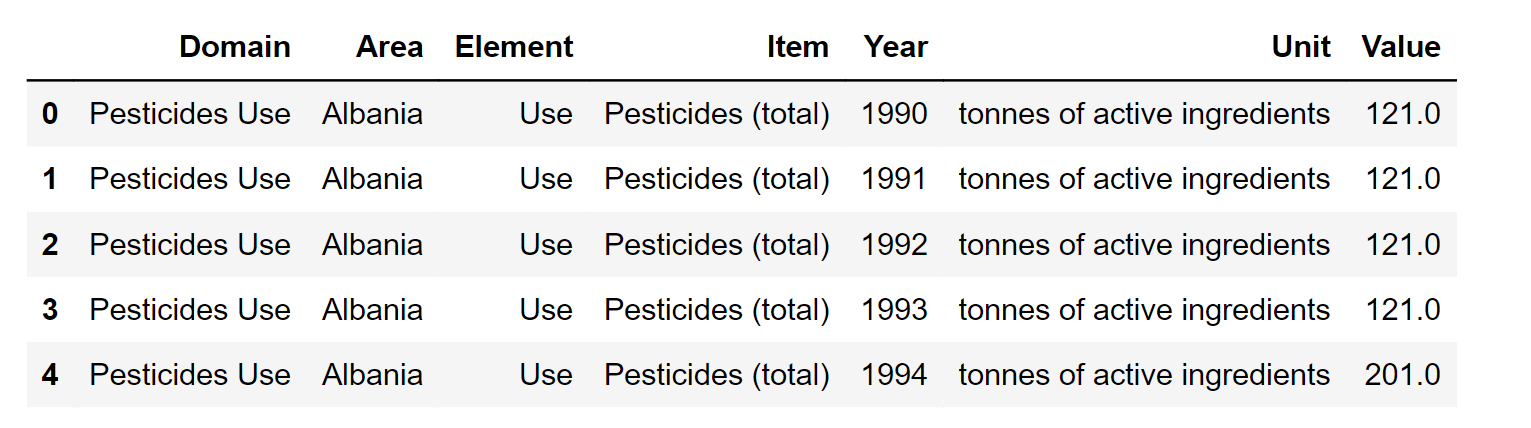
Now, we will rename the column name Value to pesticides_tones. Along with it, we will also drop the unwanted column, which is not required for future purposes. Output: 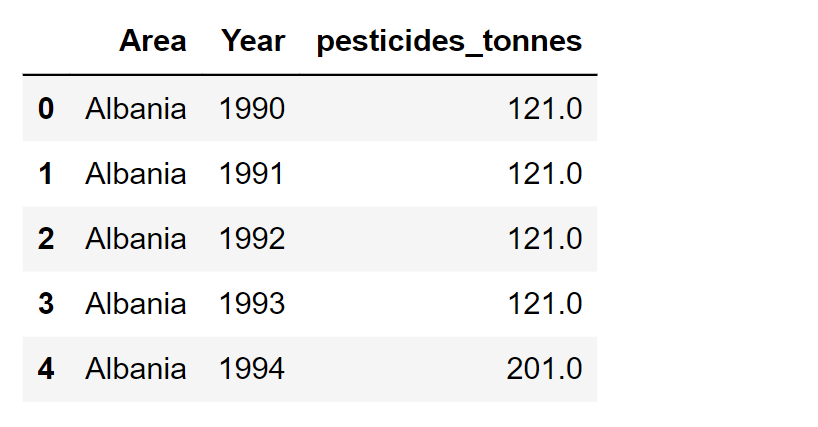
Output: 
Output: 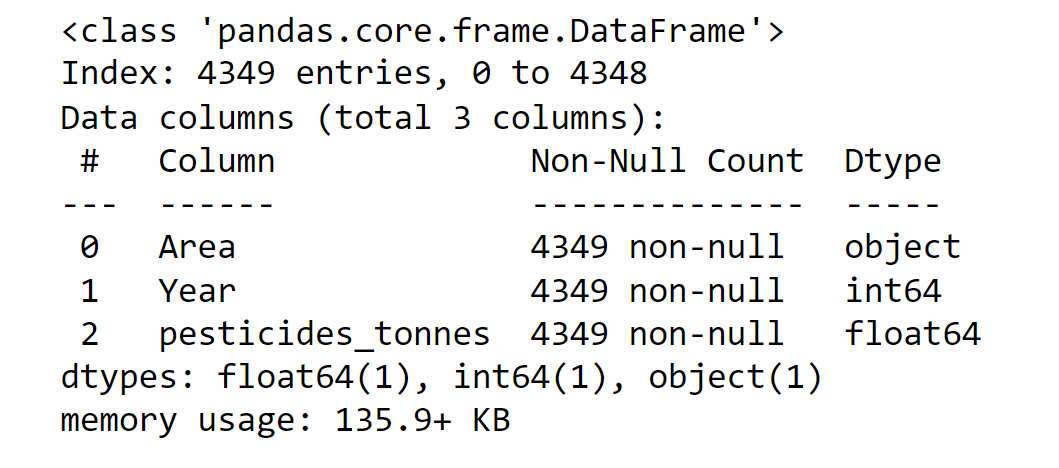
Now we will merge the Pesticides dataframe with the main dataframe Output: 
Output: 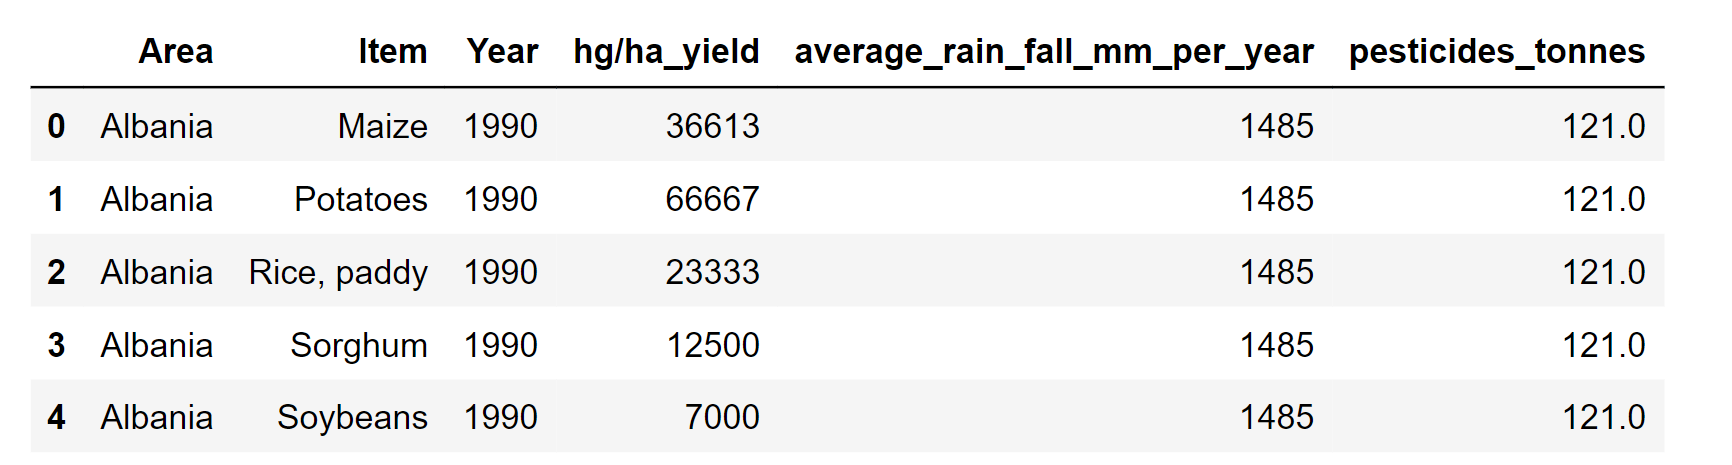
Average TemperatureEach country's average temperature was determined using World Bank data. Output: 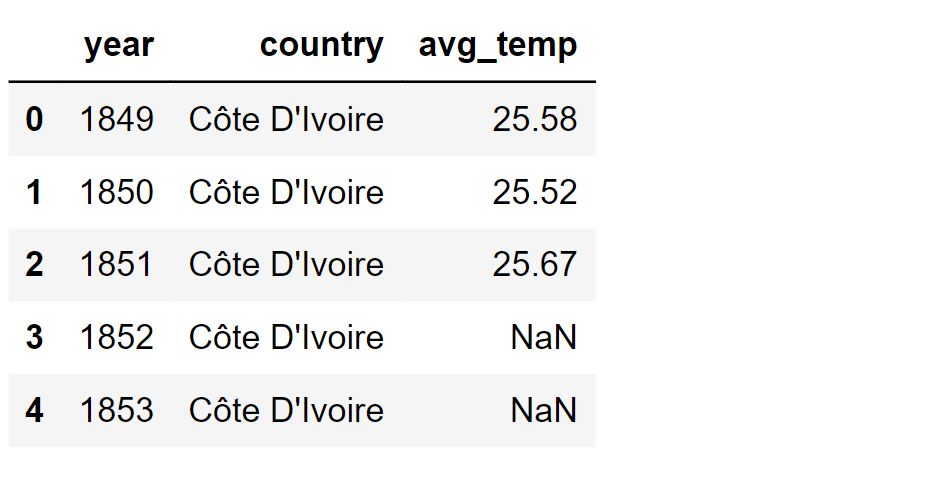
Output: 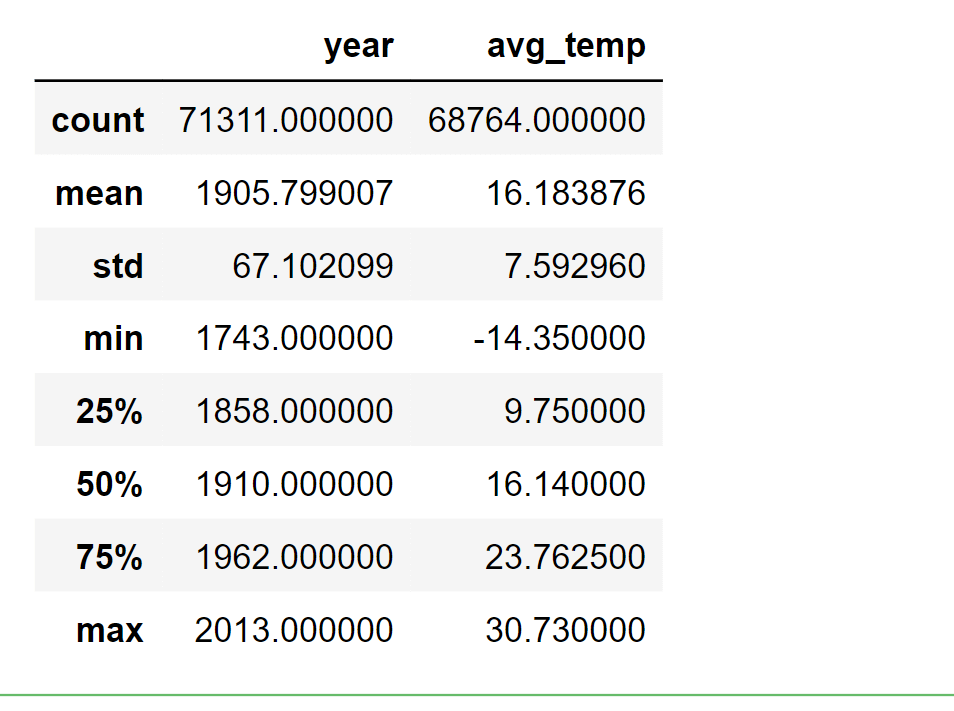
According to our observations, the average temperature ranges from 1743 to 2013, with a few empty rows that we must remove. Next, we will rename the columns. Output: 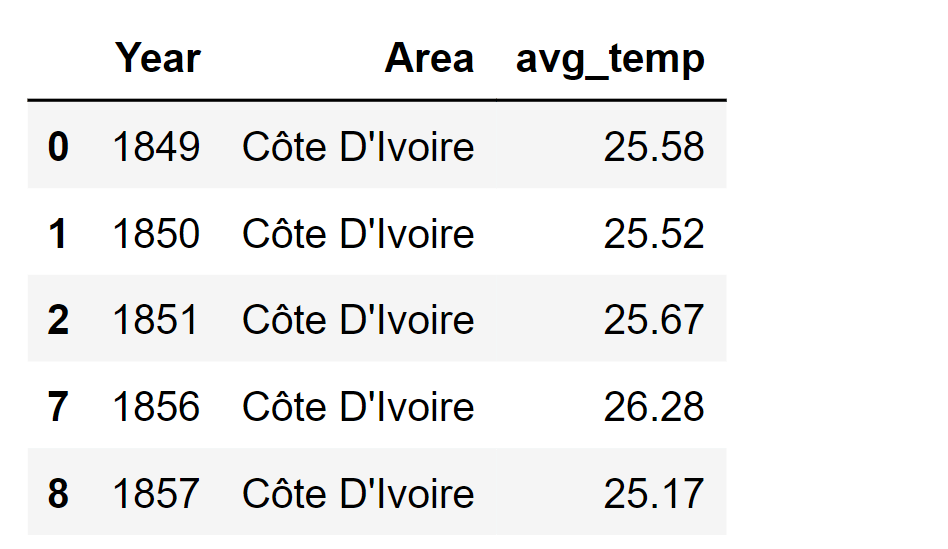
Output: 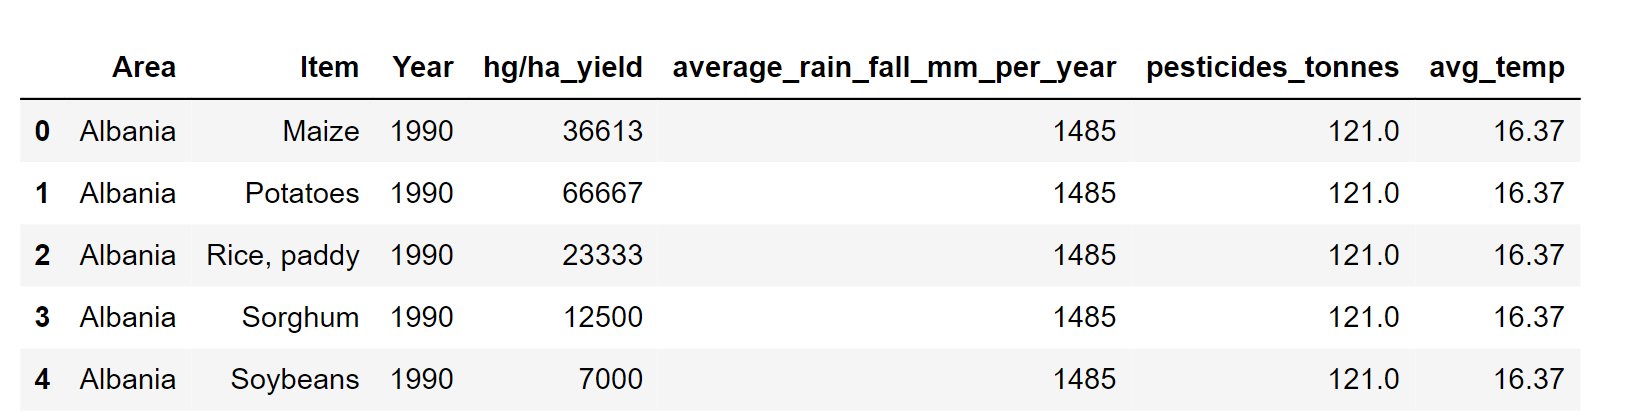
Output: 
The shape of the main dataframe is changing as we merge other dataframe in it. Output: 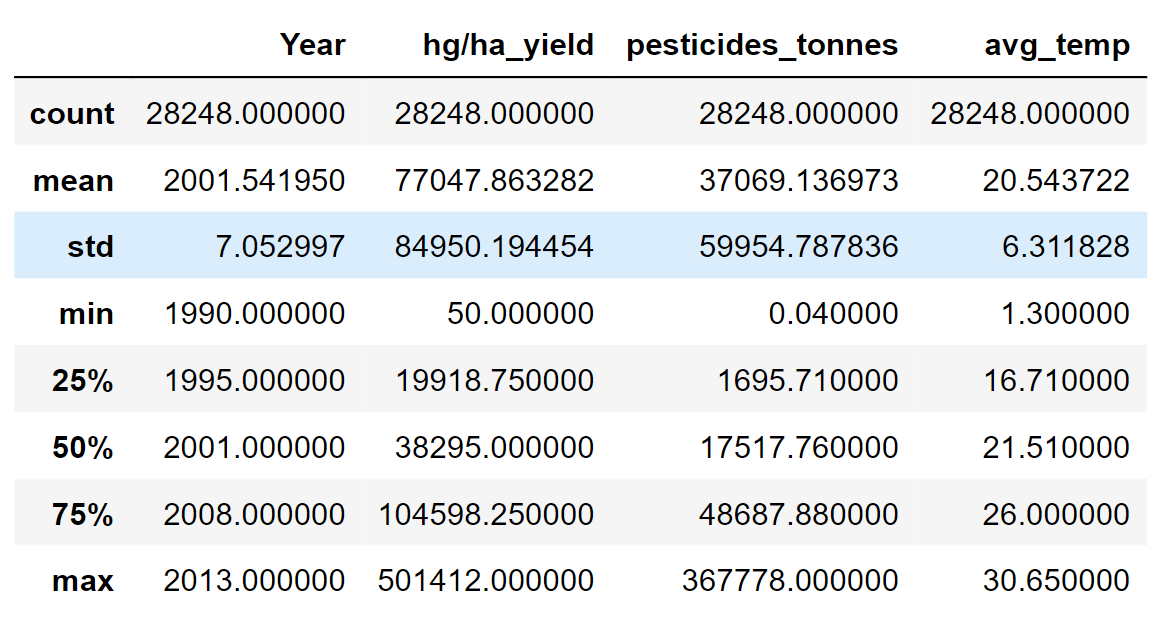
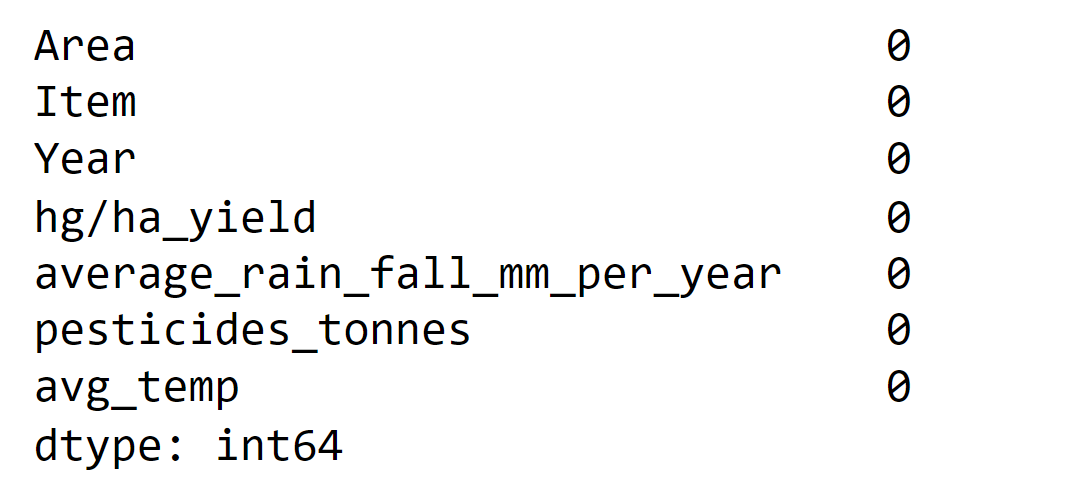
Looking for the null values in the main dataframe. Output: 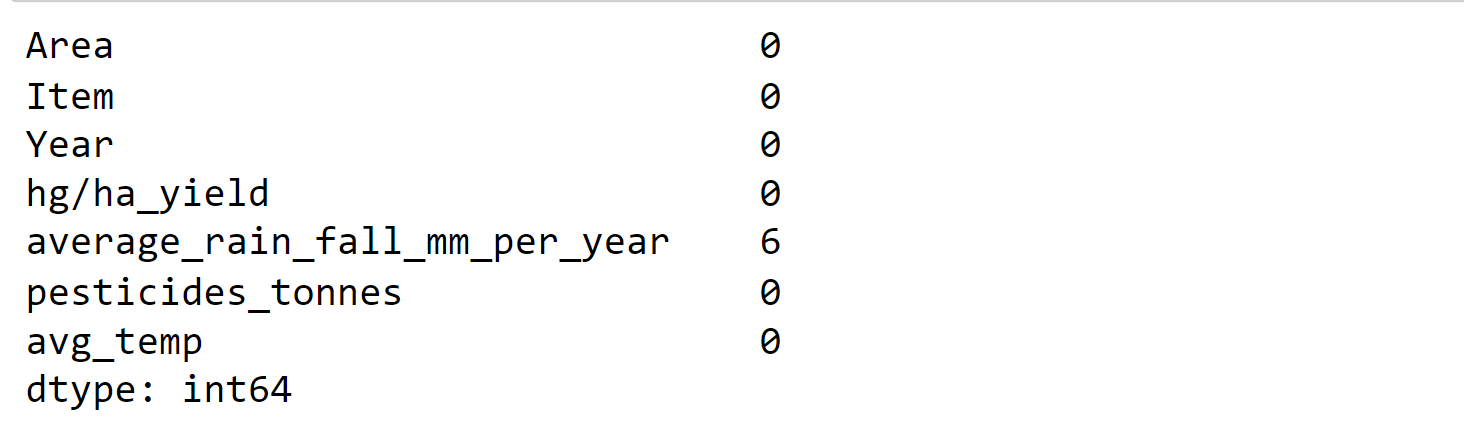
Unfortunately, we have six null values in the average_rain_fall_mm_per_year column. Output: 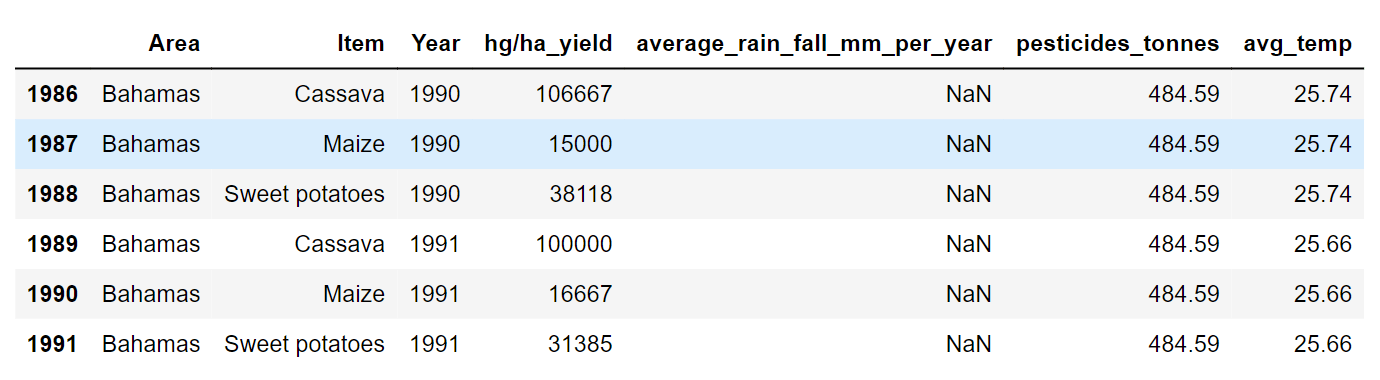
We need to drop the above rows. Output:
Great, no empty values! 3. Data ExplorationFrom all the merging, we got the dataframe_main as the final obtained dataframe. Now we need to explore it. Output: 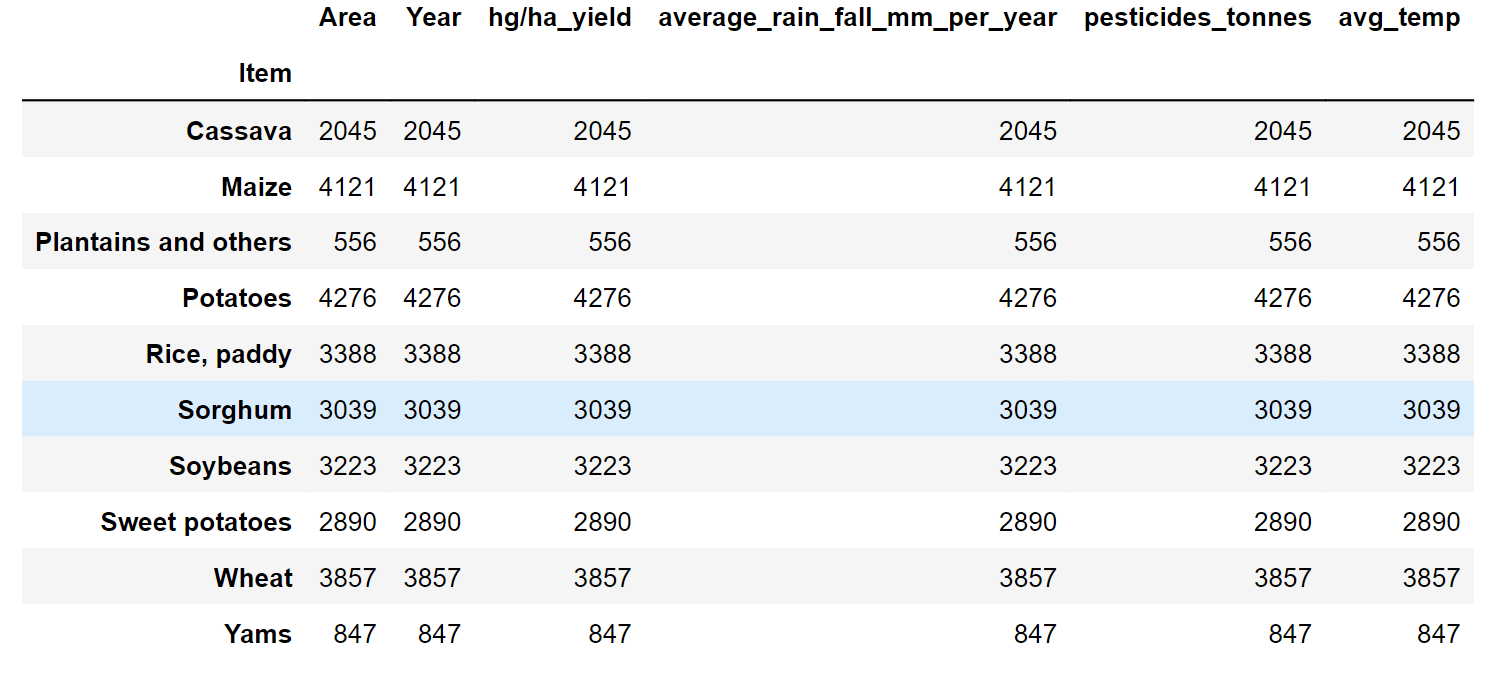
Output: 
There is a significant fluctuation in the values for each column, which we'll scale down later. Output: 
The 101 Nations in the dataframe are ranked by highest yield output out of 10, so: Output: 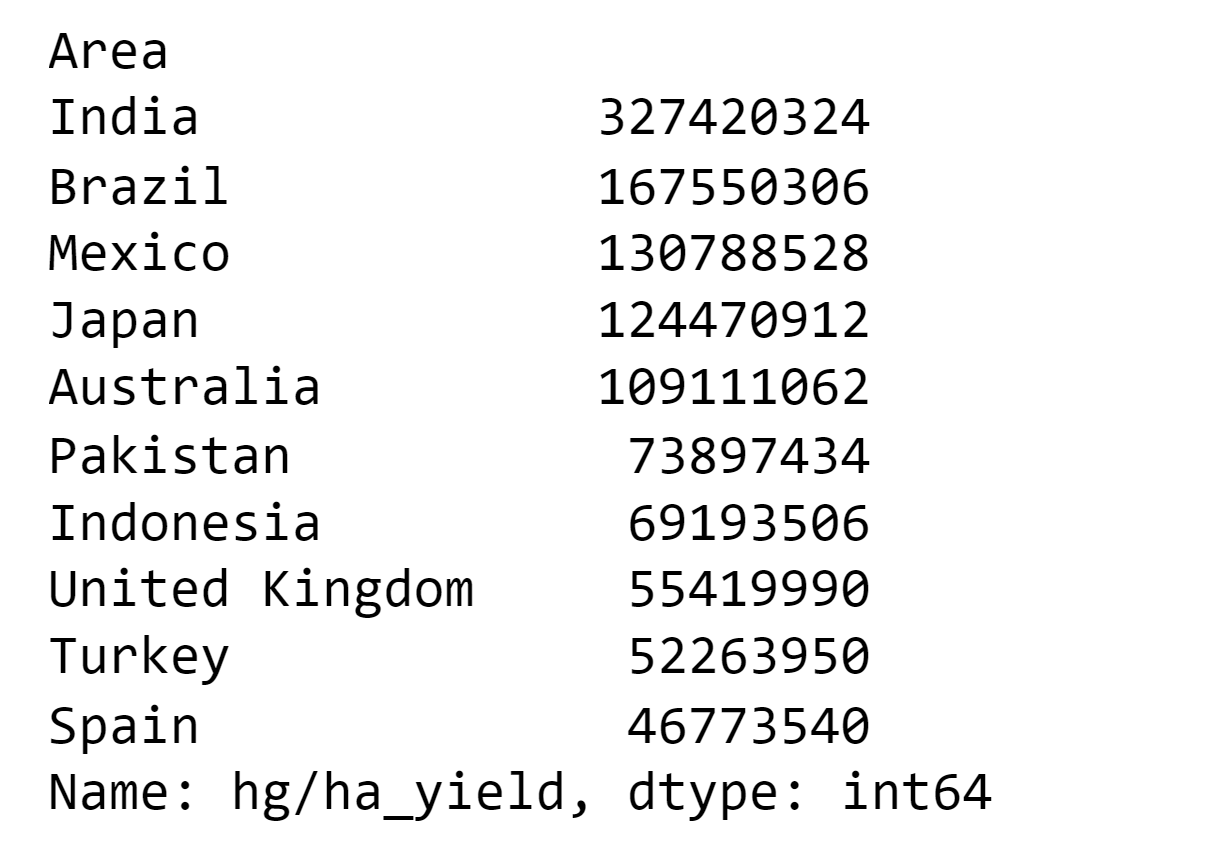
In the dataset, India has the greatest yield output. Items in the group by include: Output: 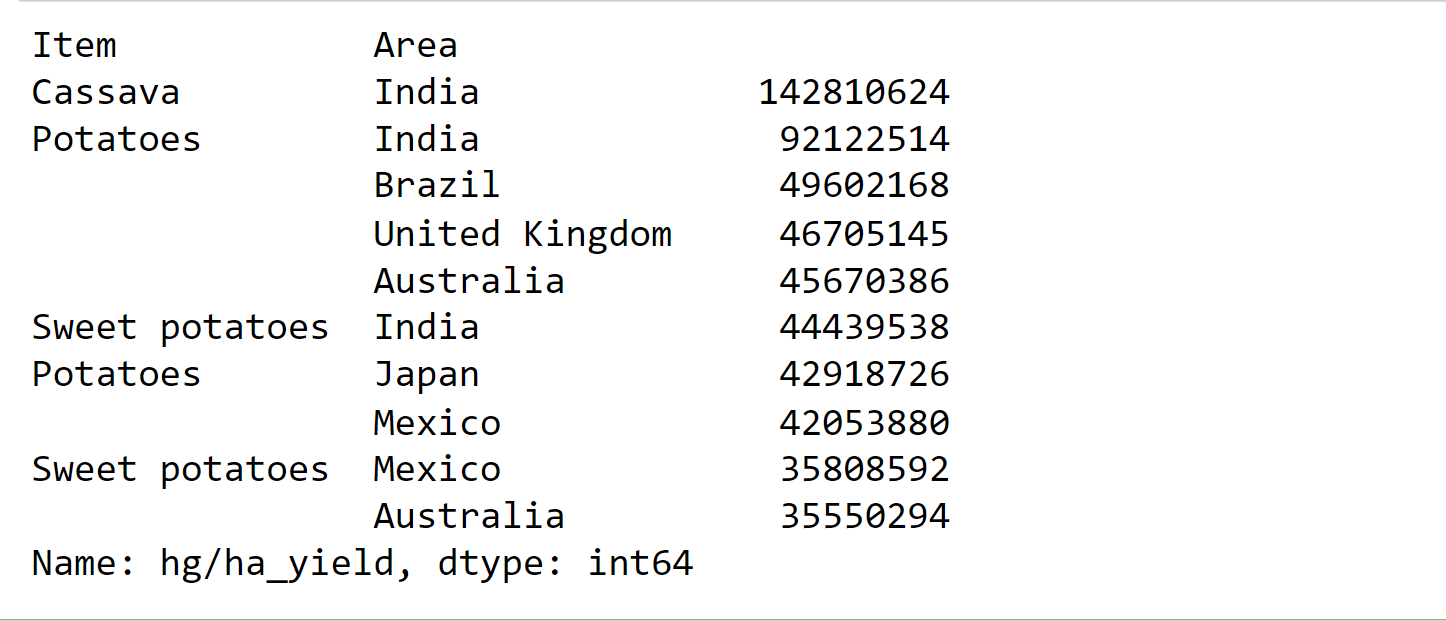
Cassava and potato output are the greatest in India. With the greatest percentage across four nations, potatoes appear to be the most prevalent crop in the sample. The final dataframe includes data for 101 nations spanning 23 years, from 1990 to 2013. Now, that we are looking at the links between the columns of the dataframe, displaying the correlation matrix as a heatmap is a handy approach to rapidly verify correlations among columns. Output: 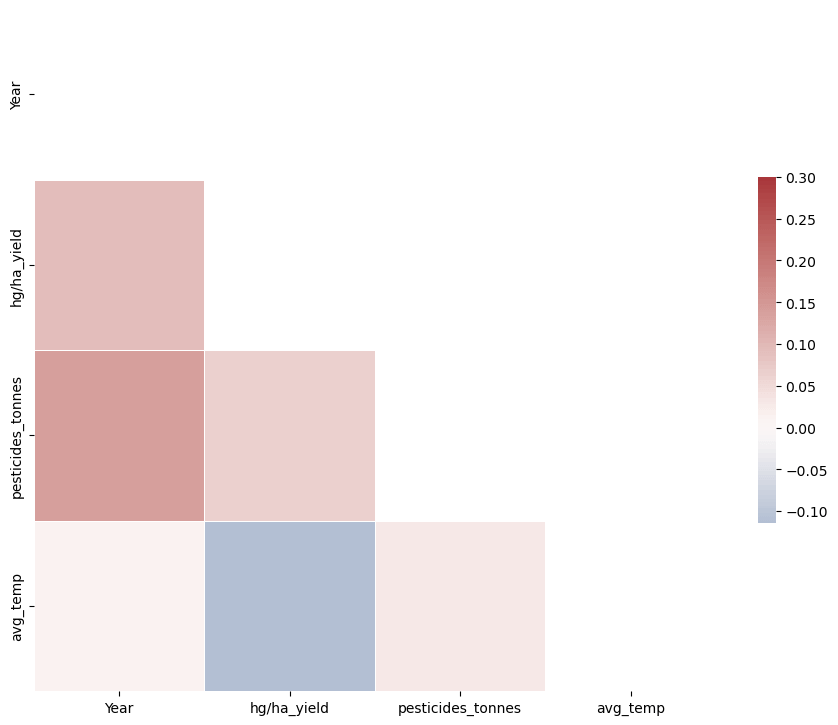
The above correlation map shows that there is no association between any of the data frame's columns. 4. Data PreprocessingData preprocessing is a method for transforming unclean data into clean data sets. In other words, anytime data is acquired from various sources; it is done so in a raw manner that makes analysis impossible. Output: 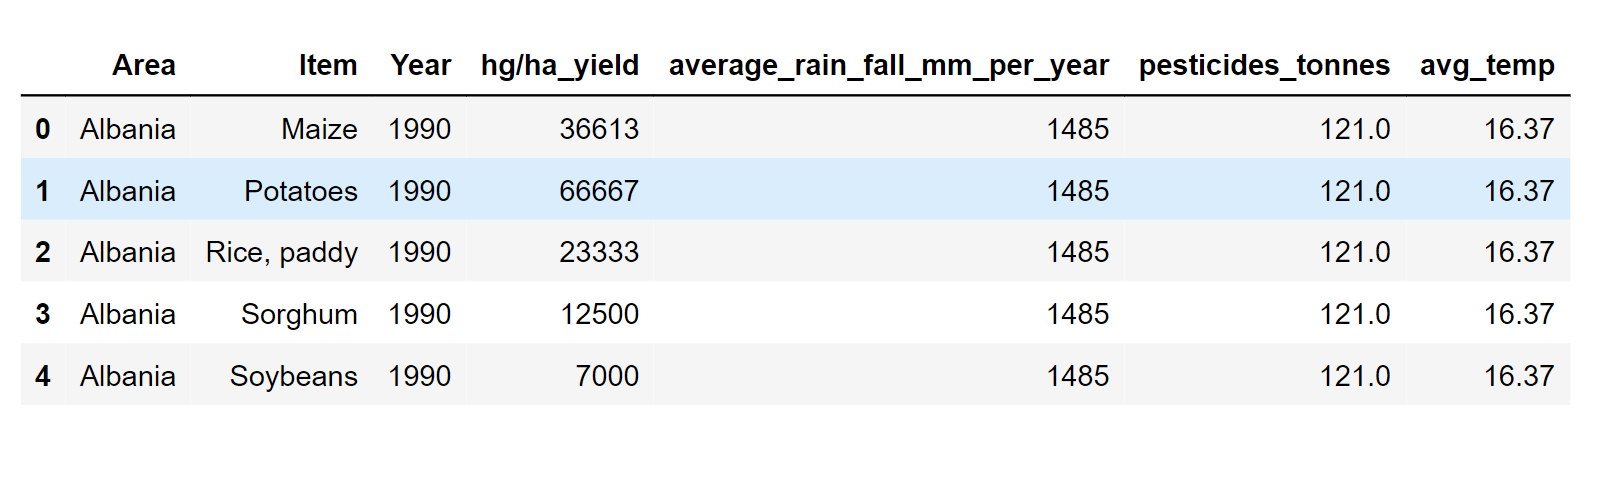
5. Encoding Categorical VariablesThe dataframe has two category columns, which are variables that have label values rather than numeric values. The range of available values is frequently constrained to a predetermined set, like in this example, the values for the items and nations. Several machine learning algorithms are unable to act directly on label data. They demand that all input and output variables be numbers. Thus, categorical data must be transformed into numerical data. One hot encoding method involves transforming categorical information into a format that may be given to ML algorithms to help them perform better at prediction. These two columns will be converted to a one-hot numeric array for that purpose using the One-Hot Encoding method. The Numerical Value of the element in the dataset is represented by the category value. For each category, a binary column will be created using this encoding, and the results are returned as a matrix. Output: 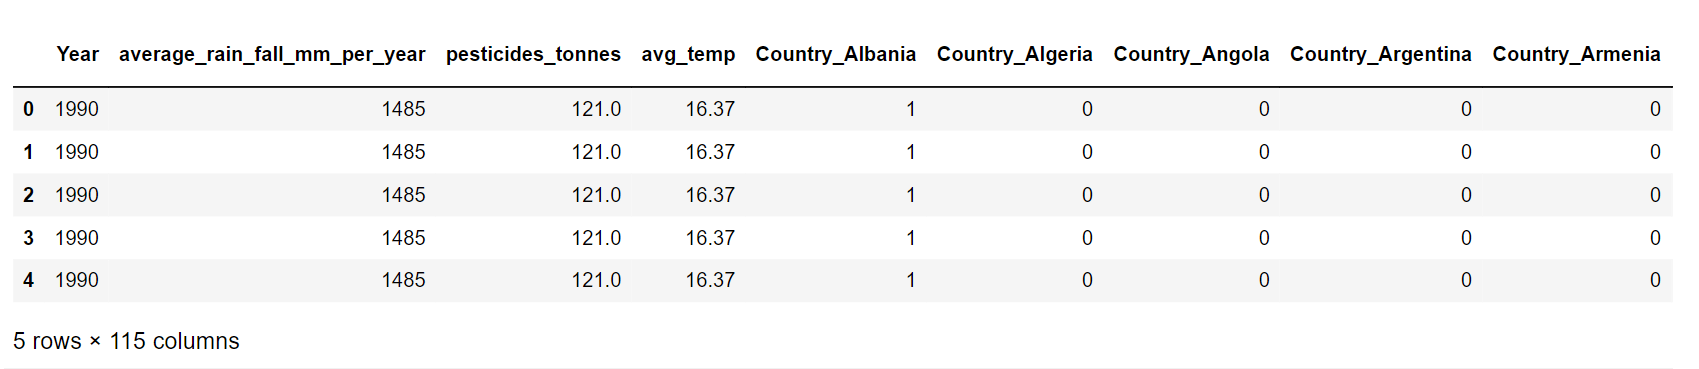
Output: 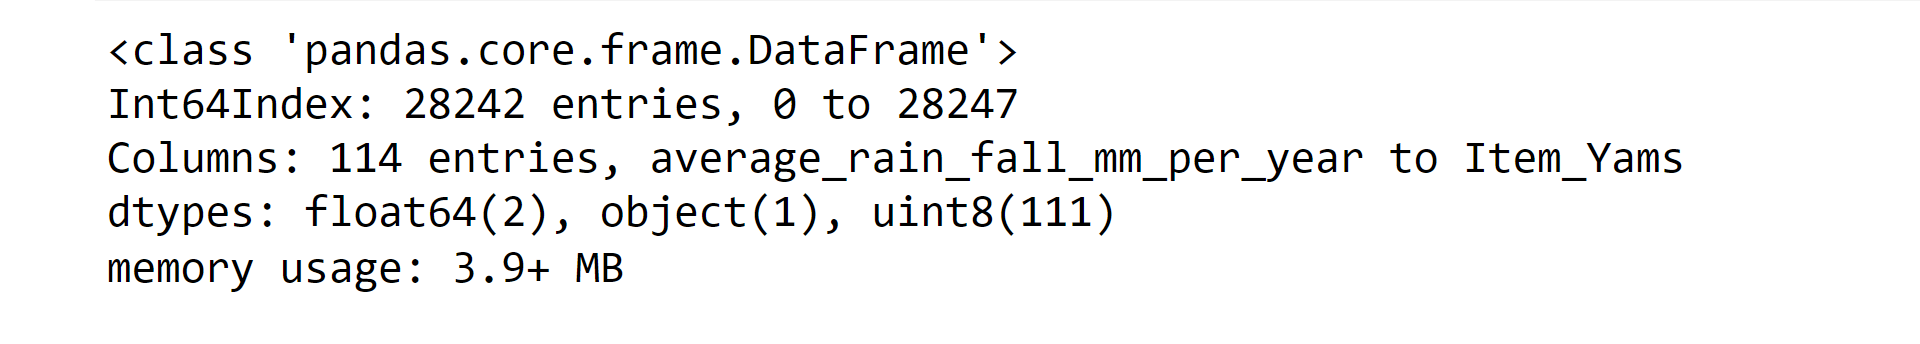
Output: 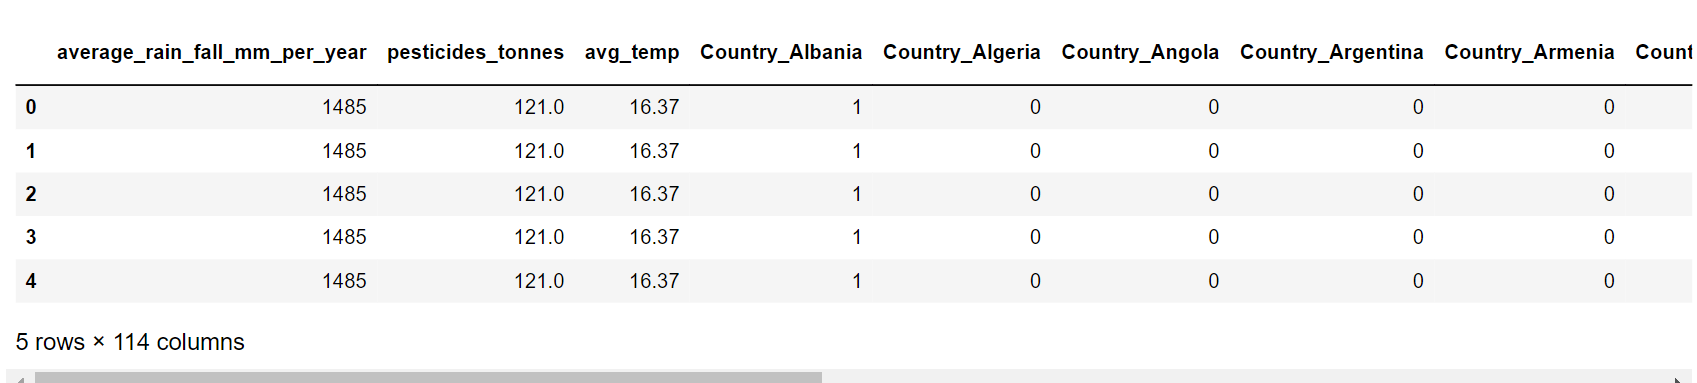
6. Scaling FeaturesThe dataset shown above has features with a wide range of magnitudes, units, and ranges. The magnitudes of the features will be far more important in distance computations than the magnitudes of the features. We must equalize the magnitudes of all characteristics in order to reduce this impact. Scaling can help achieve this. The resultant array will be like this after scaling all values in features and removing the year column: Output: 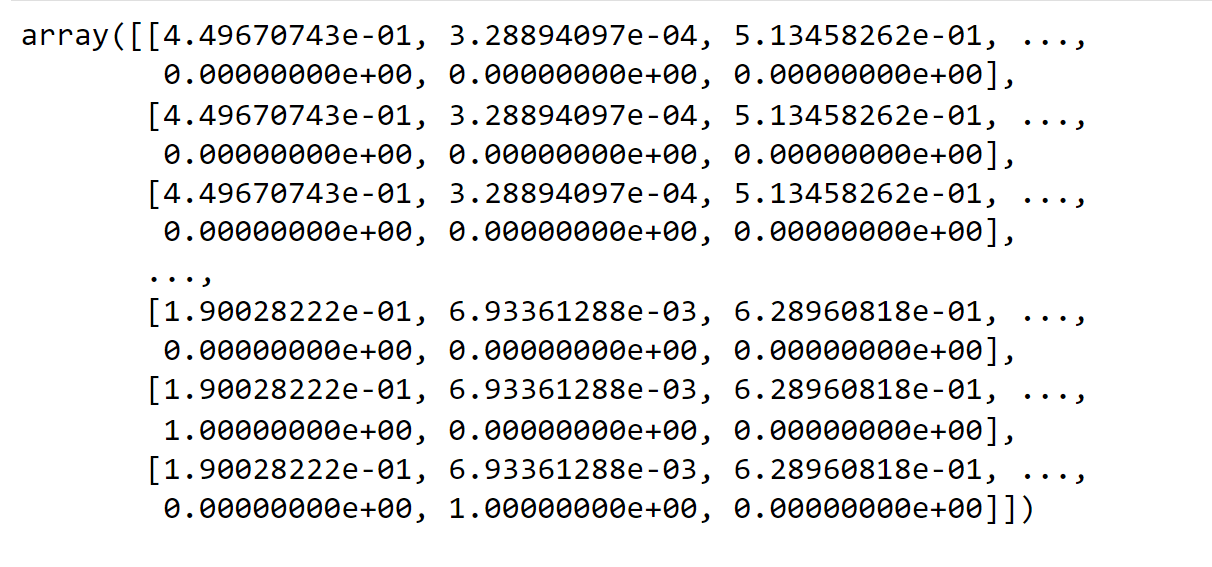
7. Training and Test DataThe training dataset and test dataset will be created from the original dataset. Inequality in the data is typically a result of the model's need for as many data points as feasible during training. For train/test, the typical percentages are 70/30 or 80/20. The first dataset used to teach a machine learning algorithm to learn and make accurate predictions is known as the training dataset. Seventy per cent of the dataset is a training dataset. Nevertheless, the test dataset is utilized to evaluate how well the ML algorithm was taught using the training dataset. Because the ML algorithm would already "know" the expected output, it would be pointless to test the method by simply reusing the training dataset. A test dataset makes up 30% of the dataset. 8. Comparing and Selecting modelsOutput: 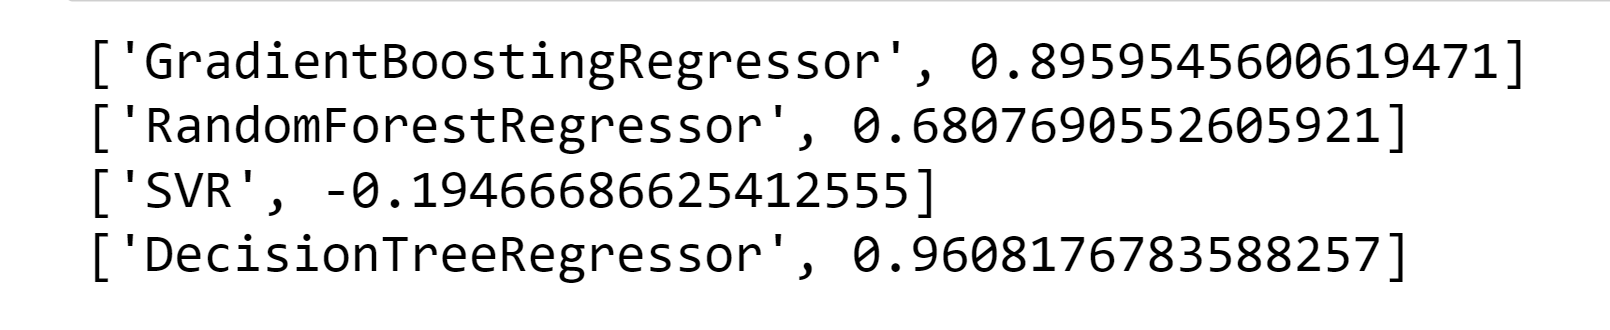
The R2 (coefficient of determination) regression score function, which will indicate the percentage of variance for items (crops) in the regression model, provides the foundation for the assessment measure. How closely words (data points) fit a curve or line is shown by the R2 score. R2 is a statistical index that ranges from 0 to 1, measuring how closely a regression line resembles the data it is fitted to. If it's 1, the model accurately predicts 100% of the variation in the data; if it's 0, the model accurately predicts 0% of the variance. According to the findings shown above, Gradient Boosting Regressor comes in second place with an R2 score of 96%, followed by Decision Tree Regressor. We'll also do the math. Nevertheless, adjusted R2 accounts for the number of terms in a model and still shows how well terms match a curve or line. Adjusted r-squared will drop when more pointless variables are included in a model. A higher number of meaningful variables will result in a higher adjusted r-squared. Adjusted R2 will never be more than R2 or the same as it. Output: 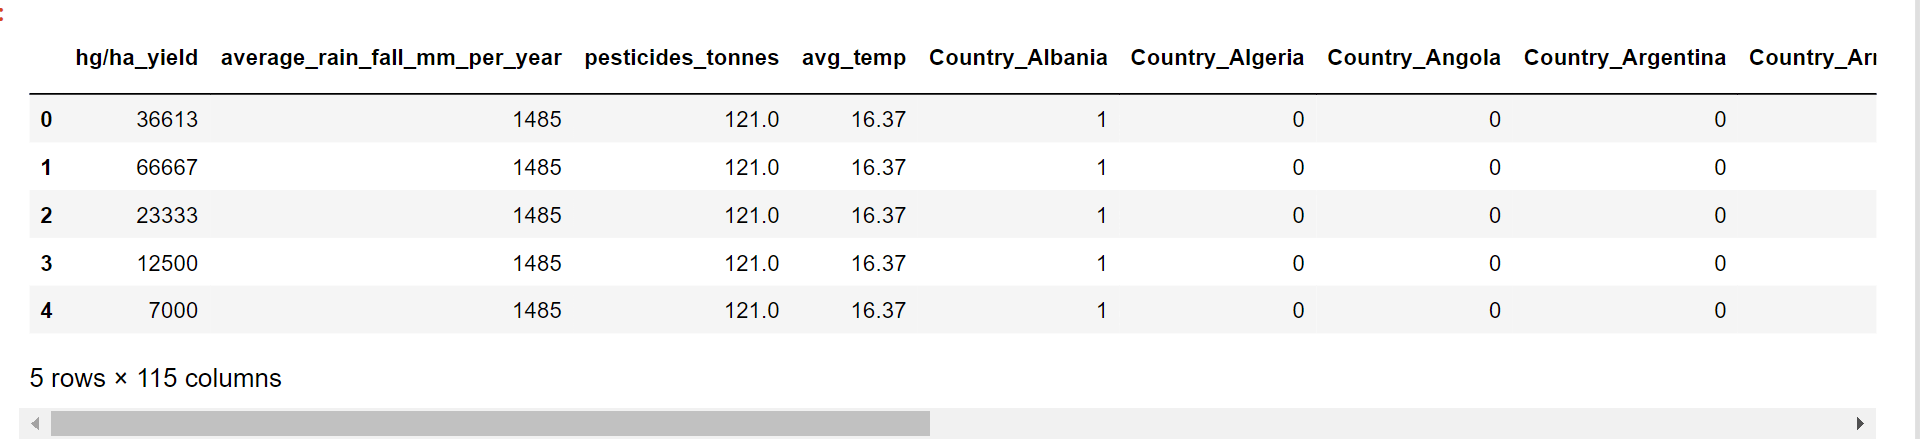
Output: 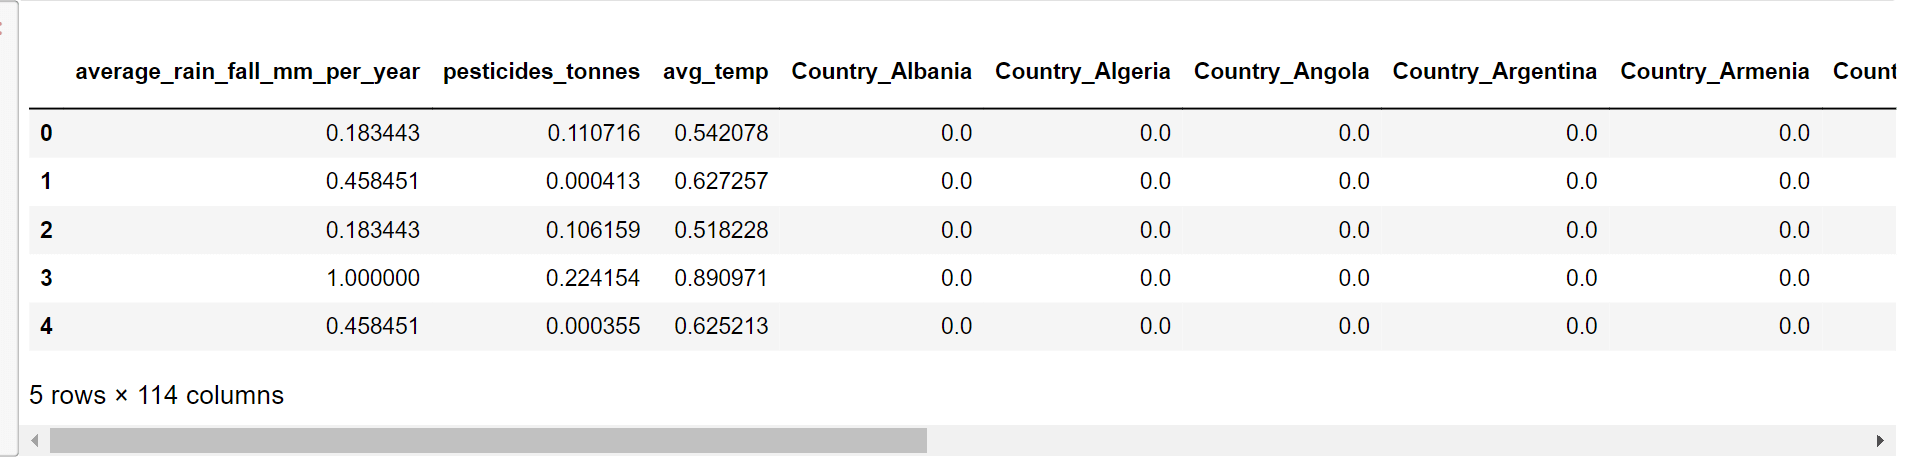
Output: 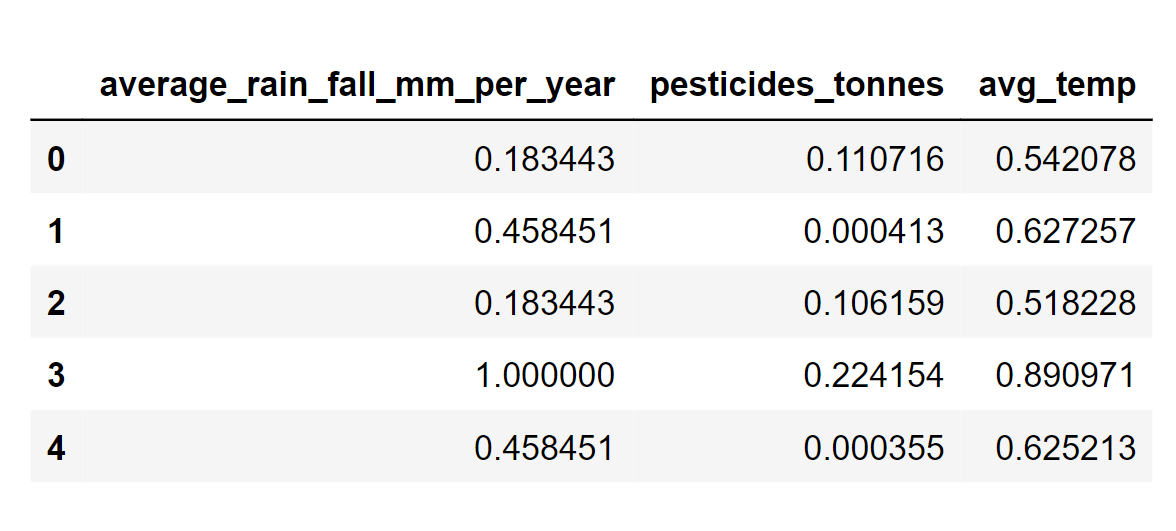
Output: 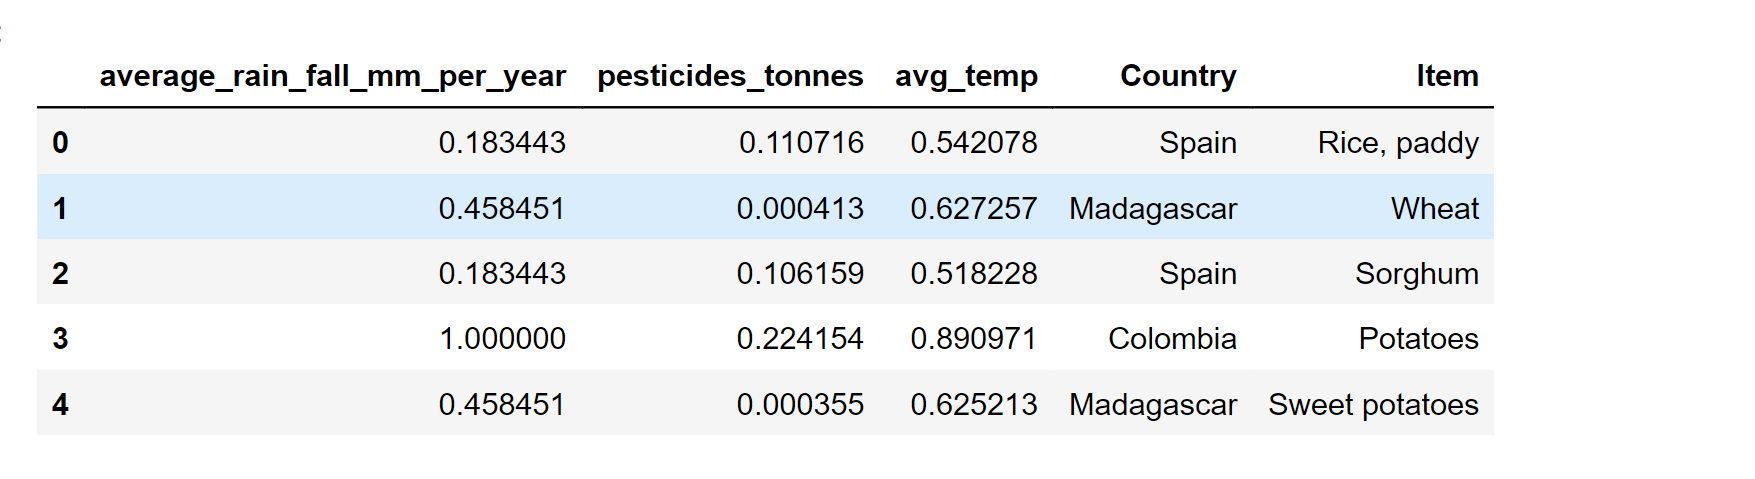
Output: 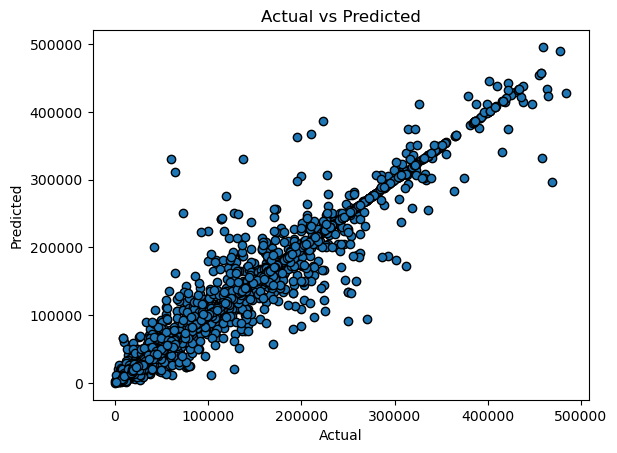
Model Results & ConclusionsOutput: 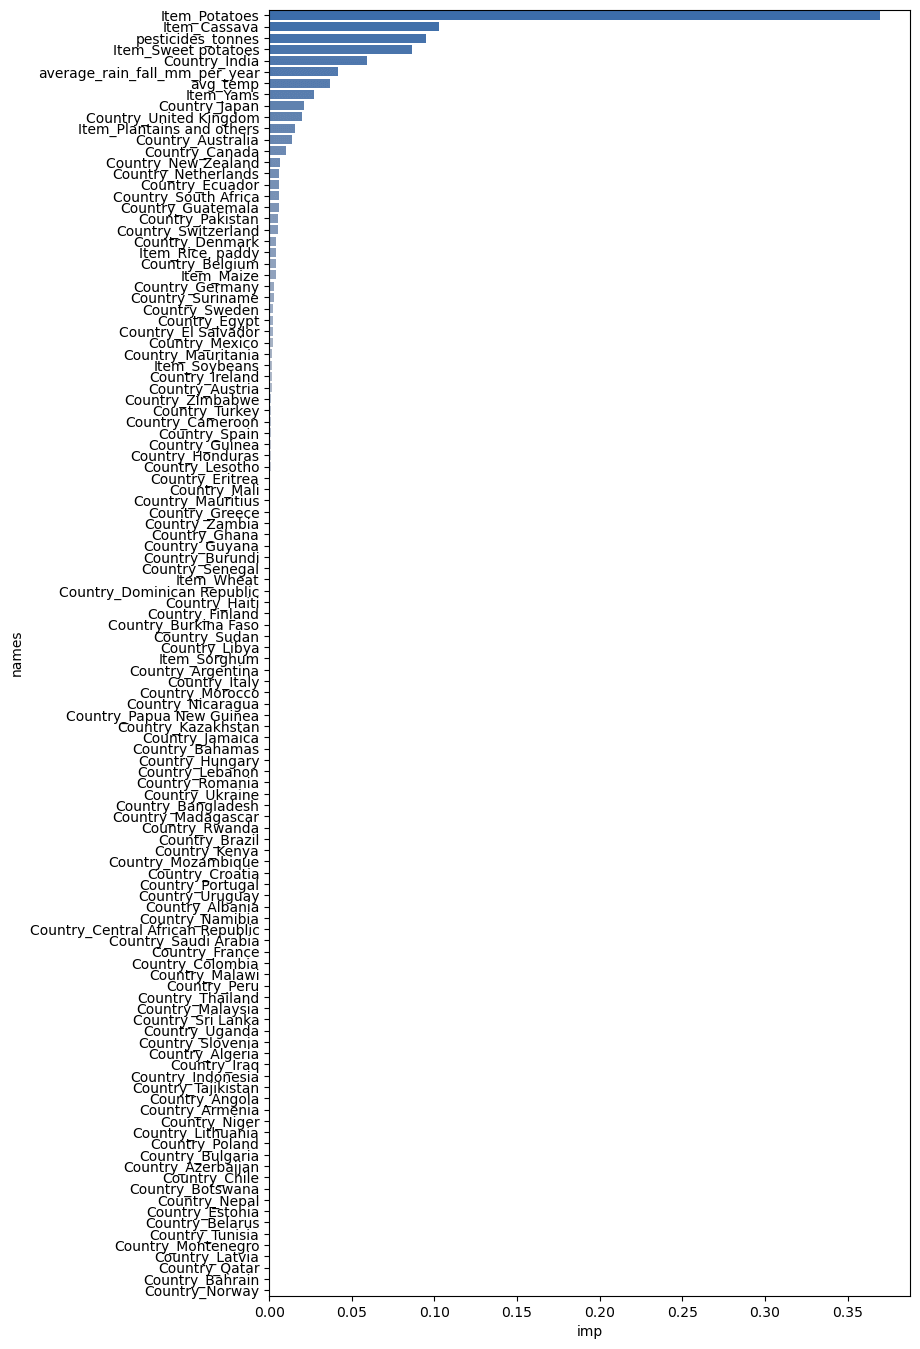
Obtaining only the top 7 characteristics in the model's significance list: Output: 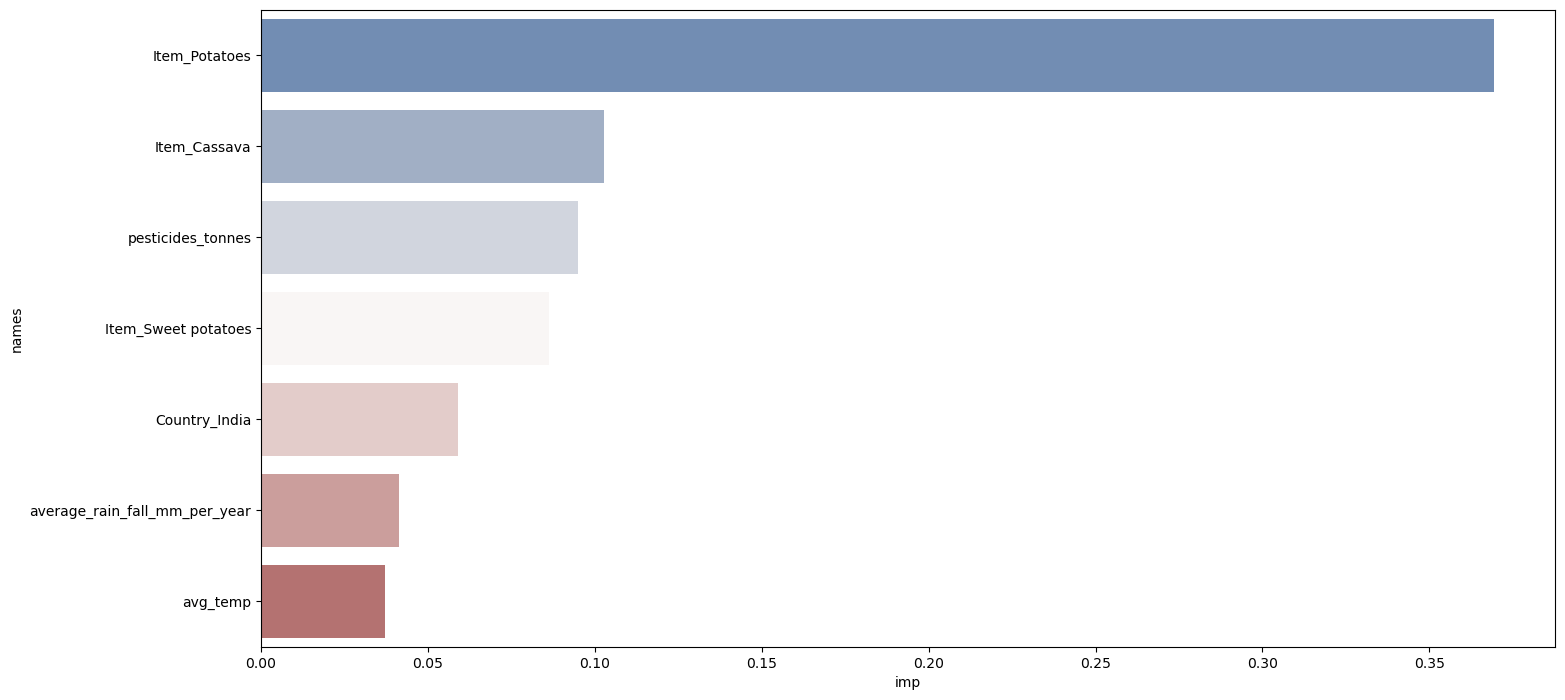
Output: 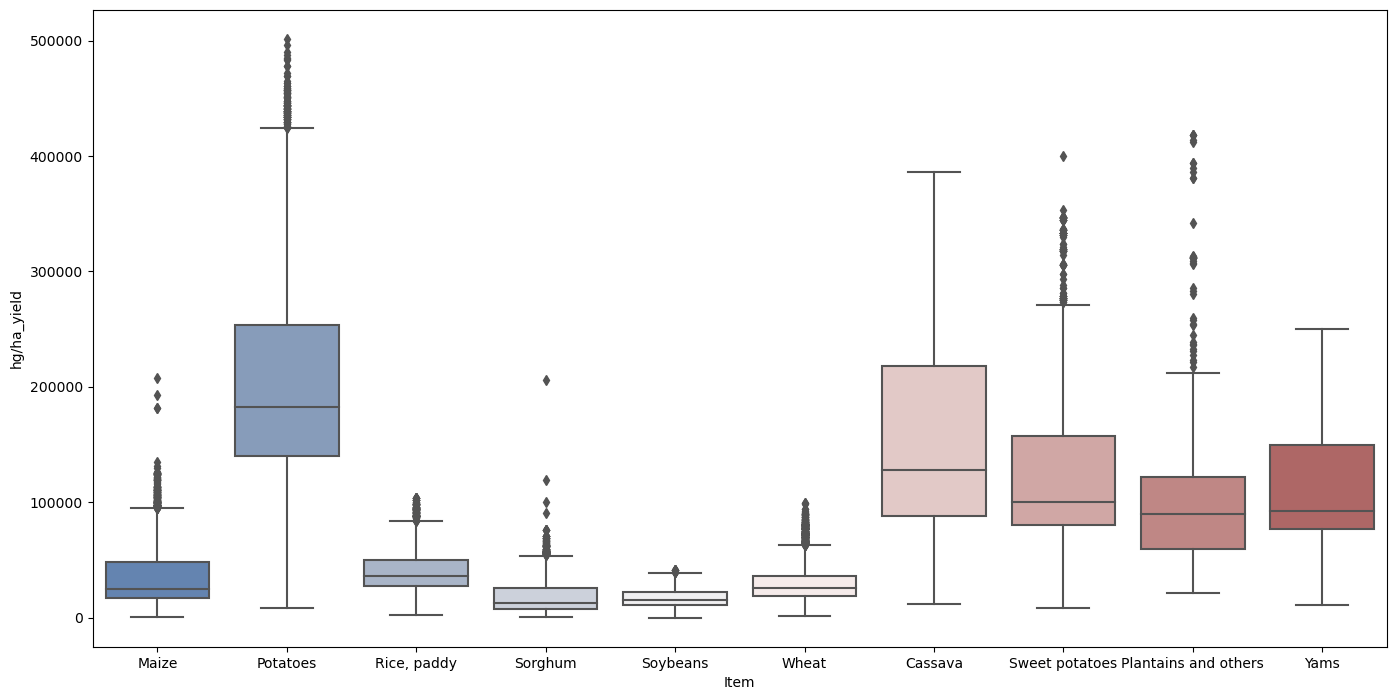
As potatoes are the highest crop in the dataset, they are given the most weight in the model's decision-making process. In the case of sweet potatoes, we observe some of the crops with the greatest feature value in the dataset, along with cassava, where the influence of pesticides is the third most important feature. Given that India has the most crops in the dataset, it makes sense if the crop is farmed there. Rainfall and temperature follow. The model's expectations for the predicted crop yield were all significantly impacted by these variables, proving that the original assumption about them was accurate. In conclusion, crop yield prediction using machine learning has the potential to revolutionize the agriculture industry. By providing more accurate predictions, improving decision-making, increasing efficiency, and enhancing sustainability, this technology can help farmers to achieve better yields and more profitable businesses. While there are some challenges to using machine learning for crop yield prediction, the benefits are clear, and we can expect to see continued advancements in this field in the years to come.
Next TopicData Visualization in Machine Learning
|
 For Videos Join Our Youtube Channel: Join Now
Feedback
- Send your Feedback to [email protected]
Help Others, Please Share


