Forest Cover Type Prediction Using Machine Learning

In the vast and diverse world of forests, each type of vegetation holds its own unique ecological importance. Being able to predict these types of vegetation is incredibly important for ecological conservation, managing natural resources, and deepening our understanding of the natural world. This is where machine learning comes in.
The task at hand involves decoding the forest's secrets - predicting what type of vegetation covers a particular area based on a wide range of environmental characteristics. Machine learning algorithms are like modern-day codebreakers in this endeavor, revealing the hidden patterns concealed within the vast amounts of data collected. These cover types can be anything from tall Spruce/Fir trees to hardy Krummholz, and each of them plays a vital role in the rich biodiversity of the ecosystem. In essence, machine learning helps us unveil the forest's mysteries and contributes to our efforts to protect and manage these vital natural resources.
Data Summary
The research area encompasses four wilderness regions situated in the northern Colorado Roosevelt National Forest. Each data point represents a 30m x 30m patch. The task involves predicting an integer classification for the forest cover type, which can fall into one of seven categories:
- Spruce/Fir
- Lodgepole Pine
- Ponderosa Pine
- Cottonwood/Willow
- Aspen
- Douglas-fir
- Krummholz
The training dataset, comprising 15,120 observations, provides both features and the Cover_Type. On the other hand, the test set contains only the features, requiring participants to predict the Cover_Type for each of the 565,892 observations in the test set.
Key Data Fields
- Elevation: Measurement in meters denoting height
- Aspect: Measurement in degrees azimuth representing direction
- Slope: Measurement in degrees indicating a gradient
- Horizontal_Distance_To_Hydrology: Measurement indicating the horizontal distance to the nearest water features
- Vertical_Distance_To_Hydrology: Measurement indicating the vertical distance to the nearest water features
- Horizontal_Distance_To_Roadways: Measurement indicating the horizontal distance to the nearest roadways
- Hillshade_9am, Hillshade_Noon, Hillshade_3pm: Measurements representing the hillshade index at 9 am, noon, and 3 pm during the summer solstice
- Horizontal_Distance_To_Fire_Points: Measurement indicating the horizontal distance to the nearest wildfire ignition points
- Wilderness_Area: Binary columns indicating the presence (1) or absence (0) of the wilderness area
- Soil_Type: Binary columns indicating the presence (1) or absence (0) of soil type
- Cover_Type: Designation denoting forest cover type (1-7)
The wilderness areas are categorized as follows:
- Rawah Wilderness Area
- Neota Wilderness Area
- Comanche Peak Wilderness Area
- Cache la Poudre Wilderness Area
The soil types are:
- Cathedral family - Rock outcrop complex, extremely stony.
- Vanet - Ratake family complex, is very stony.
- Haploborolis - Rock outcrop complex, rubbly.
- Ratake family - Rock outcrop complex, rubbly.
- Vanet family - Rock outcrop complex complex, rubbly.
- Vanet - Wetmore families - Rock outcrop complex, stony.
- Gothic family.
- Supervisor - Limber families complex.
- Troutville family- is very stony.
- Bullwark - Catamount families - Rock outcrop complex, rubbly.
- Bullwark - Catamount families - Rock land complex, rubbly.
- Legault family - Rock land complex, stony.
- Catamount Family - Rock land - Bullwark family complex, rubbly.
- Pachic Argiborolis - Aquolis complex.
- unspecified in the USFS Soil and ELU Survey.
- Cryaquolis - Cryoborolis complex.
- Gateview family - Cryaquolis complex.
- Rogert family, very stony.
- Typic Cryaquolis - Borohemists complex.
- Typic Cryaquepts - Typic Cryaquolls complex.
- Typic Cryaquolls - Leighcan family, till substratum complex.
- Leighcan family, till substratum, extremely bouldery.
- Leighcan family, till substratum - Typic Cryaquolls complex.
- Leighcan family, extremely stony.
- Leighcan family, warm, extremely stony.
- Granile - Catamount families complex, very stony.
- Leighcan family, warm - Rock outcrop complex, extremely stony.
- Leighcan family - Rock outcrop complex, extremely stony.
- Como - Legault family complex, extremely stony.
- Como family - Rock land - Legault family complex, extremely stony.
- Leighcan - Catamount families complex, extremely stony.
- Catamount family - Rock outcrop - Leighcan family complex, extremely stony.
- Leighcan - Catamount families - Rock outcrop complex, extremely stony.
- Cryorthents - Rock land complex, extremely stony.
- Cryumbrepts - Rock outcrop - Cryaquepts complex.
- Bross family - Rock land - Cryumbrepts complex, extremely stony.
- Rock outcrop - Cryumbrepts - Cryorthents complex, extremely stony.
- Leighcan - Moran families - Cryaquolls complex, extremely stony.
- Moran family - Cryorthents - Leighcan family complex, extremely stony.
- 40 Moran family - Cryorthents - Rock land complex, extremely stony.
Now, we will try to build a model that can predict the cover type of a forest.
Python Code to Predict Forest Cover Type using ML
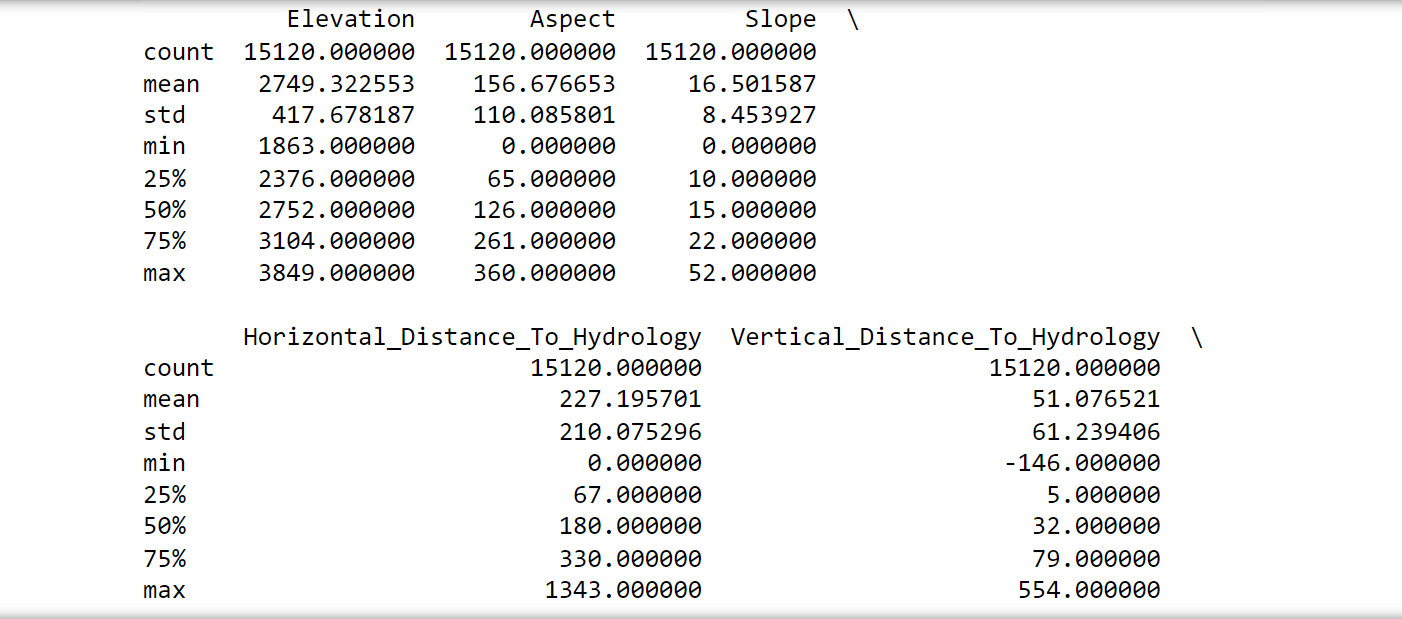
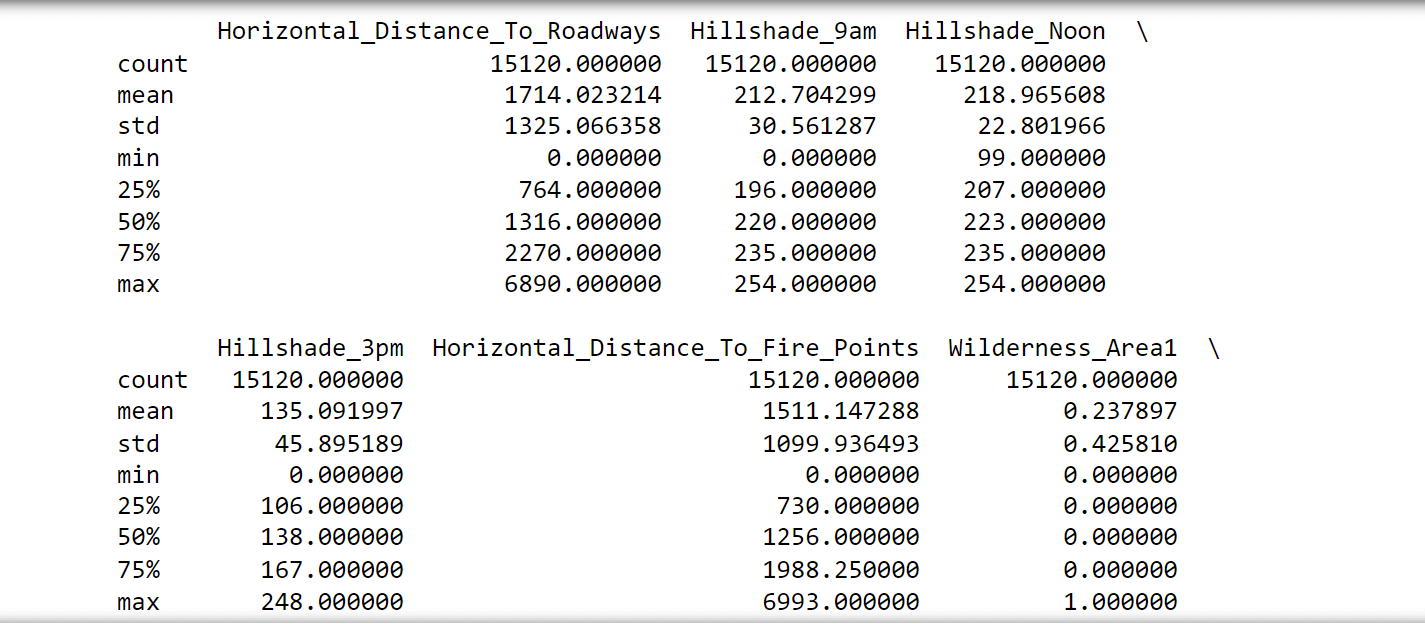
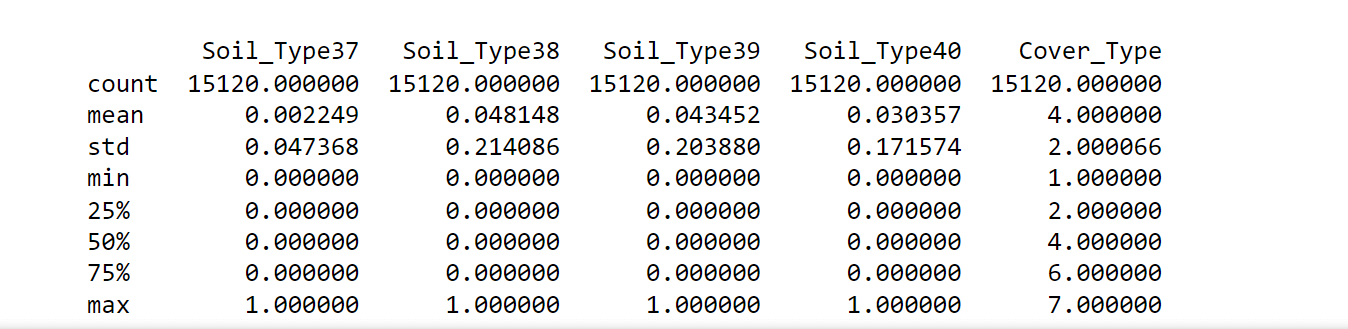
- Statistics of the Dataset
It refers to a summary or description of key numerical characteristics and properties of a dataset.
Output:

It's clear that there are 15,120 instances, each with 55 attributes. We can say that the data has been successfully loaded since the dimensions align with the data description
Output:
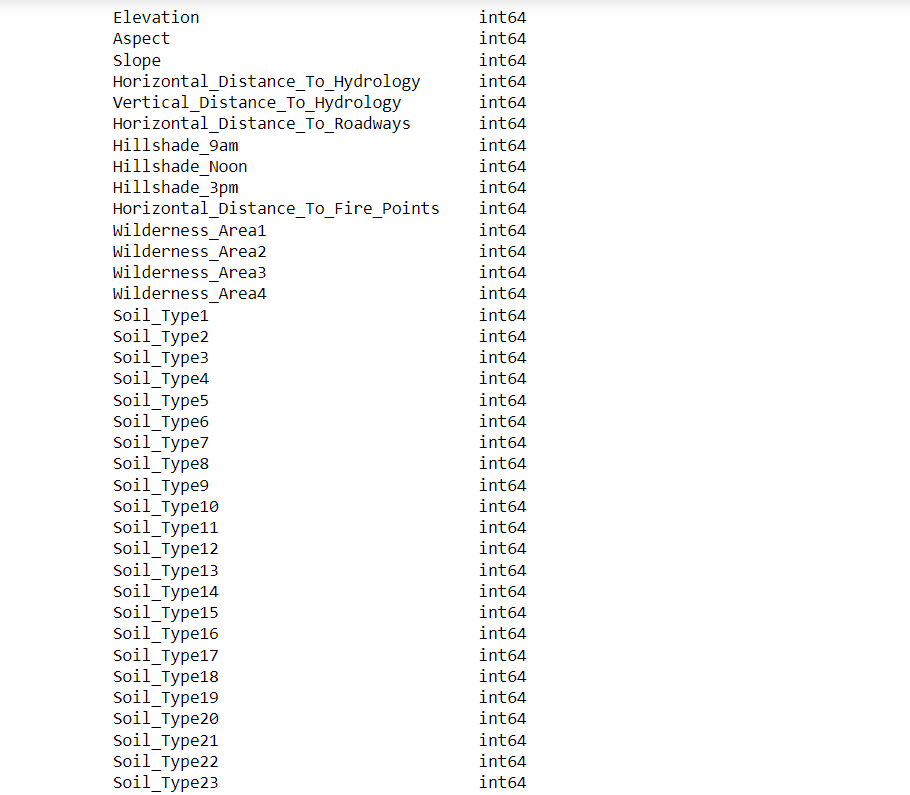
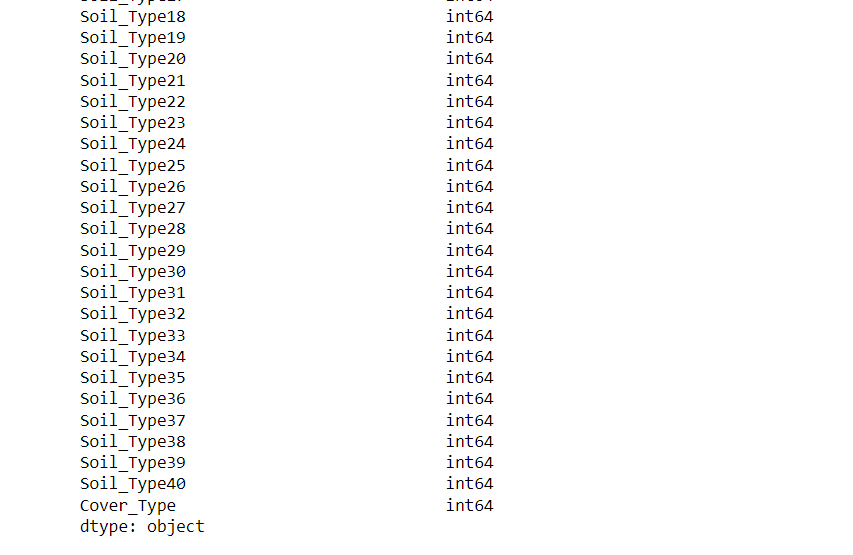
Data types of all attributes have been inferred as int64.
Output:
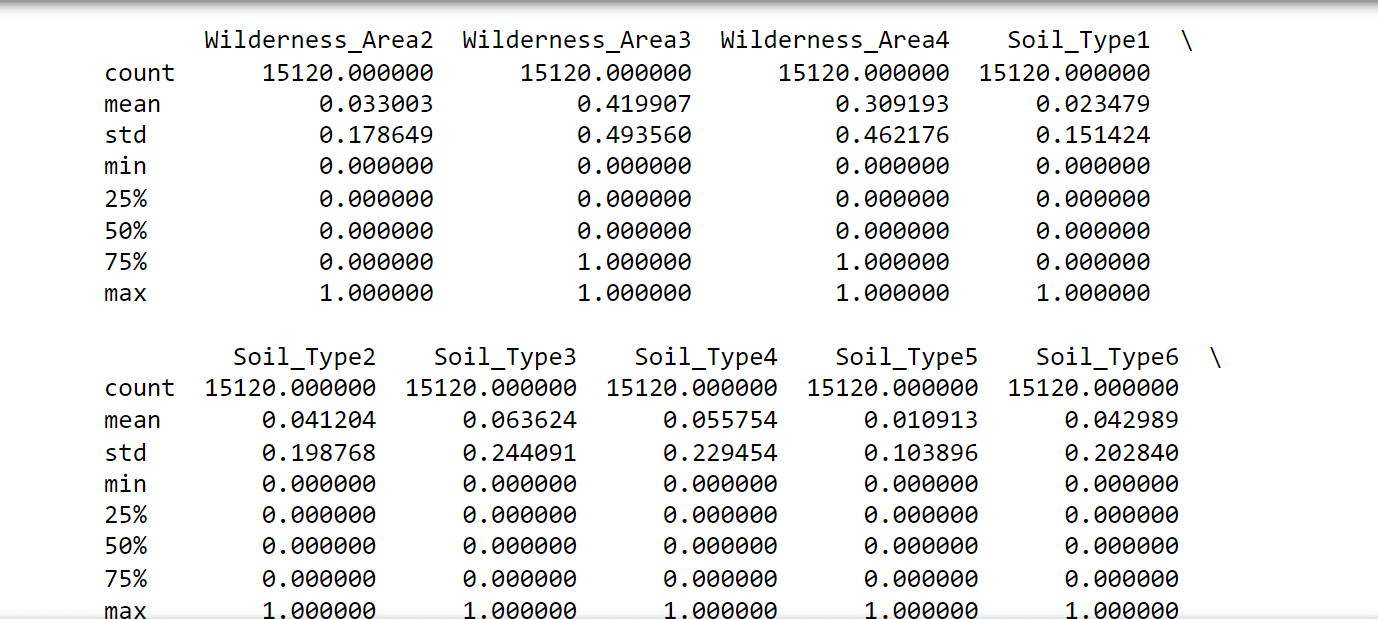
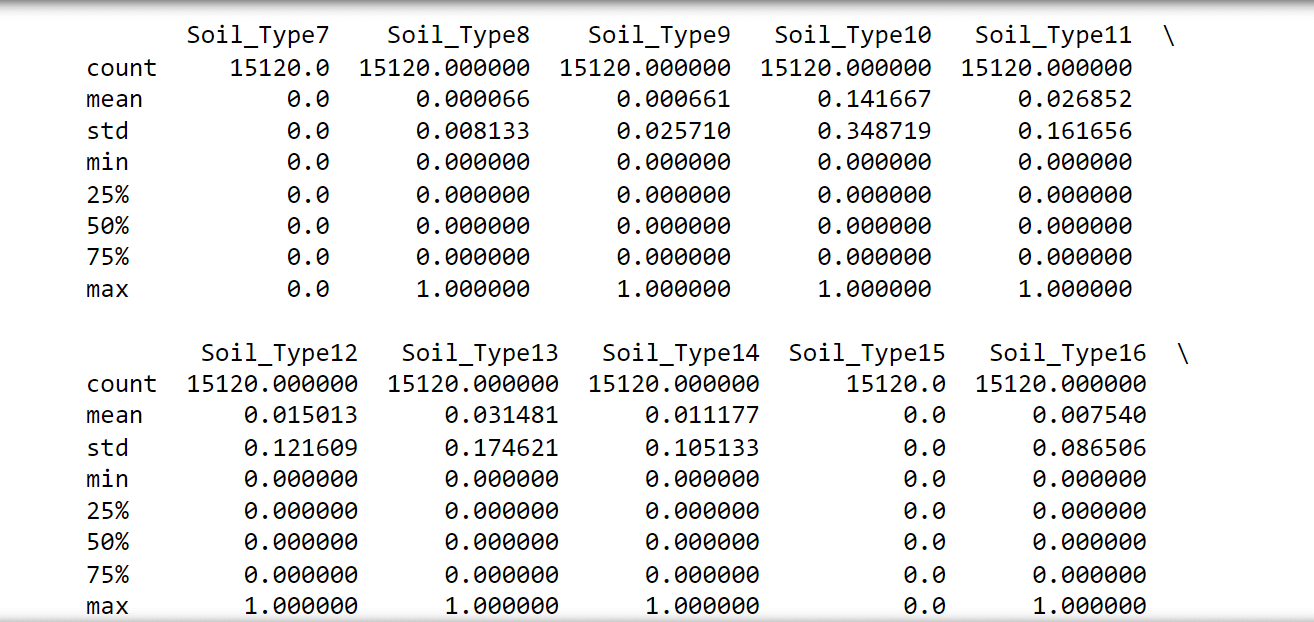
The following observations were noticed:
- No attributes have missing values since the count is consistent at 15,120 for all attributes. Thus, all rows can be utilized.
- There are negative values in the 'Vertical_Distance_To_Hydrology,' which makes certain tests like chi-squared inapplicable.
- Both 'Wilderness_Area' and 'Soil_Type' have undergone one-hot encoding. Therefore, they could potentially be converted back for specific analyses."Attributes 'Soil_Type7' and 'Soil_Type15' can be excluded as they remain constant.
- Not all attributes share the same scales, implying that rescaling and standardization might be necessary for certain algorithms.
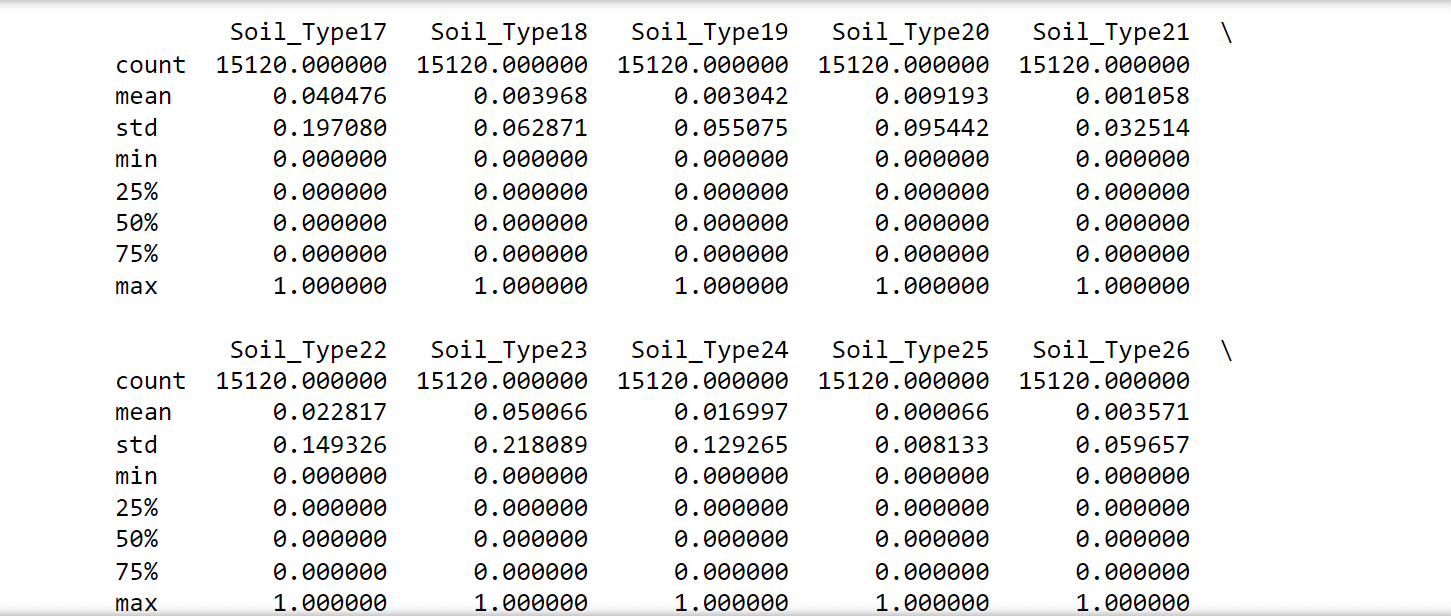
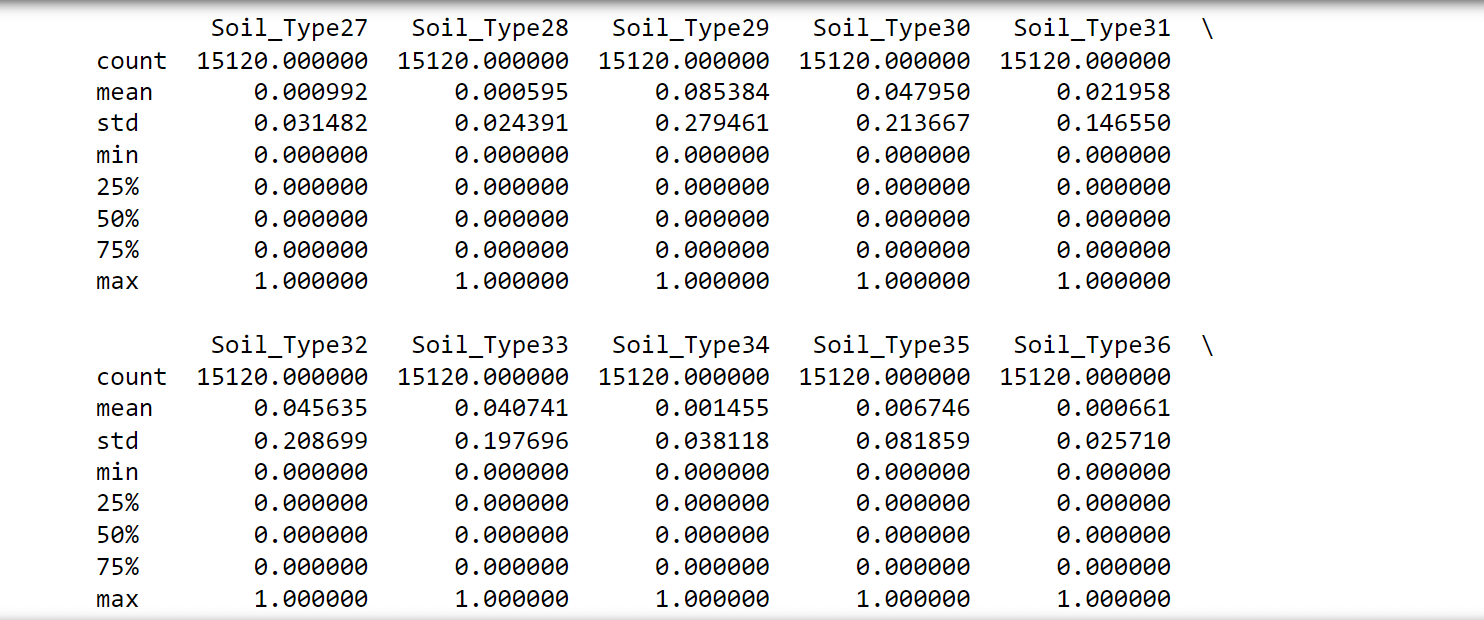
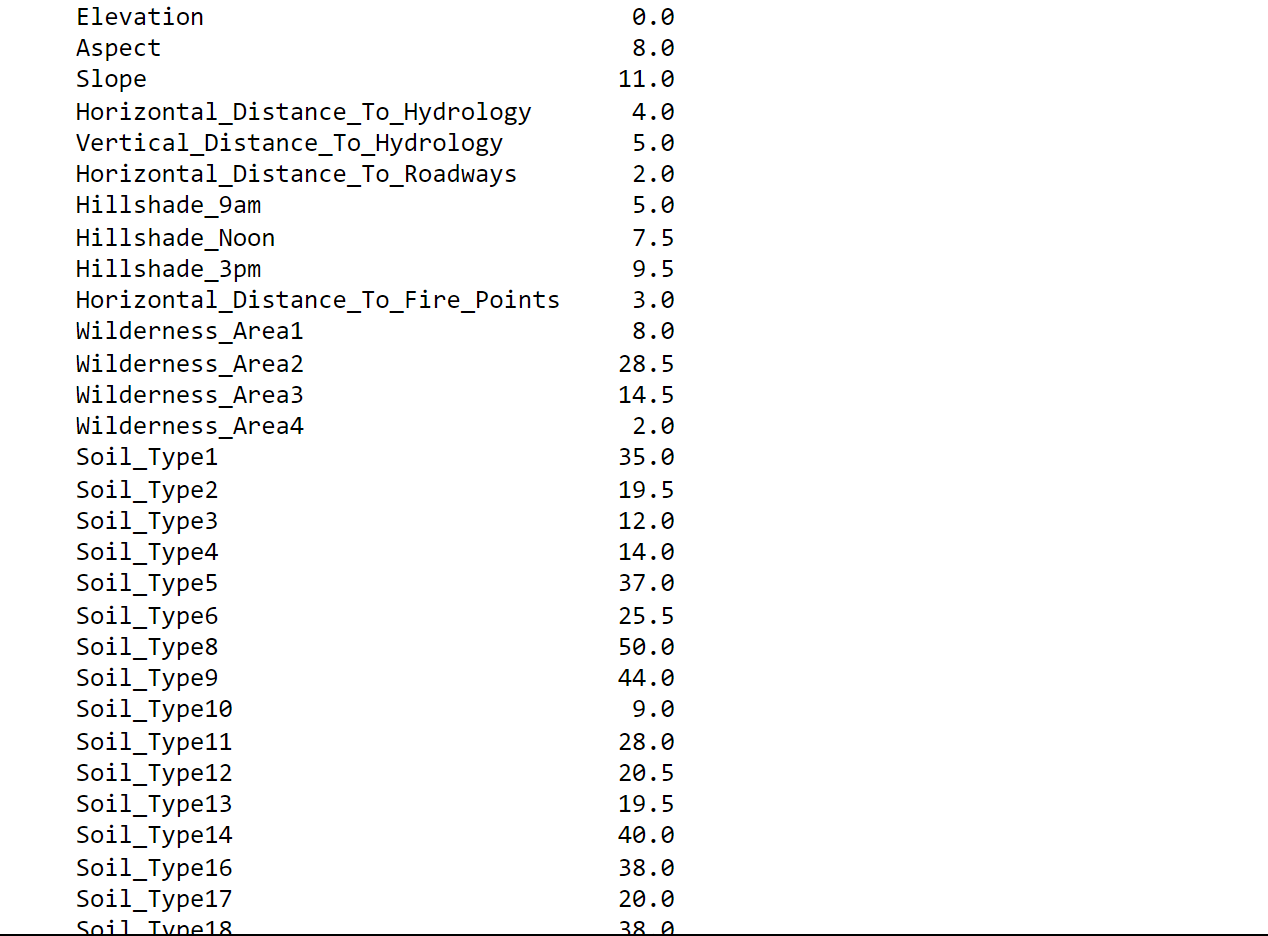
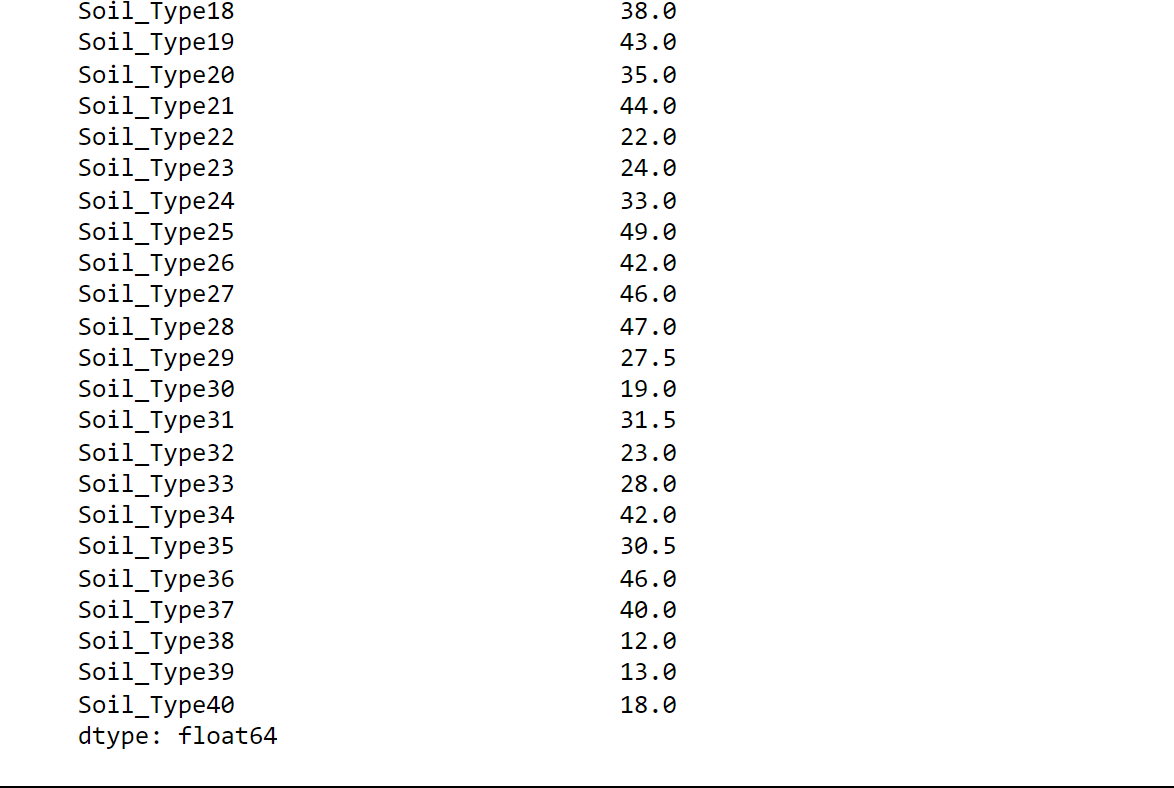
Output:
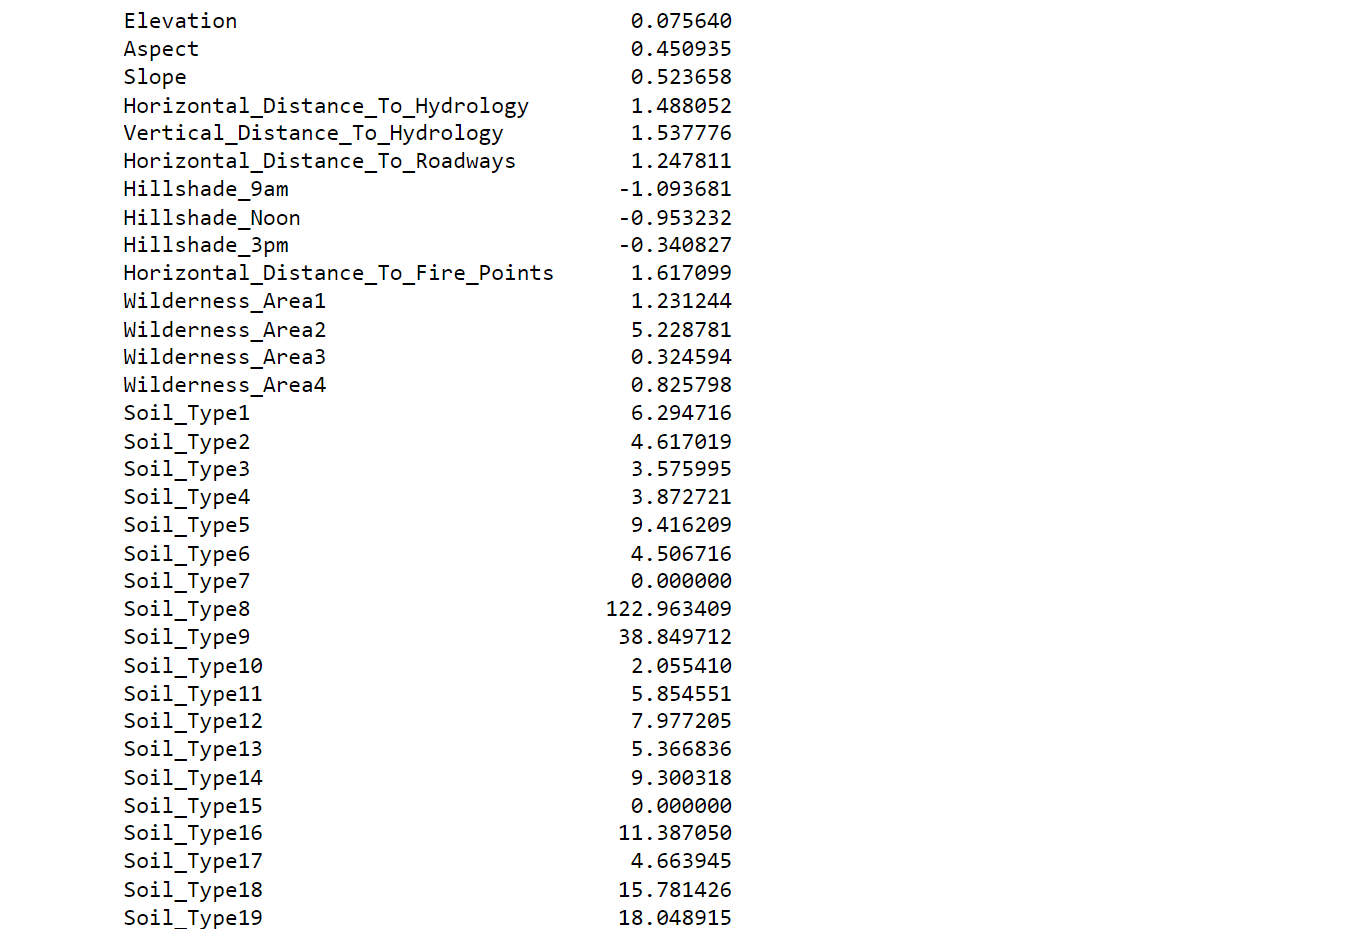
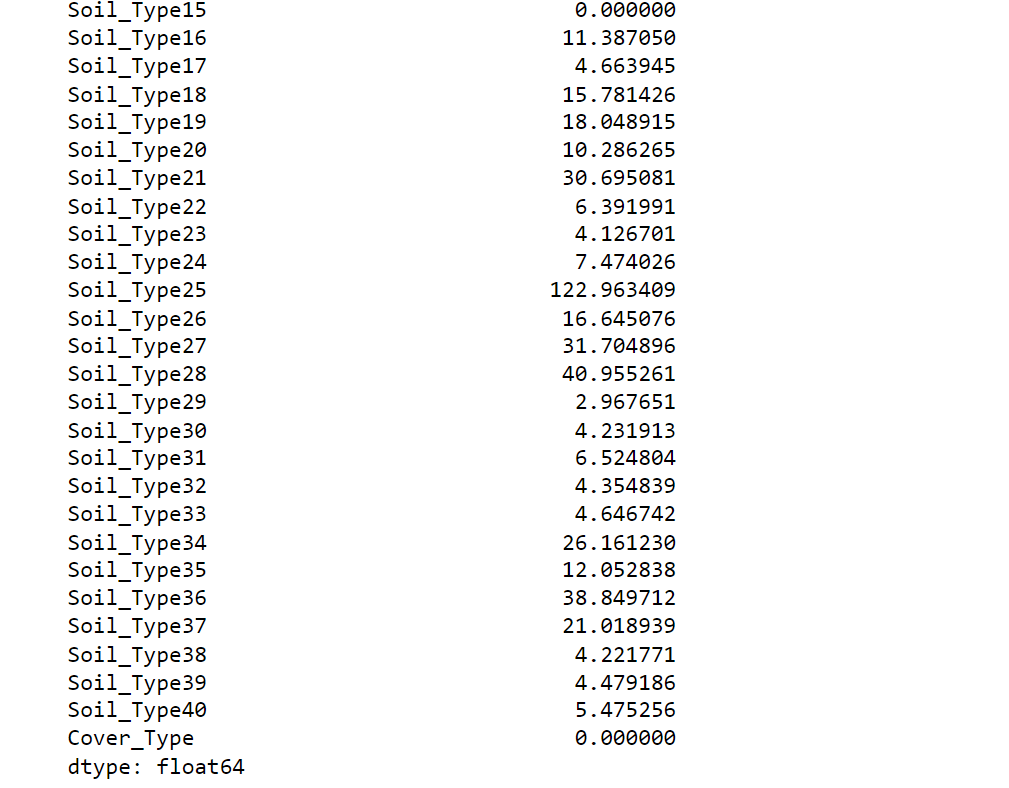
Here, Values approaching zero indicate minimal skewness. Also several attributes within 'Soil_Type' exhibit significant skewness. Correcting this skewness could potentially benefit certain algorithms.
Output:
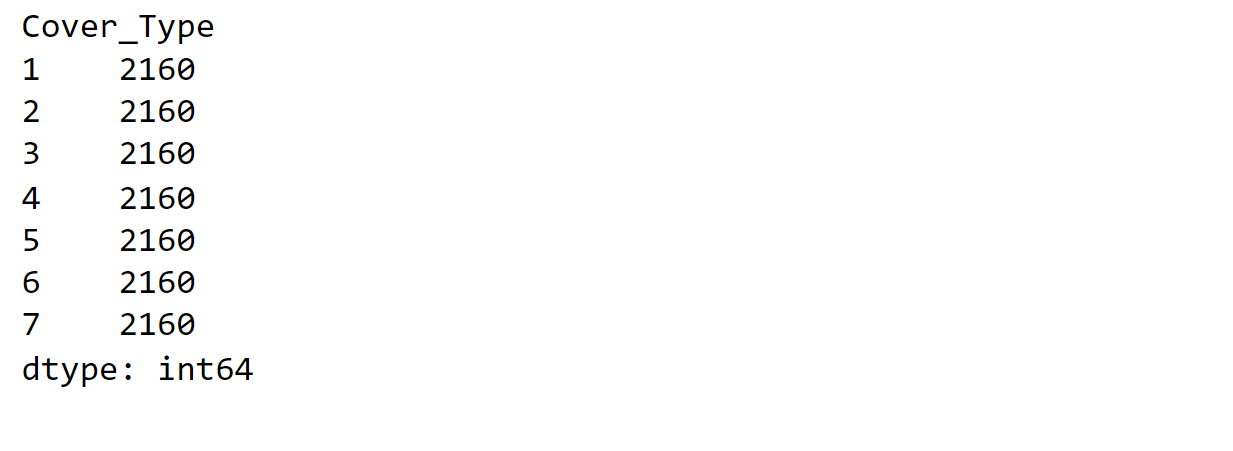
We observe that each class is equally represented, indicating no need for class rebalancing.
Here we will interact with the dataset with regards to correlation and scatter plot.
Correlation
Output:
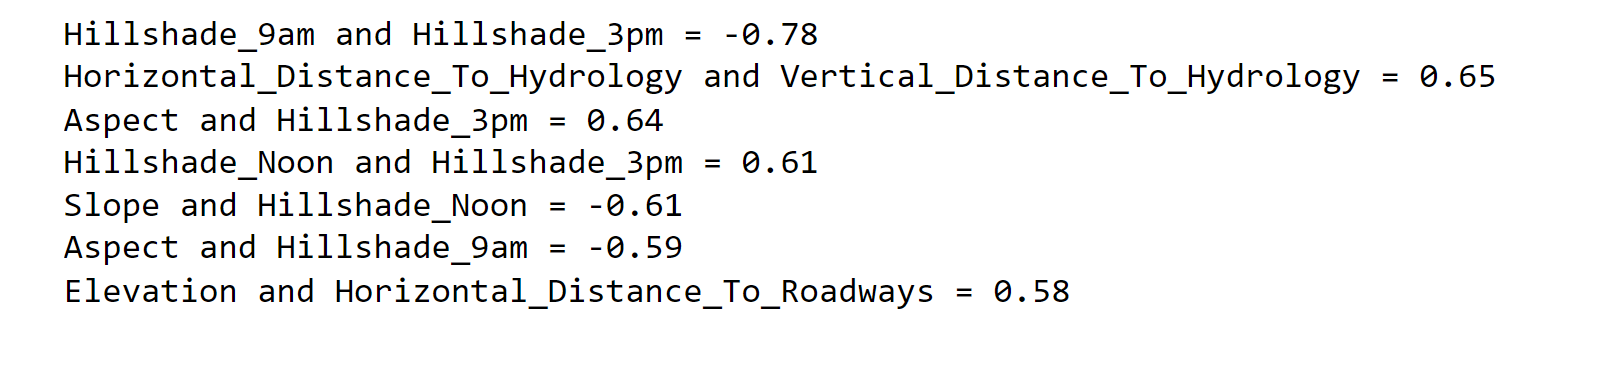
Here, correlations provide insights into how different environmental variables are related to each other,
Scatter Plot
Output:
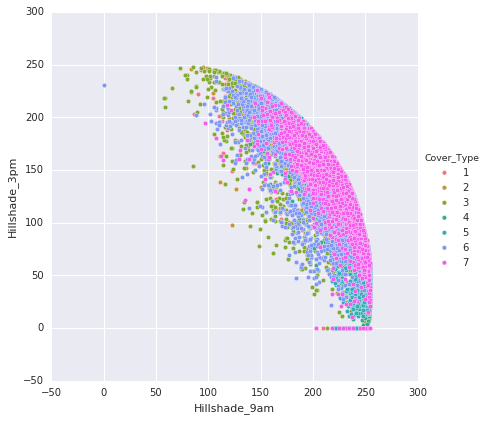
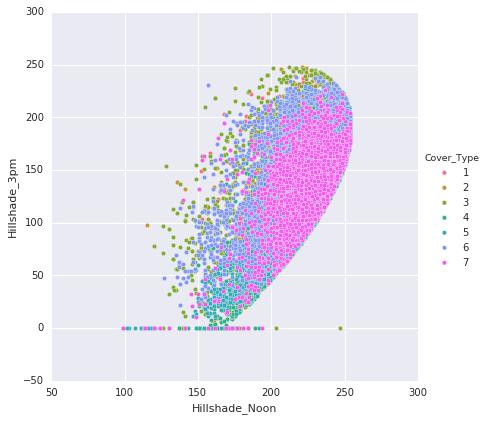
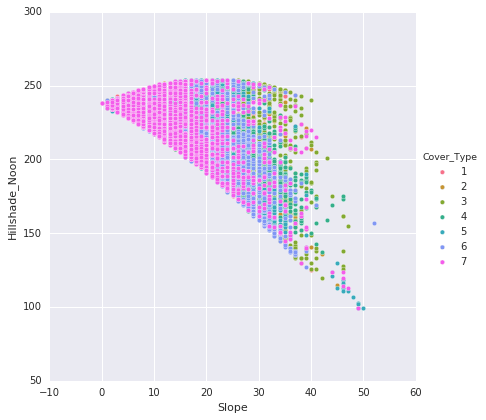
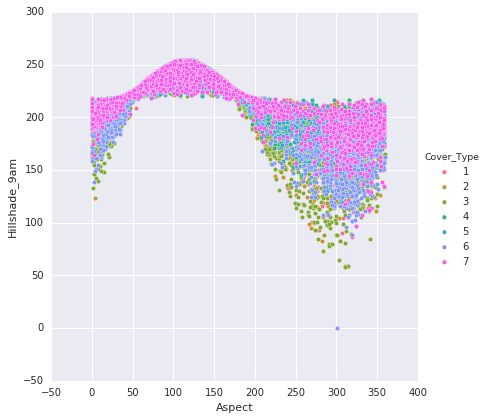
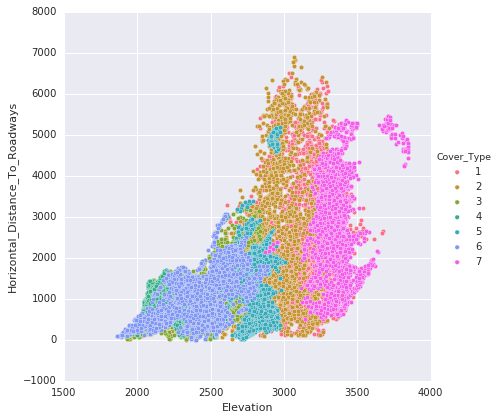
Following are the points that are noted from the above plots:
- The plots illustrate the classification of data points into their respective classes. There is some overlap in the distribution of classes within the plots.
- The hillshade patterns exhibit appealing ellipsoid shapes when compared to each other.
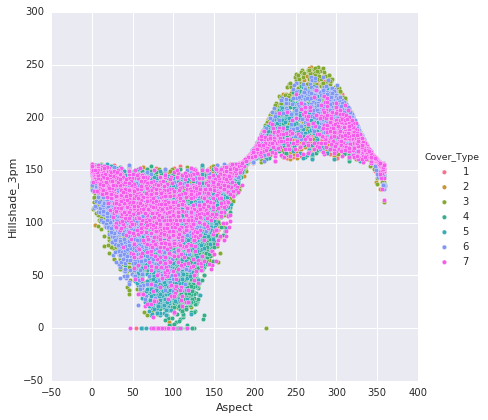
- The 'Aspect' and 'Hillshades' attributes together create a sigmoid pattern.
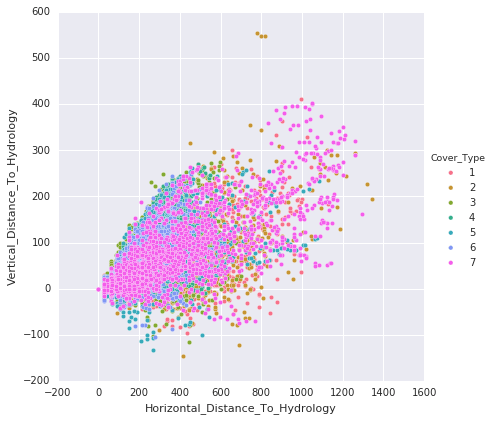
Horizontal and vertical distances to hydrology display an almost linear relationship.
Now, we will visualize our data with a Violen Plot and further, we will group one hot attribute.
Box & Density Plot
Output:
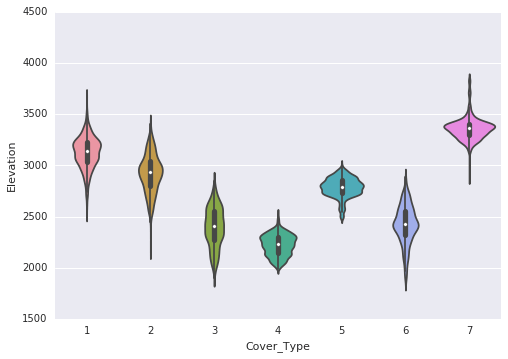
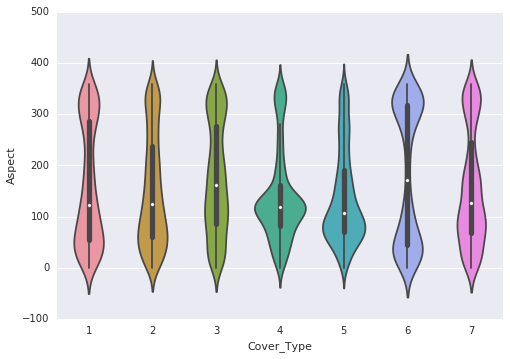
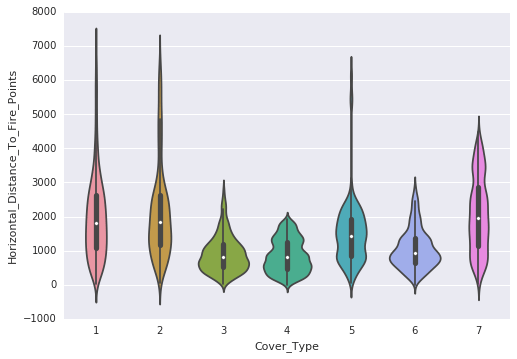
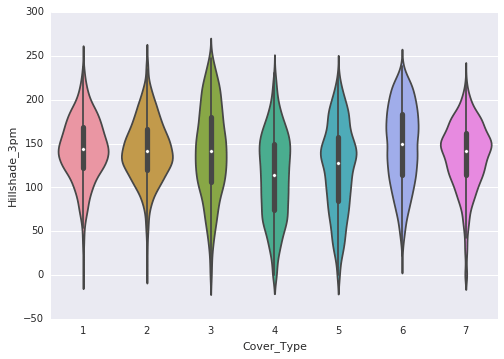
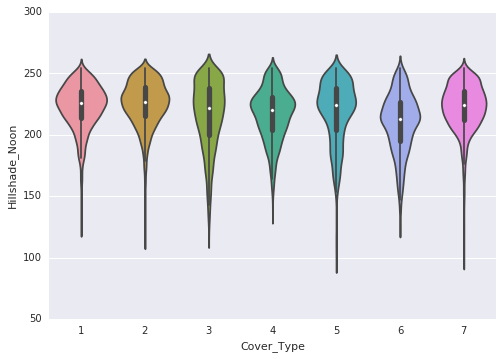
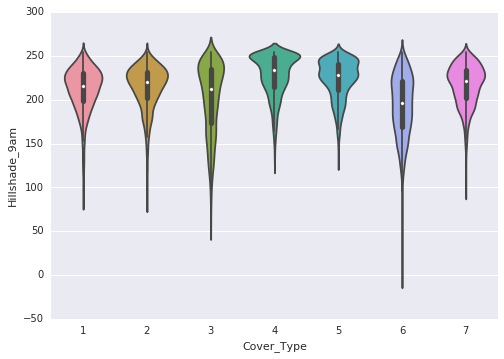
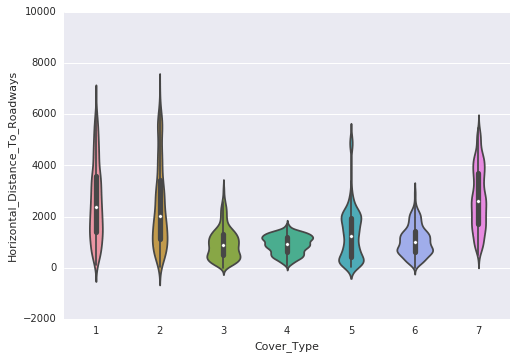
Following are the observations that are made through the violin plots:
- Elevation exhibits a distinct distribution for most classes. It is highly correlated with the target variable, making it a significant attribute.
- Aspect displays multiple normal distributions across several classes.
- Horizontal distance to both roads and hydrology follows a similar distribution.
- Hillshade at 9 a.m. and 12 p.m. exhibits a left skew.
- Hillshade at 3 p.m. follows a normal distribution.
- There are numerous zeros in the vertical distance to hydrology.
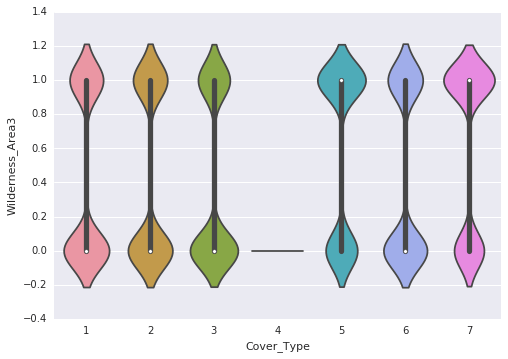
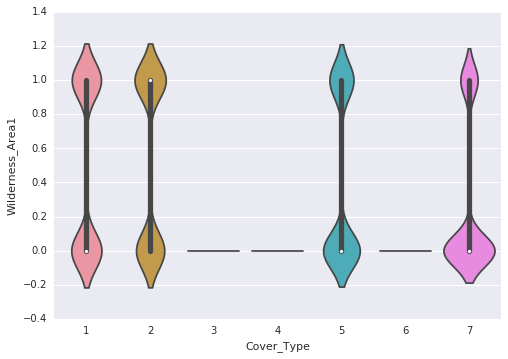
- Wilderness_Area3 does not provide clear class distinction as it lacks values. However, other wilderness areas offer some potential for distinguishing classes.
- Certain Soil_Type values, specifically 1, 5, 8, 9, 12, 14, and 18-22, as well as 25-30, and 35-40, contribute to class distinction due to their absence in many classes.
Grouping of One Hot Encoded Attributes
Output:
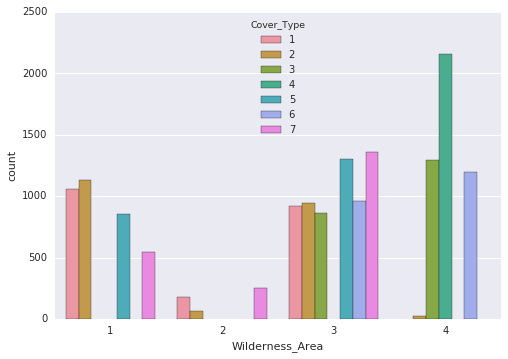
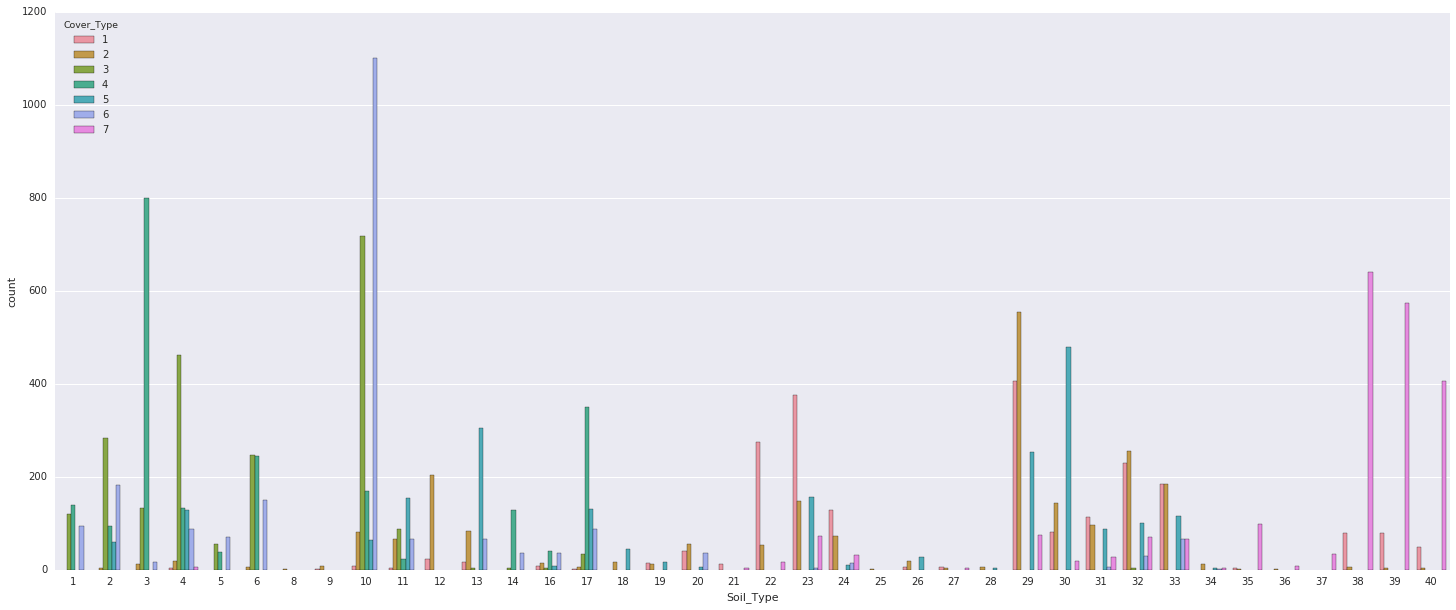
- Following are the things that we can conclude from the plot:
- There is a substantial presence of WildernessArea_4 in cover_type 4, indicating a strong class distinction.
- WildernessArea_3 doesn't provide significant class distinction
- SoilType 1-6, 10-14, 17, 22-23, 29-33, 35, and 38-40 contribute significantly to class distinction, as they have notably high counts in some cases.
Now we will remove the unnecessary columns.
Output:

Above are the columns that are dropped.
Here we will do the following operations:
- Original
- Delete rows or impute values in case of missing
- StandardScaler
- MinMaxScaler
- Normalizer
It is a critical step in the data preprocessing phase of machine learning. It involves choosing a subset of the most relevant and informative features (variables or columns) from the dataset while discarding irrelevant or redundant ones.
Output:
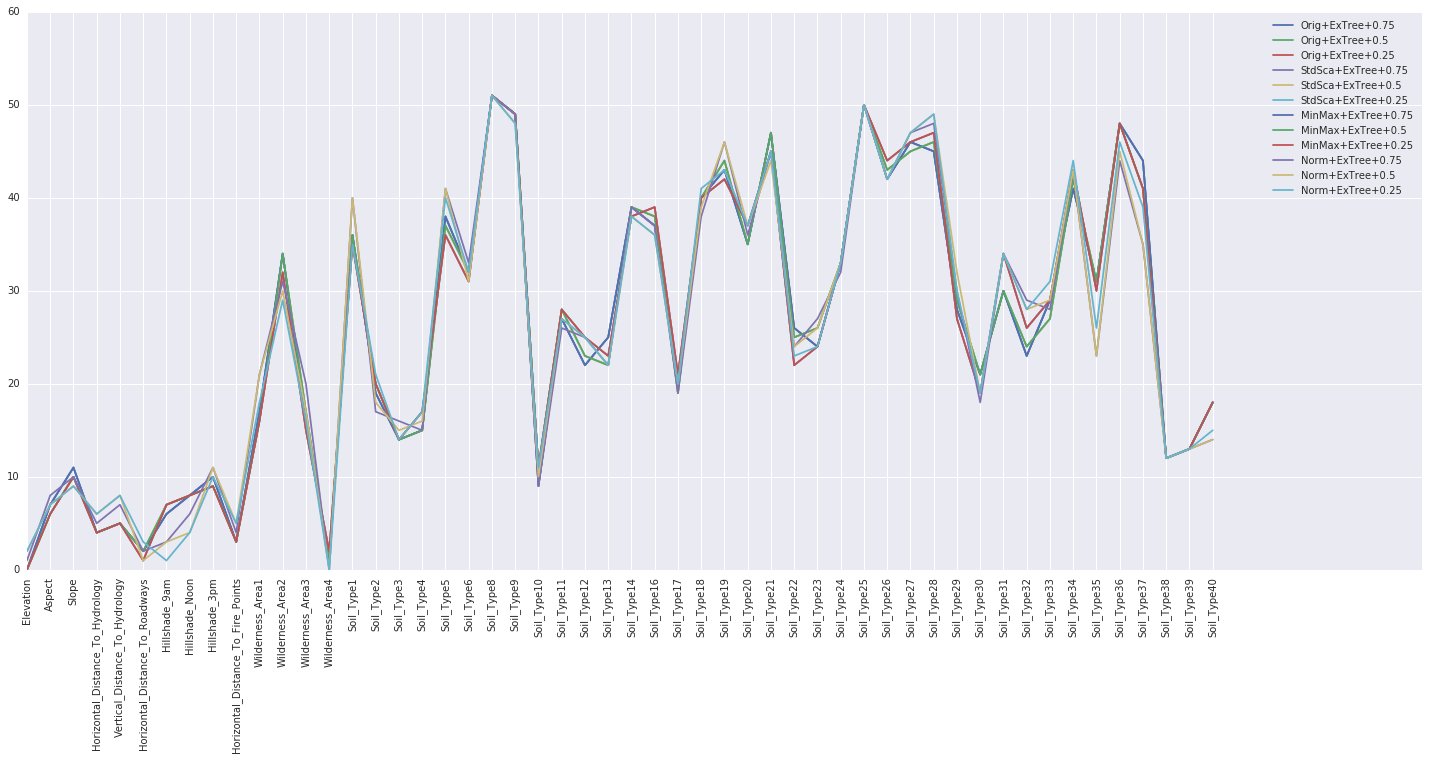
A ranking summary is a report or listing that provides information about the importance or ranking of individual features (variables) within a dataset. This summary is crucial for understanding the relevance and contribution of each feature to a machine-learning task and for making decisions about which features to include or exclude in a predictive model.
Output:
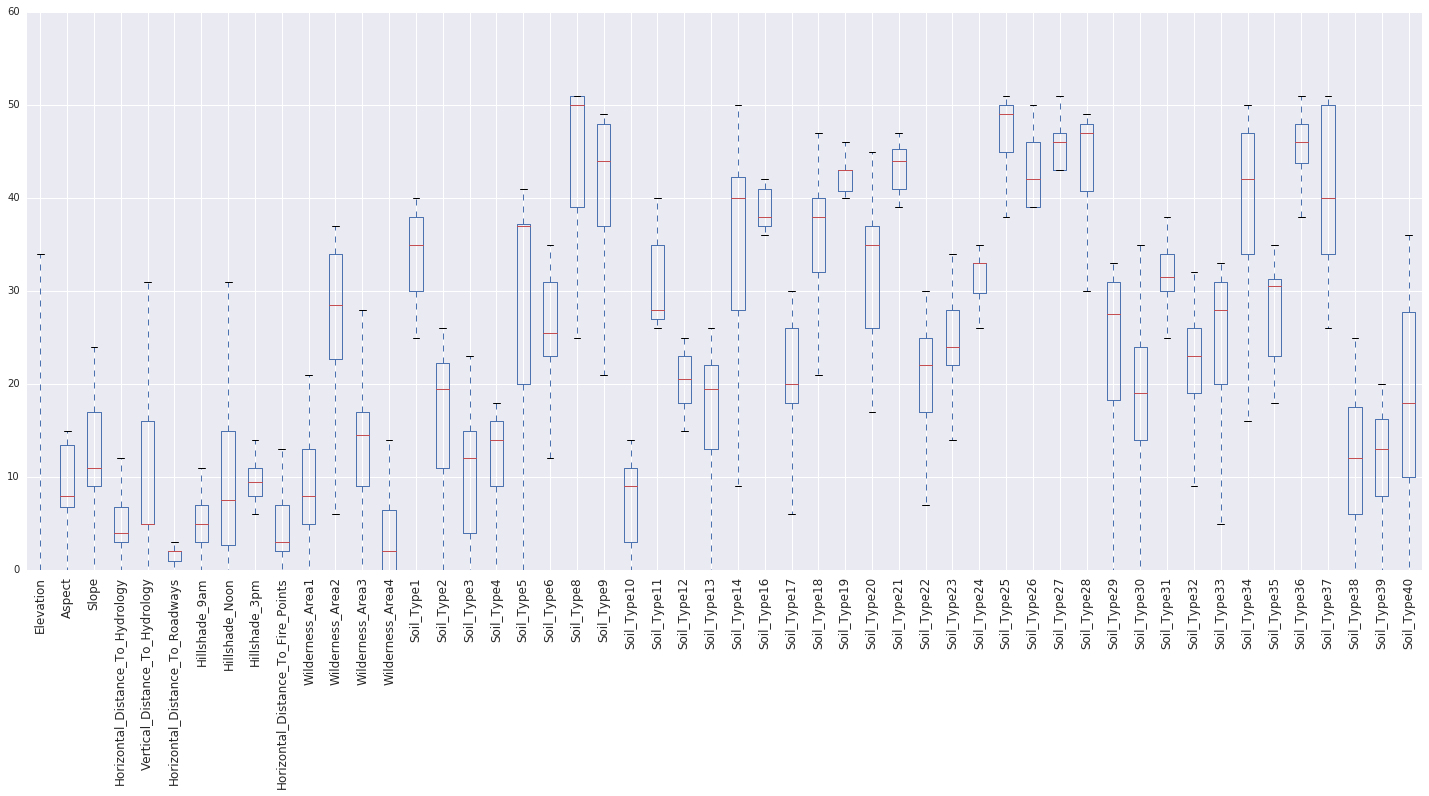
Rank Features Based on Median
Ranking features based on their median values is a straightforward approach to feature selection.
Output:
Highest Median (Most Variability):
- Soil_Type8
- Soil_Type25
- Wilderness_Area2
Lowest Median (Least Variability):
- Elevation
- Horizontal_Distance_To_Hydrology
- Horizontal_Distance_To_Fire_Points
Now we will select features, based on the median ranking as it looks best case among other feature selection approaches.
Model
We will proceed to employ a range of machine-learning algorithms.
01. Linear Discriminant Analysis
02. Logistic Regression
03. KNN
04. Naive Bayes
05. Decision Tree Classifier
06. Support Vector Machine
07. Bagged Decision Tree
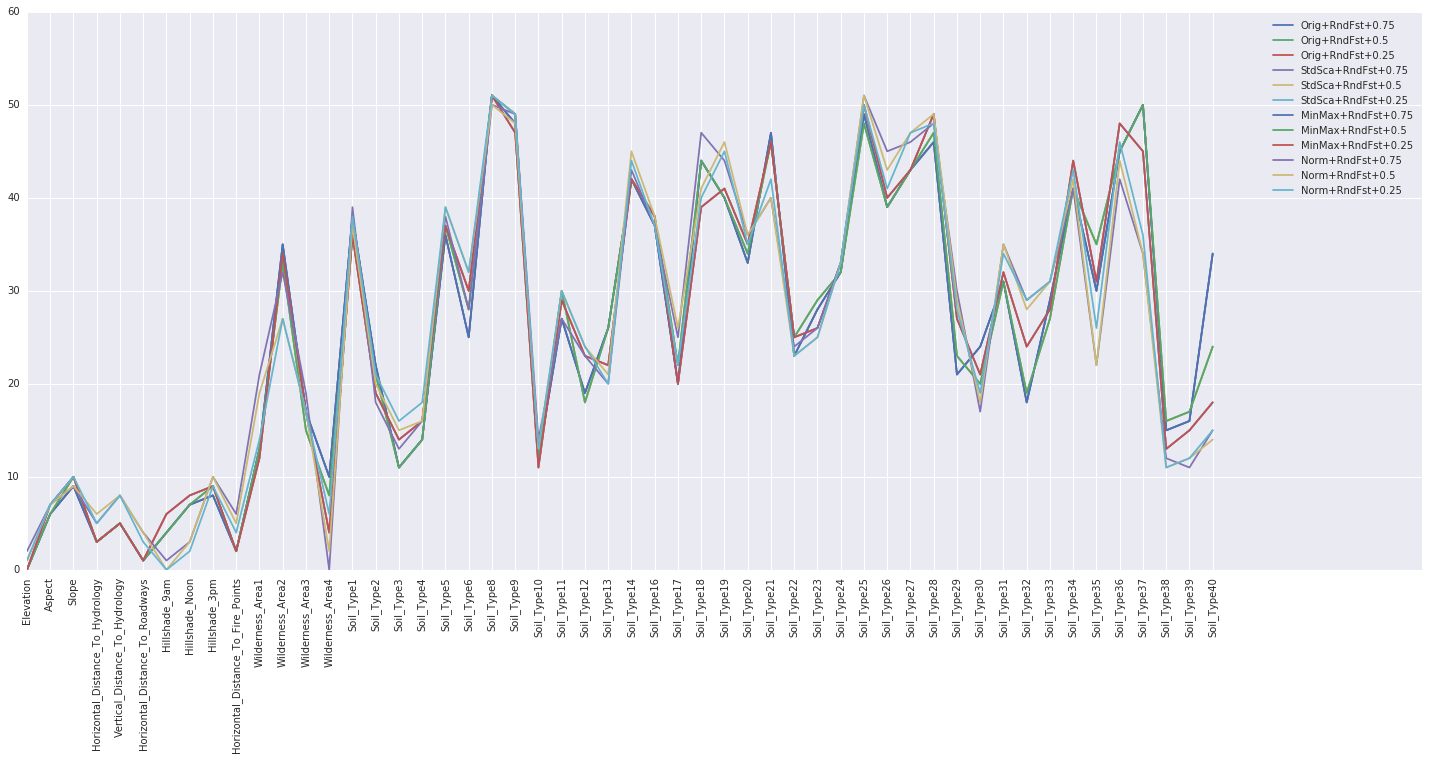
08. Random Forest Classifier
09. Extra Tree Bagging
10.AdaBoost (Boosting)
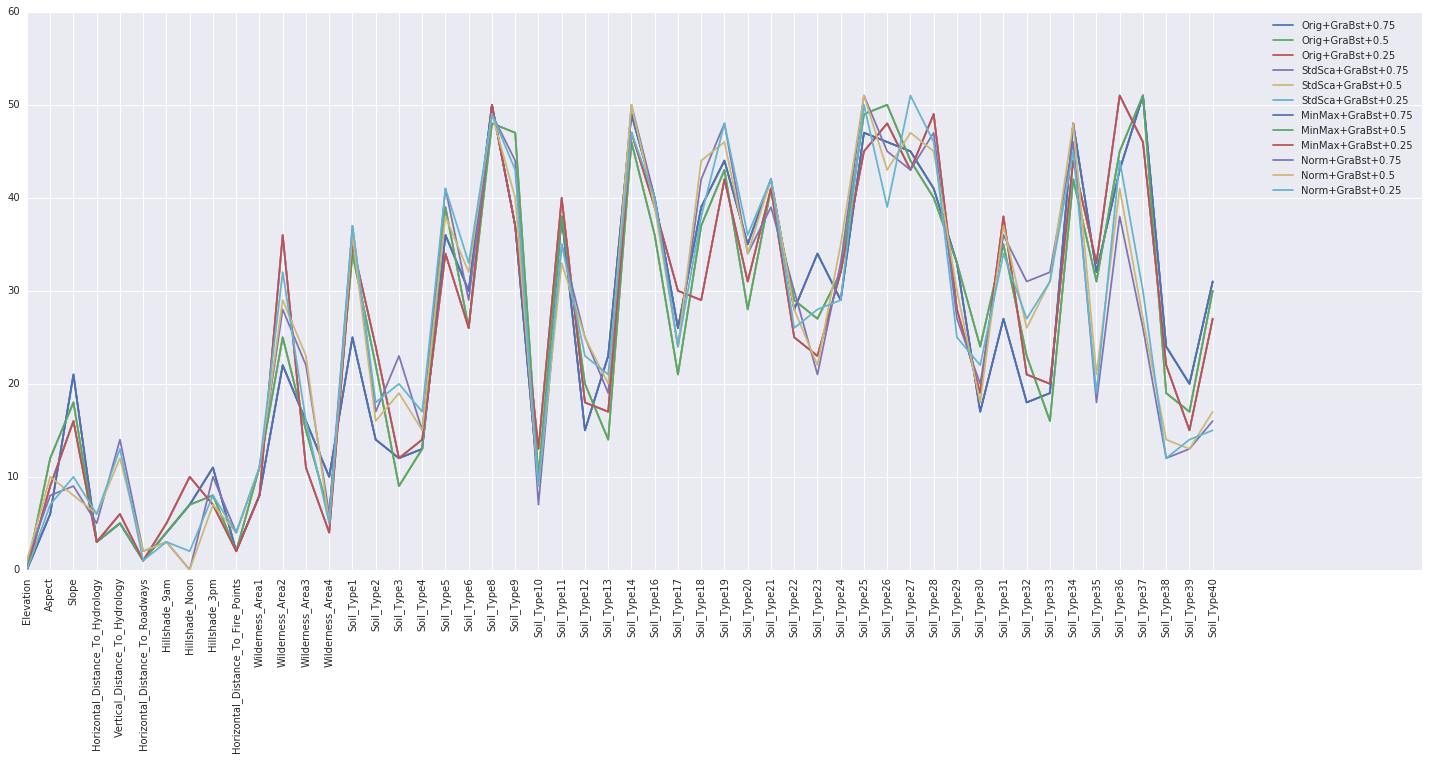
11. Gradient Boosting Classifier
12. Voting Classifier
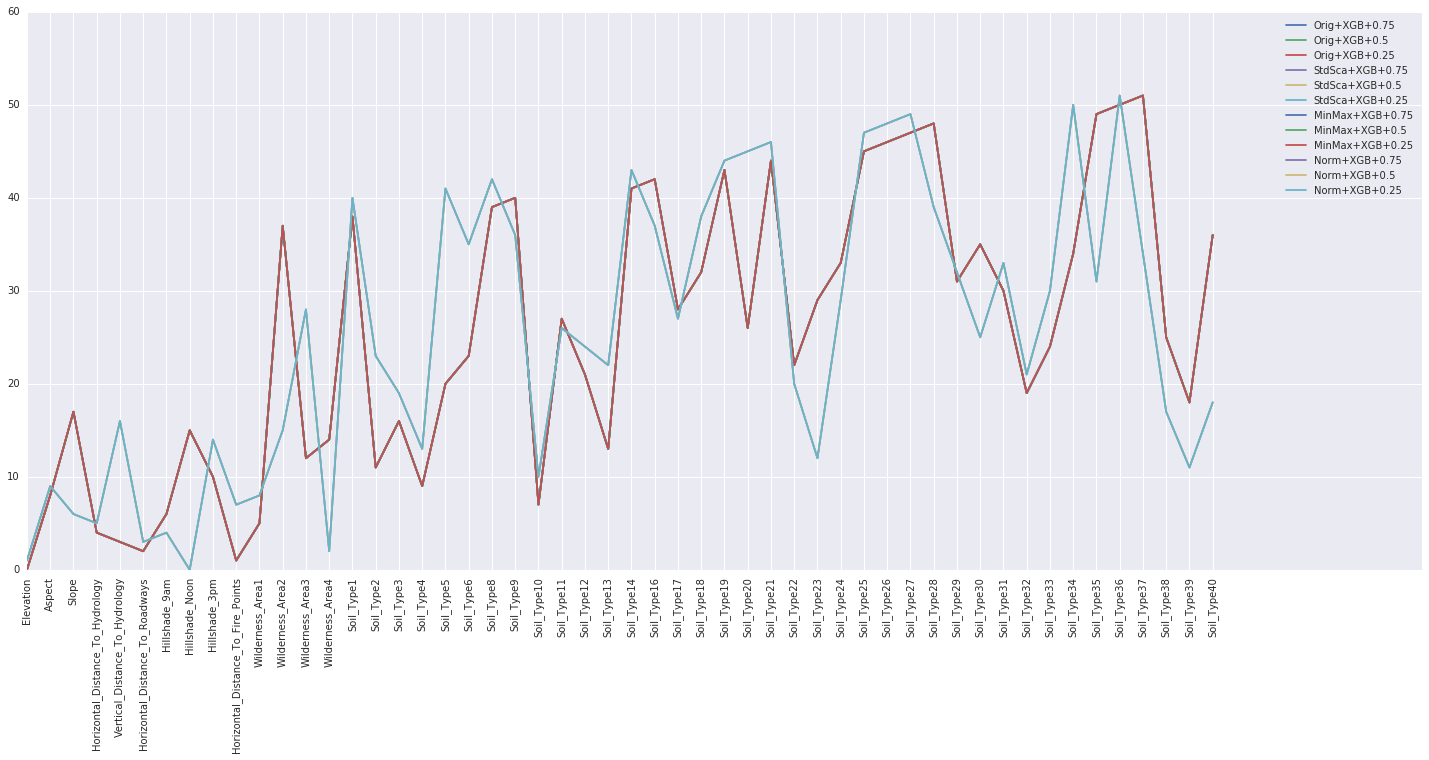
13. XGBoost
Model Evaluation
Output:
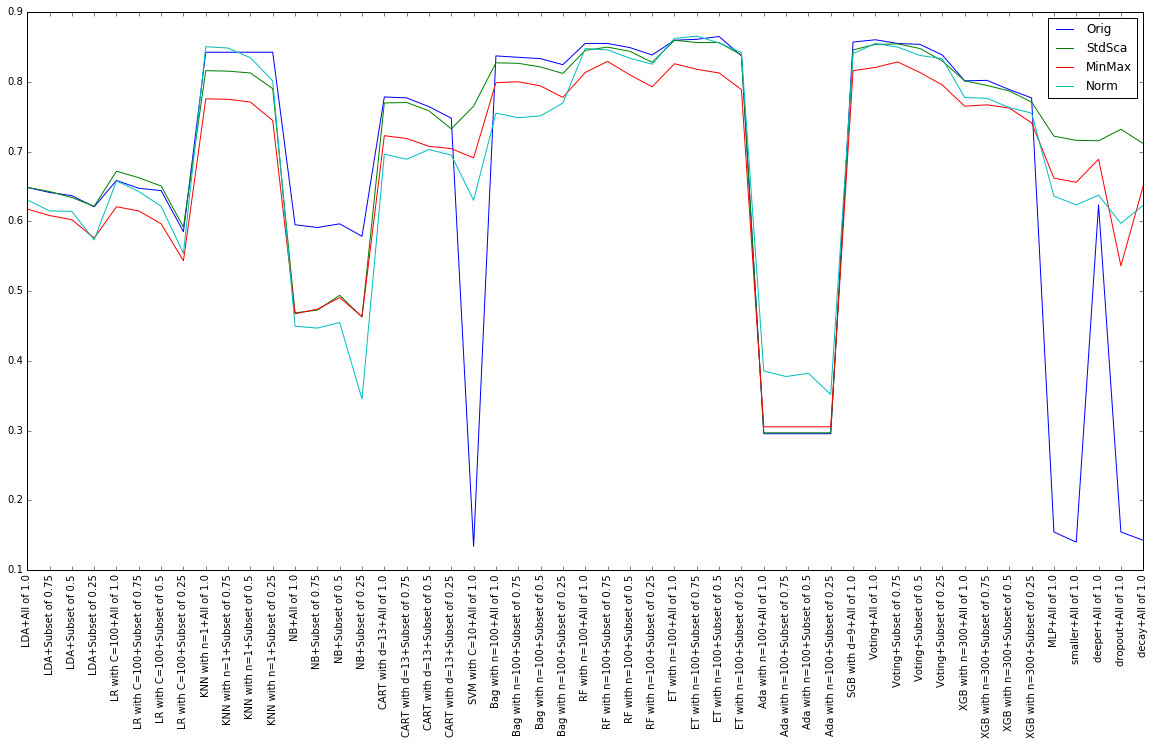
Following are the observations that are made through the model evaluation:
- Linear Discriminant Analysis: The highest estimated performance stands at 65%, achieved when utilizing all features without any transformations. However, the performance of MinMax scaling and Normalizer techniques is notably subpar.
- Logistic Regression: The highest estimated performance near 67% is attained using Logistic Regression (LR) with a value of C equal to 100, considering all attributes, and applying standardization to the data. Furthermore, performance tends to enhance as the value of C increases. Conversely, the performance of Normalizer and MinMax Scaler methods is generally unsatisfactory
- KNN: The optimal estimated performance hovers around 86% when n_neighbors is set to 1, and the data is normalized.
- Naive Bayes: The highest estimated performance is approximately 64%. The original dataset, even with only a 50% subset, outperforms all variations of Naive Bayes (NB) transformations.
- Decision Tree Classifier: The top estimated performance is nearly 79%, achieved when the maximum depth is set to 13 and when using the original dataset.
- SVM: The training time is significantly longer compared to other algorithms. The performance is notably inadequate for the original dataset, underscoring the significance of data transformation. The optimal estimated performance is around 77% when C is set to 10 and when using StandardScaler with a subset of 0.25.
- Bagged Decision Tree: The highest estimated performance is nearly 82%, achieved with 100 n_estimators when using the original dataset.
- Random Forest: The top estimated performance reaches almost 85% with 100 n_estimators.
- Extra Trees: The highest estimated performance approaches 88% with 100 n_estimators, StandardScaler, and a subset of 0.75.
- AdaBoost: The top estimated performance is approximately 38% with 100 n_estimators.
- Gradient Boost: The training time is excessively long. The optimal estimated performance nears 86% when the depth is set to 7.
- Voting: The highest estimated performance approaches 86%.
- XGBoost: The top estimated performance is nearly 80% when using 300 n_estimators, a sub_sample of 0.25, and a subset of 0.75.
KNN, Voting, Extra Trees, and Random Forest algorithms have the highest performance for the prediction of Forest Cover type, from this, we can use any of these algorithms for future prediction of forest covers.
Conclusion
Forest cover type prediction using machine learning is a vital tool for the preservation and sustainable management of our forests. It enables us to make informed decisions, protect biodiversity, and ensure the longevity of these critical ecosystems. As technology and data continue to advance, so too will our ability to understand and protect the forests that are essential to life on Earth.
|

 For Videos Join Our Youtube Channel: Join Now


